-
-
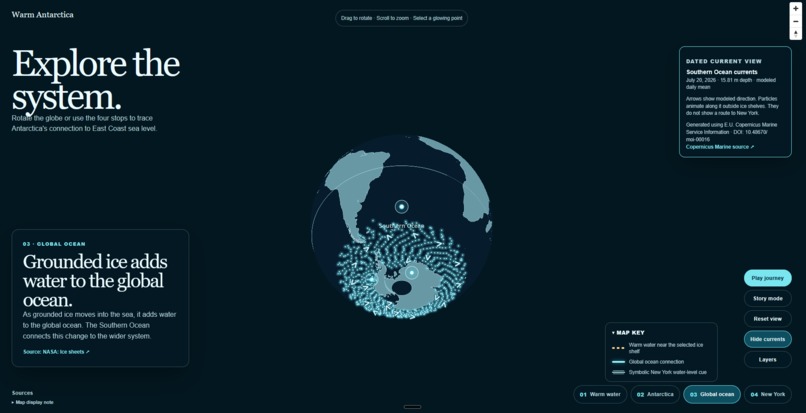
main page
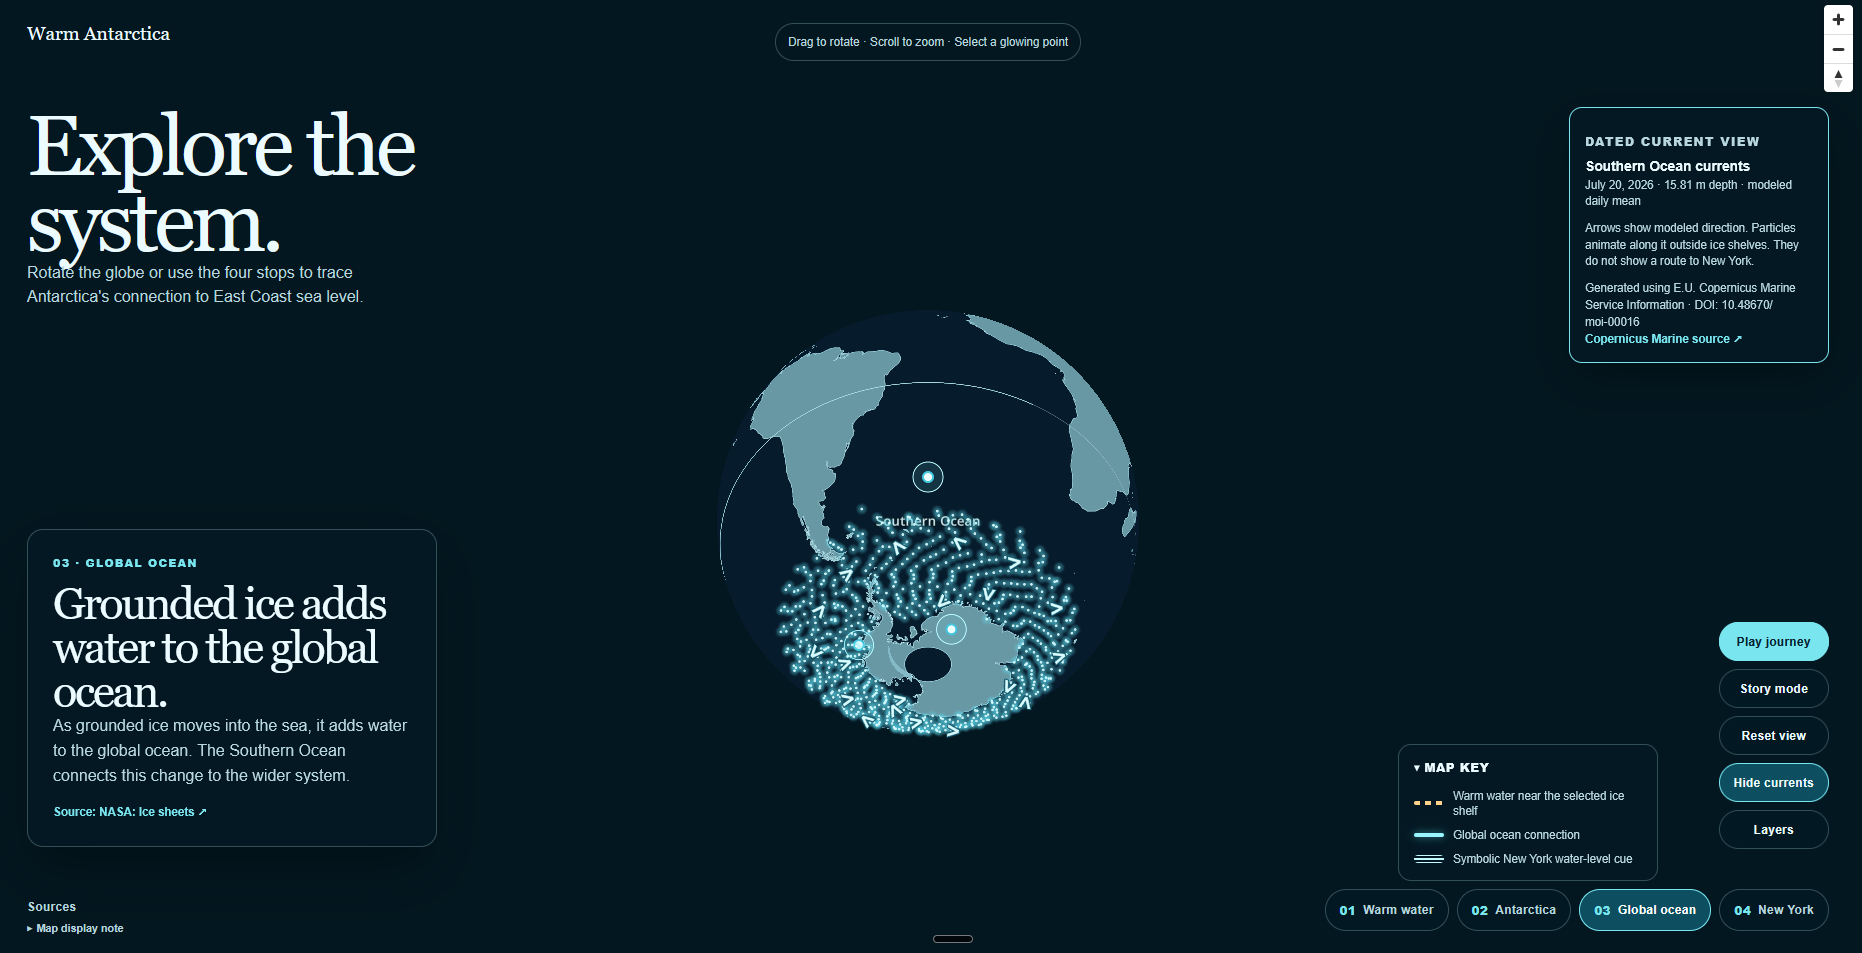
Inspiration
Antarctica affects sea level far beyond the continent and I believe not enough people understand this link or know about it. I wanted to create a learning experience that helps visitors see how the warming of Antarctica can create increase the sea level of places far away like New York if we don't do something to mitigate this issue.
What it does
Warm Antarctica is an interactive 3D climate-learning map. Learners can rotate a globe, select glowing locations, or follow a guided journey through four connected ideas:
- Relatively warm ocean water can reach Antarctic ice shelves.
- Ocean heat can thin floating ice shelves from below.
- When grounded ice moves into the ocean, you'll be able to see how it adds water to the global ocean.
- Global sea-level rise can contribute to the sea-level in places far off like New York.
The warm-water stop compares the Amundsen Sea, George VI Ice Shelf, and Totten Glacier. The Antarctica stop includes a simple ice-shelf cutaway. The Global Ocean stop adds a dated Copernicus Marine current layer with direction arrows and animated particles. The New York stop ends with a quick knowledge check. Antarctic ice loss is one contributor to sea-level change alongside ocean warming, regional ocean behavior, and local land motion. This project was designed to show you the effects of just one contributor and make you think about how its just one aspect of global warming.
How I built it
I built the project with TypeScript, React, Next.js, MapLibre GL JS, and a Cloudflare-compatible deployment stack. Scientific explanations link to primary sources from NASA, NOAA, the British Antarctic Survey, NASA JPL, and the Copernicus Marine Service.
I used Codex with GPT-5.6 Terra and Sol throughout the project. Codex helped inspect the repository, implement the MapLibre globe, build the guided journey and Story mode, create responsive and accessible controls, write regression tests, diagnose interaction bugs, and prepare deployment documentation. GPT-5.6 helped research the scientific framing, compare technical options, refine the educational explanations, and identify claims that needed correction. I approached the project with one idea, reviewed the results and made the final science, product, and design decisions.
Challenges
The hardest challenge was balancing a visually compelling story with scientific accuracy. Early concepts implied a direct flow of Antarctic water toward New York which is not what the evidence supports. The final map separates the local warm-water and ice-shelf process from the global sea-level connection.
Another challenge was coordinating map interactions. Guided playback, manual Story mode scrolling, zooming, camera movement, and animated layers all compete for control of the same globe. Trying to think of a good design to show all of these moving parts was something I was thinking about for a while. A late test found that Story mode scrolling could still trigger MapLibre zoom. I fixed the event boundary and added a regression test so Story mode captures wheel input before the map can zoom.
What I learned
I learned that an educational visualization needs to explain both what it shows and what it does not show. We also need to make it more animated so that people can clearly imagine the flow of water and the realistic dangers that may soon come our way. Clear limitations, direct source links, and interaction tests are part of the learning experience. I do not want to be a person who spreads misinformation while educating people about the dangers of ice loss.
What's next
Future work could add more dated ocean datasets and carefully designed regional comparisons. I was also thinking of adding more globes to show different ways a Warm Antarctica effects different parts of the world. I also wanted to add a inner depth layer so we can visualize where the warm water flows instead of just showing the water flowing on the surface of the globe.
Built With
- cloudflare-workers
- codex
- copernicus-marine-service
- gpt-5.6
- maplibre-gl-js
- nasa
- next.js
- noaa
- react
- typescript
- vite

Log in or sign up for Devpost to join the conversation.