-
-
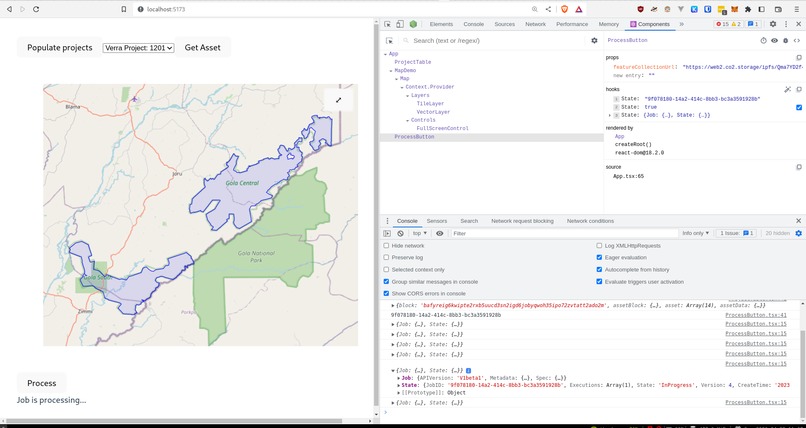
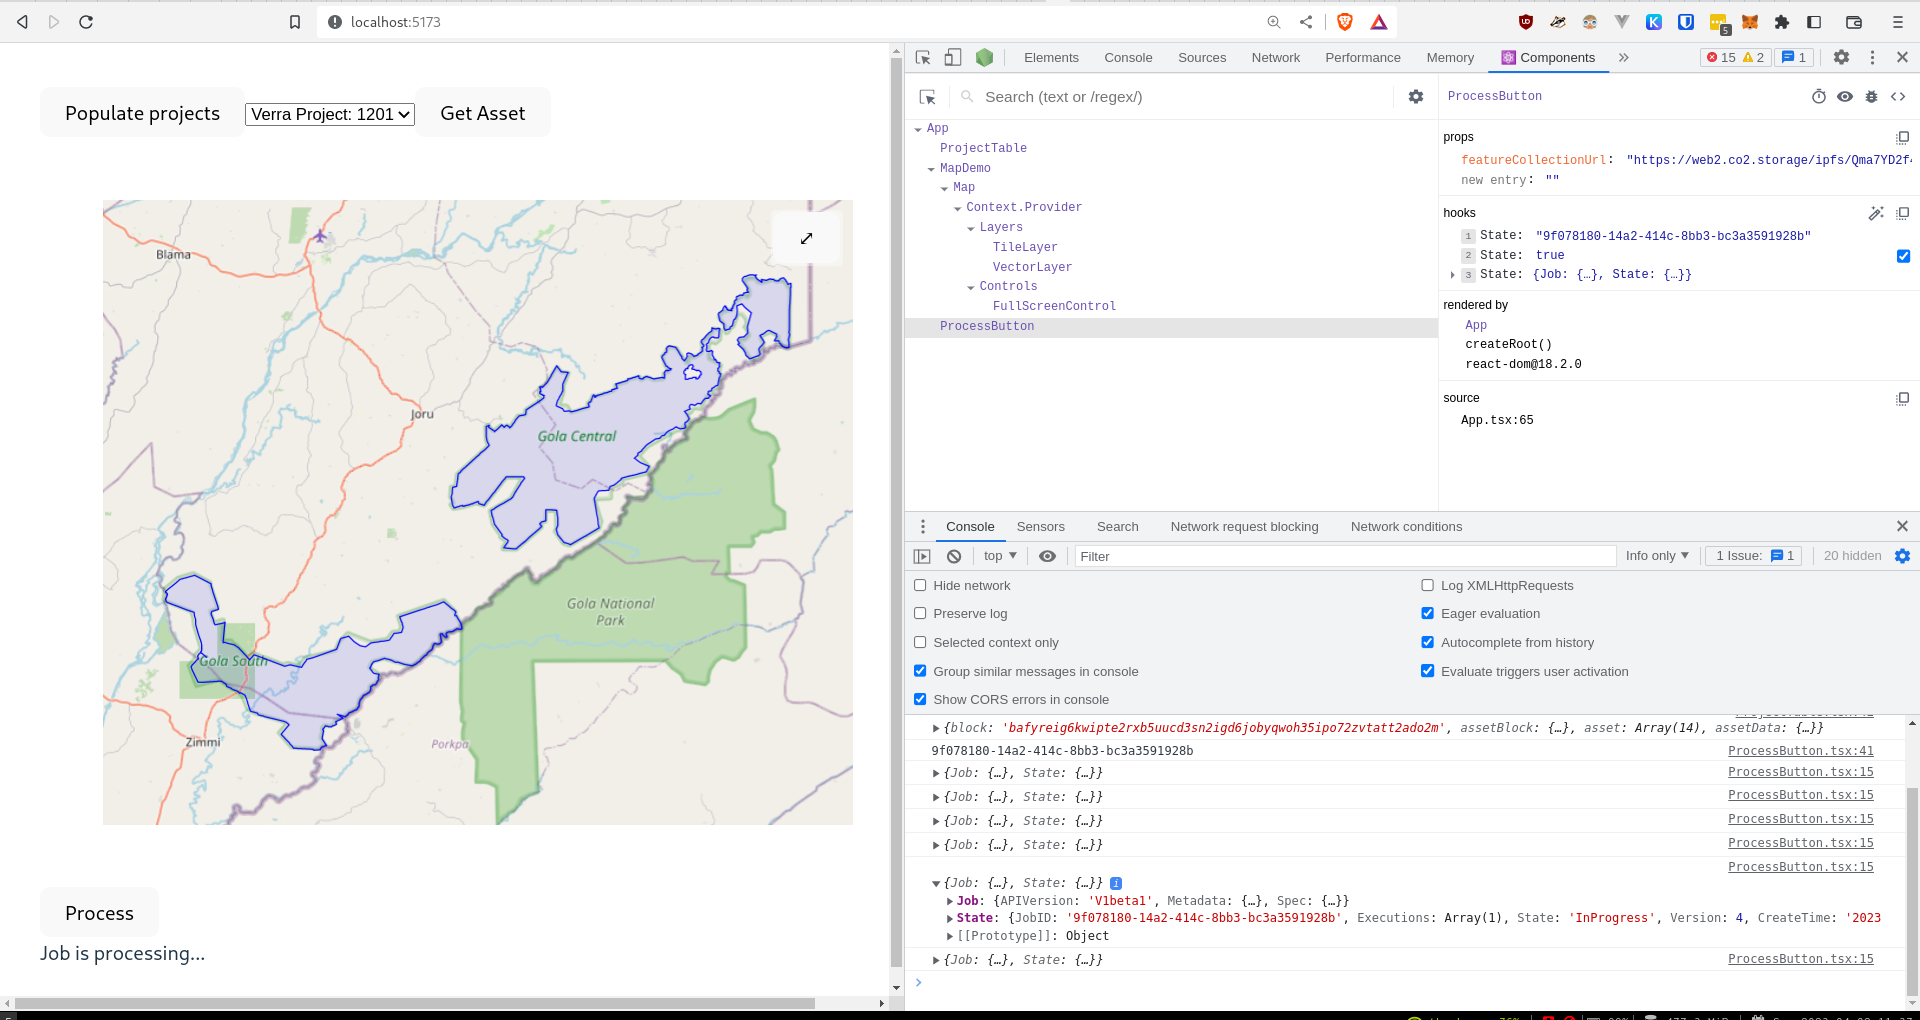
Forestry webapp
-
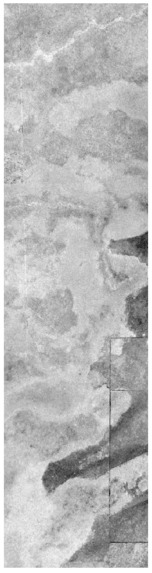
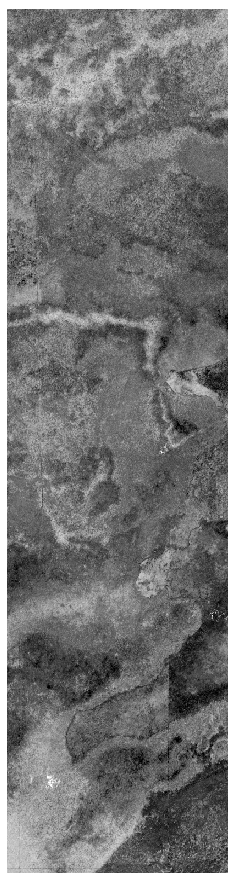
Low NDVI summary early in project
-

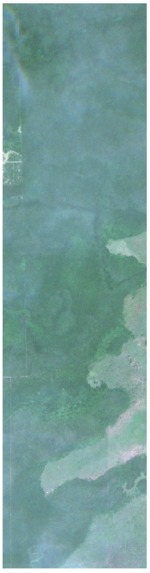
High NDVI summary later in project
-
RGB of project


Inspiration
Our background is creating open source record keeping, survey and soil stratification tools for farmers and land stewards. We saw the SBS hackathon as a great opportunity to learn more about decentralized and distributed systems especially in the context of ecological assets which are of interest to us. The tracking deforestry bounty inspired us to use our existing skillsets and explore a concept for using satellite imagery to observe changes in a forest and hold these observations in context with a forestry carbon project. Ultimately, such a tool should enable the user to feel like they are walking through the forest in dimensions of space and time.
What it does
Out webapp allows you to query CO2.Storage for assets that provide a geospatial project boundary. Currently the webapp supports Verra Projects with GeoJSON provided in a GeoCid property.
After selecting a project the map is updated with the project's boundary. The user is then presented with options to process satellite imagery over the project area for a given time range.
Once a submitted, a Bacalhau job is submitted to run a docker container that fetches Sentinel imagery efficiently using Cloud Optimized GeoTIFFs. We have two processing options: RGB or NDVI-Summary. RGB will create RGB GeoTIFFs for each available satellite image in the given time range. NDVI Summary will compute the max NDVI over the time range, accounting for cloud cover and only computing NDVI for pixels with a vegatation classification. Computing the NDVI over a time range can be a more accurate way to assess the life of a forest, as Satellite imagery snapshots in time can be quite variable.
After the satellite imagery is processed and a GeoTIFF raster(s) is generated, Bacalhau pins the output to IPFS and the resulting CID is displayed to the user in our webapp.
How we built it
Our frontend is a React app that uses the CO2.Storage JS API. It allows querying of existing CO2.Stroage assets to find a project of interest. We are using the OpenLayers mapping library because that is what we are most familiar with. It also seemed to have the best support for rendering a GeoTIFF back in the map UI, however we were not able to finish this for the hackathon.
Our Docker processing container requires network access to efficiently query Sentinel data using Cloud Optimized GeoTiffs. Because of this, we are running our own Bacalhau requester+compute node that enables network access to Docker jobs.
Our project uses a simple FastAPI backend to create and monitor the Bacalhau jobs. This was easier to configure rather than starting up the entire CO2.Storage infrastructure.
Challenges we ran into
Processing Satellite imagery is resource intensive! Our current implementation takes the bounding box for the project area. This is not ideal for projects that have many small areas dispersed over a larger area.
Rendering GeoTIFFs inside a browser-based mapping library presents multiple challenges. We learned more about how to accomplish this however did not have time to fully implement this feature.
Accomplishments that we're proud of
- CO2.Storage & Bacalhau compute
- Demonstrate efficient processing of Sentinel satellite imagery over CO2.Storage assets
- Allow networking in Bacalhau docker image for efficient querying of COG data
- Interoperability in ecological assets
- Process Sentinel data for any CO2.Storage asset that has Geojson data
- Provide NDVI results back on CO2.Storage in standard format
- Tracking deforestation
- Use Sentinel imagery to compute NDVI summaries over long time periods
What we learned
We learned about Bacalhau, CO2.Storage and IPFS/IPLD quite in depth.
What's next for Walking through the forest
Next steps for this project largely centers around improving both the UI and feature set available withing the webapp. These are largely things that we set out to accomplish but simply did not have time!
Rendering the processed results back inside the map in our webapp is a high priority. This allows for faster iteration of forest observations, not requiring files to be downloaded and opened in desktop based applications. It would also be nice to have a timeline visualization to better demonstrate when and what time range imagery came from. We would also like to expand the search and filter capability of the webapp so that we could query different types of projects that provide a GeoJSON project boundary. This would be a great thing to standardize and include in a base CO2.Storage template!
Beyond the webapp there are also improvements that could be made to the output and persistence of the satellite imagery. Right now the outputs are only pinned to IPFS, but we envision lots of potential in referencing these outputs as a CO2.Storage asset as well. We had intended to do this how the existing CO2.Storage webapp works; storing the Bacalhau job ID in an asset that references the original Verra Project CID. However, we think there would be benefit in creating an asset that contains additional metadata that the processing might output. For example, creating an asset that includes the Sentinel tile IDs and dates that were used for computing the NDVI summary. This would help create a transparent system of transformations on-chain that could be used to verify and reproduce results.
This concept of a CO2.Storage asset for the output data could also be generalized such that different types of data could be stored back as well. Right now our webapp is only capable of generating RGB and NDVI outputs, but in theory others could provide processing of a different type, that conforms + extends from a base schema compatible with our webapp. It would be fun to explore including more qualitative outputs in this process, too. For example, there is a need for indigenous communities and peoples neighboring a project boundaries to share their sentiment towards a project - is land being stolen? Are people being impacted positively or negatively by a project?

Log in or sign up for Devpost to join the conversation.