-
-
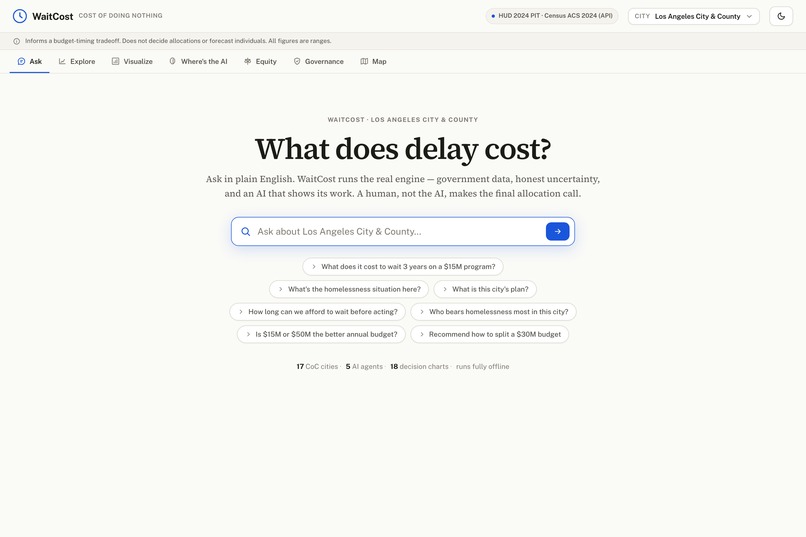
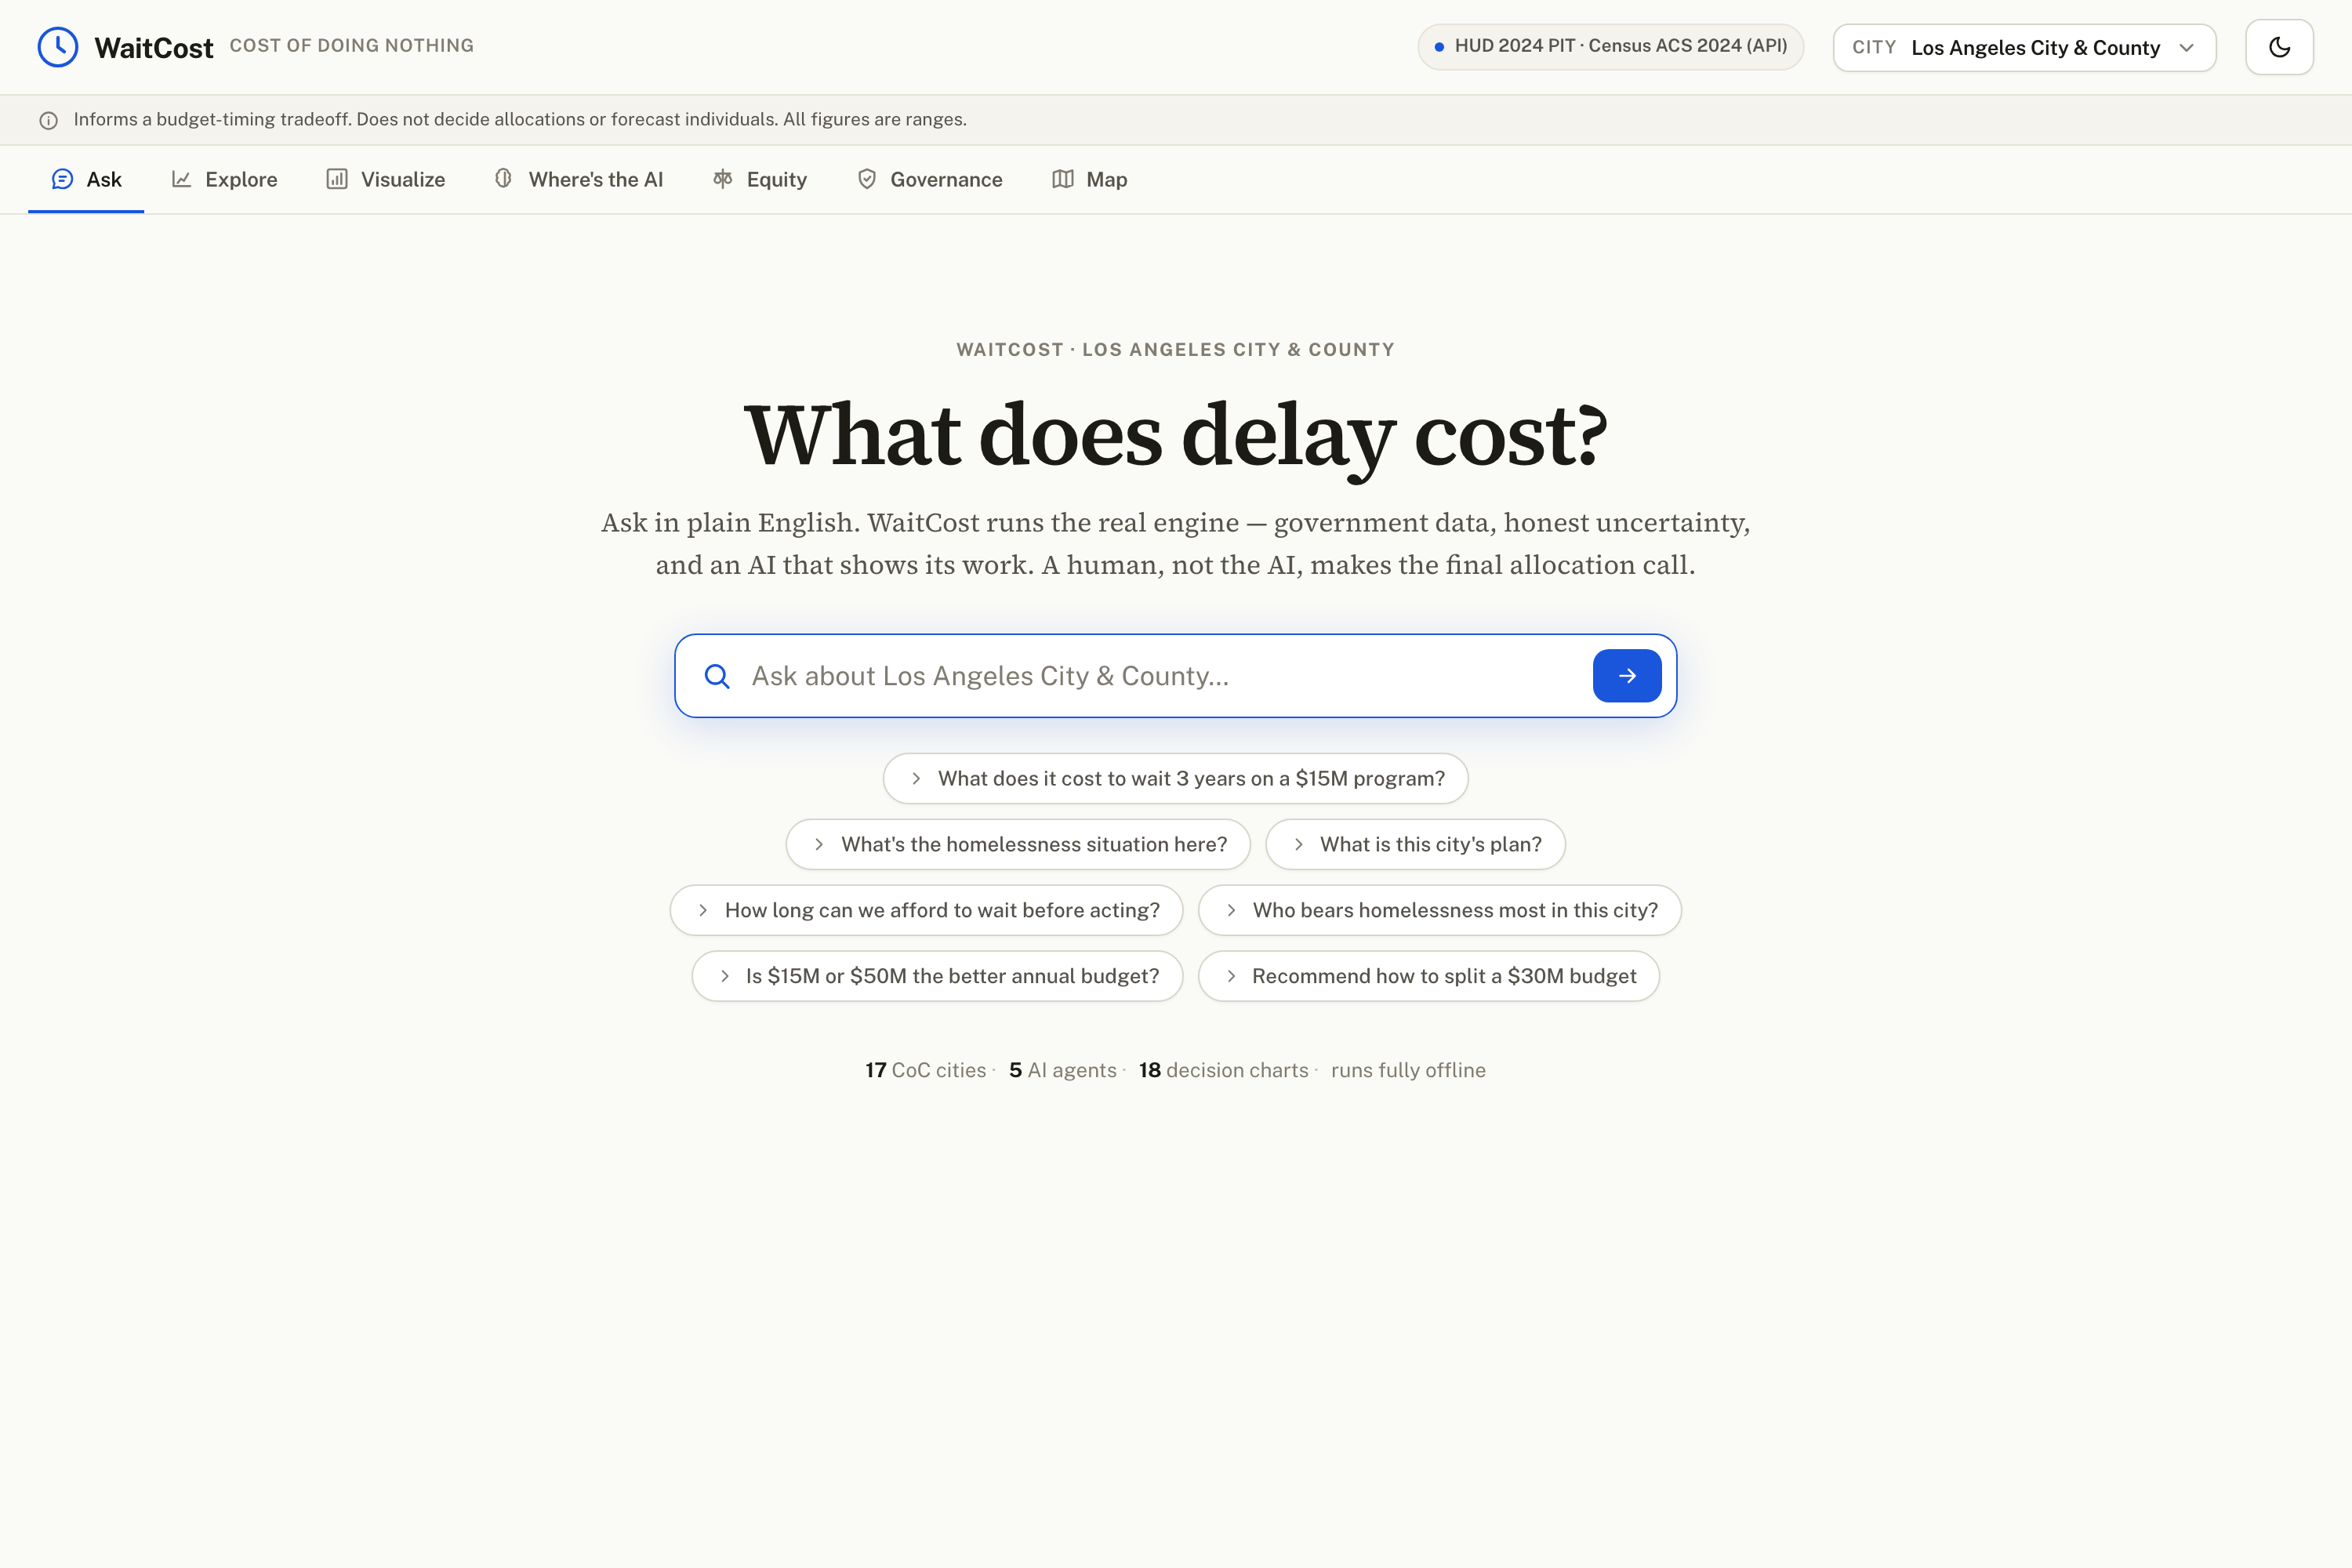
ask question
-
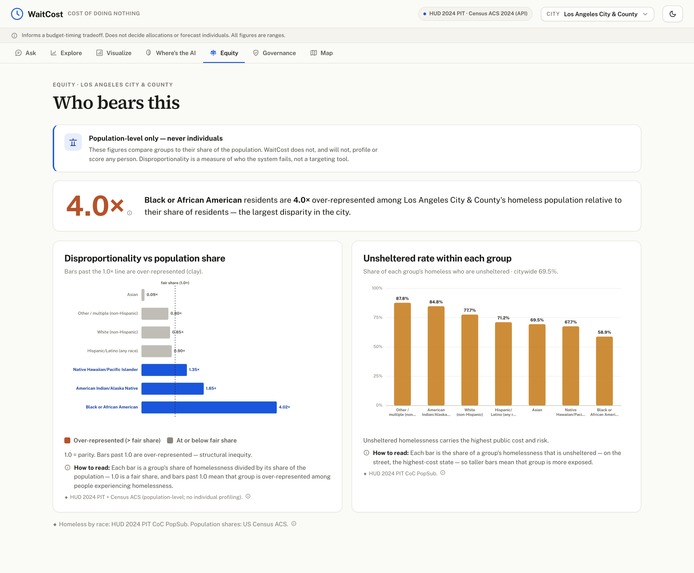
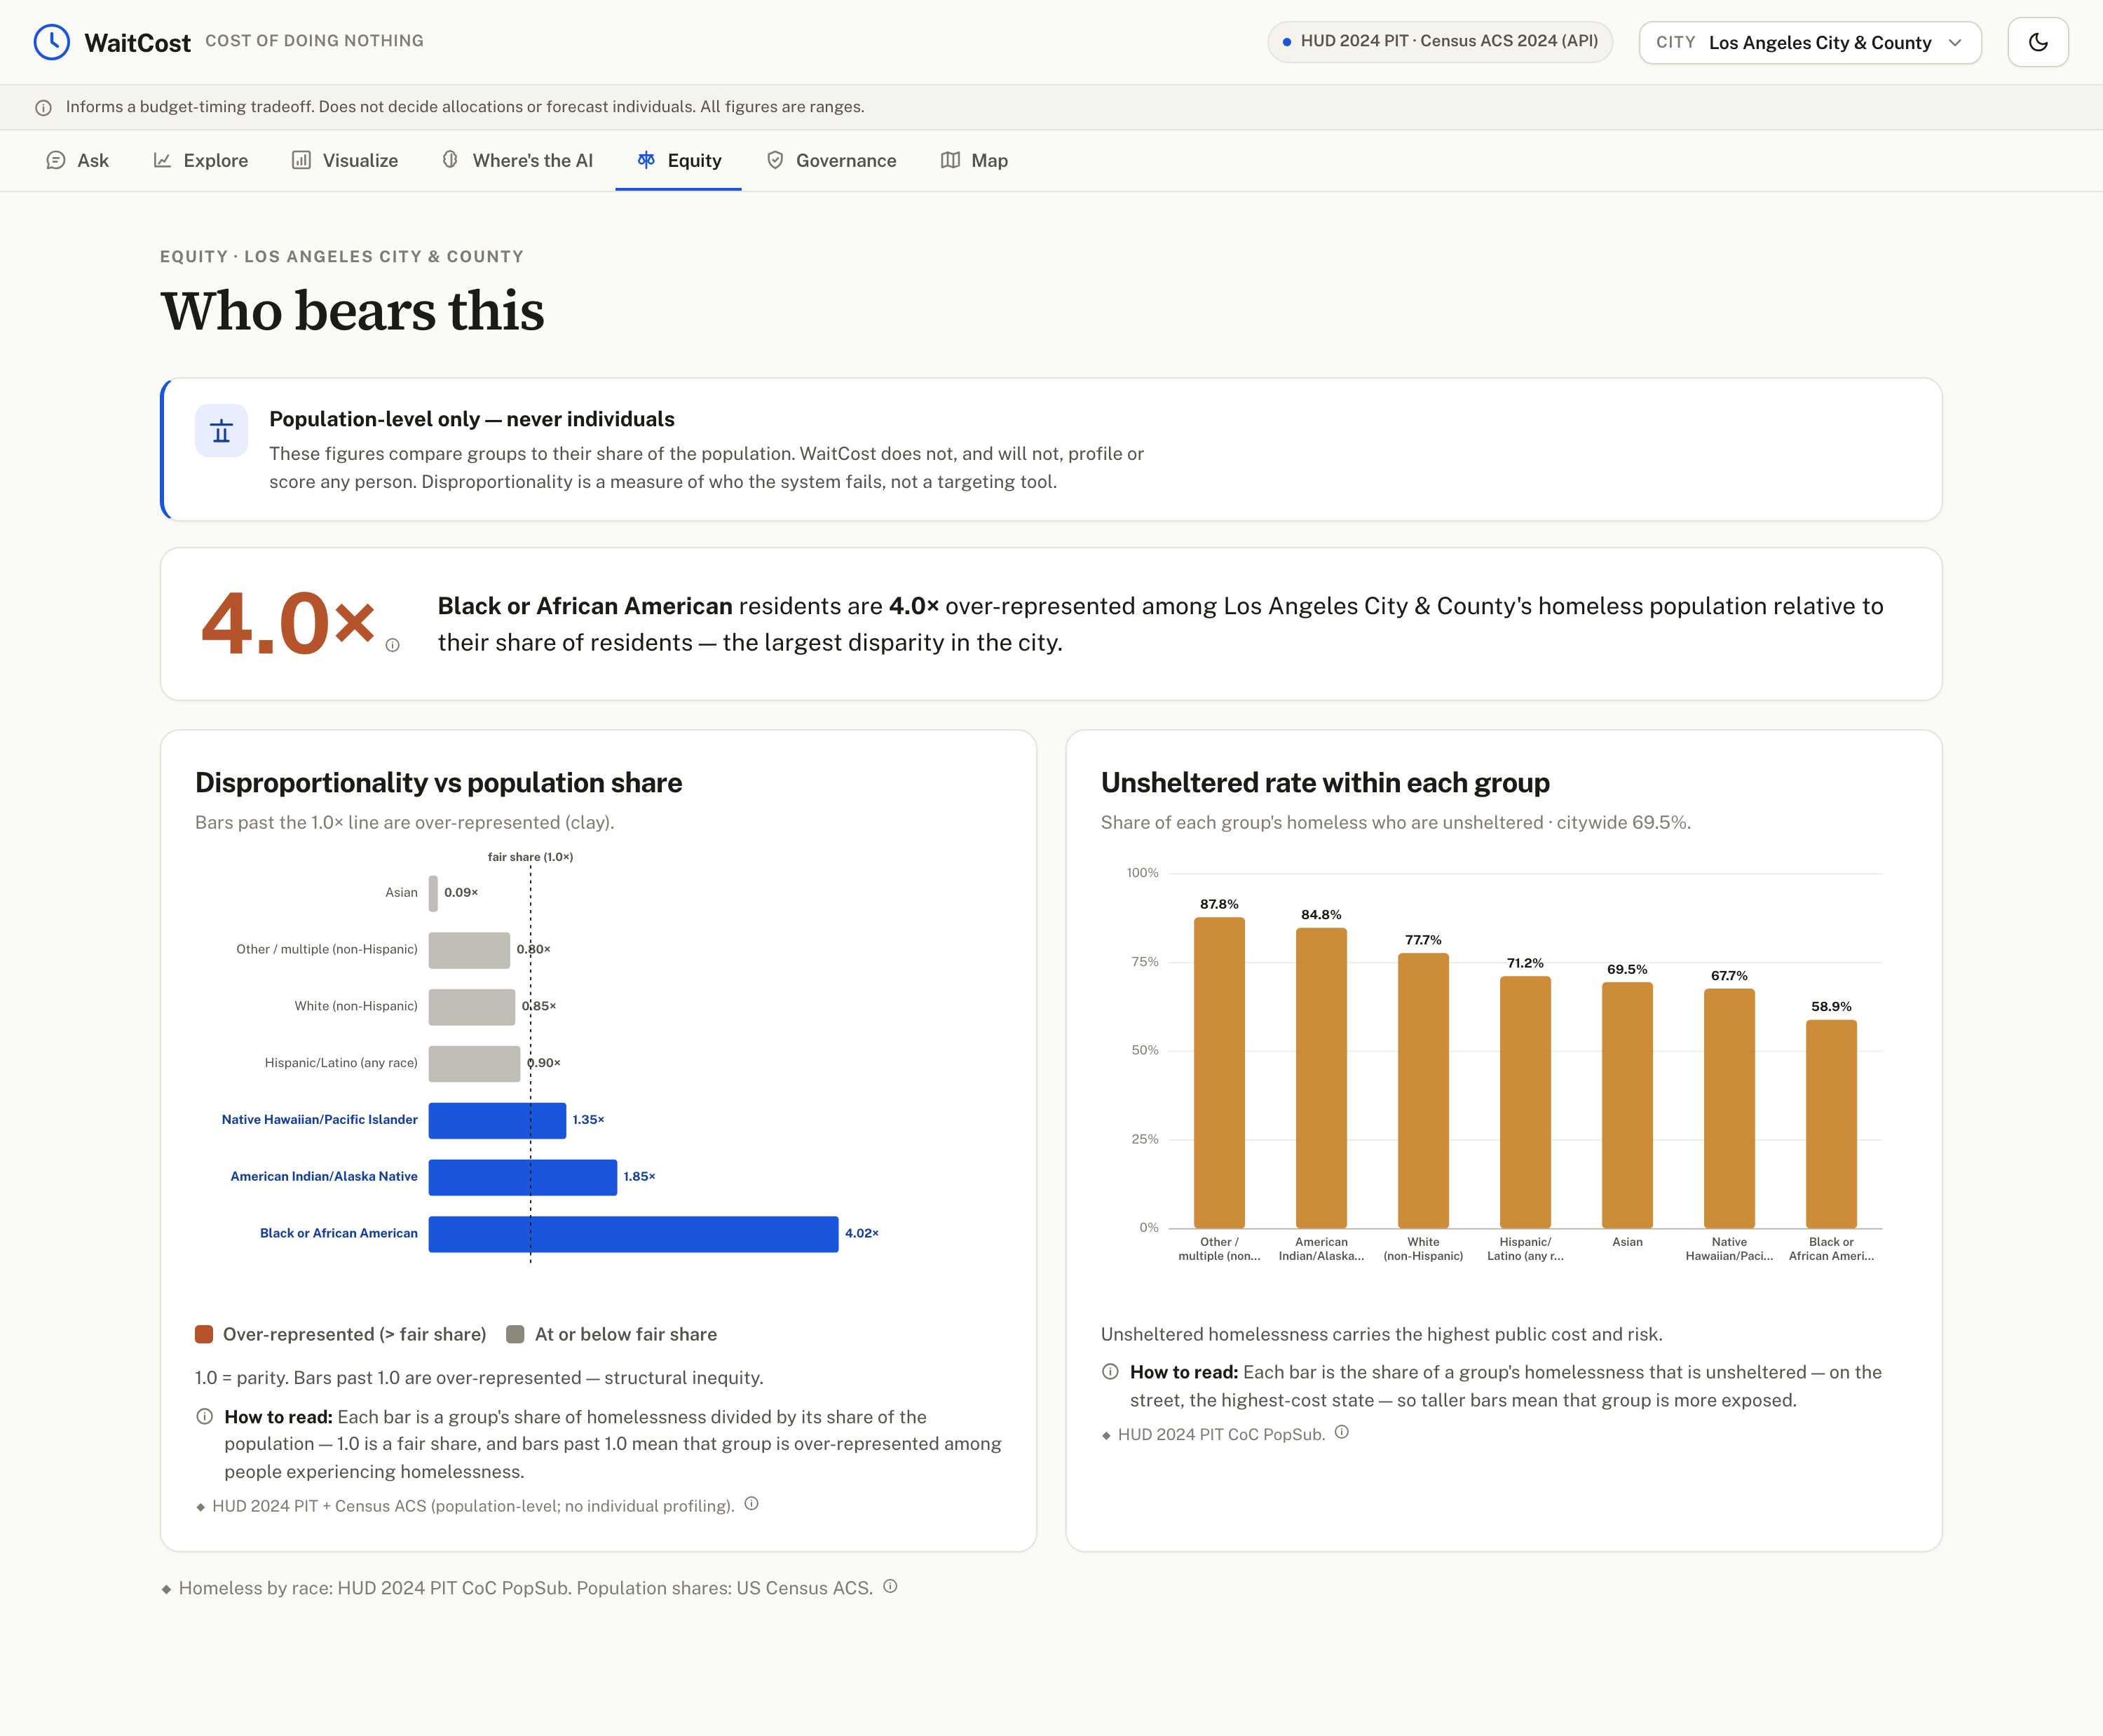
Equity, who bears this
-
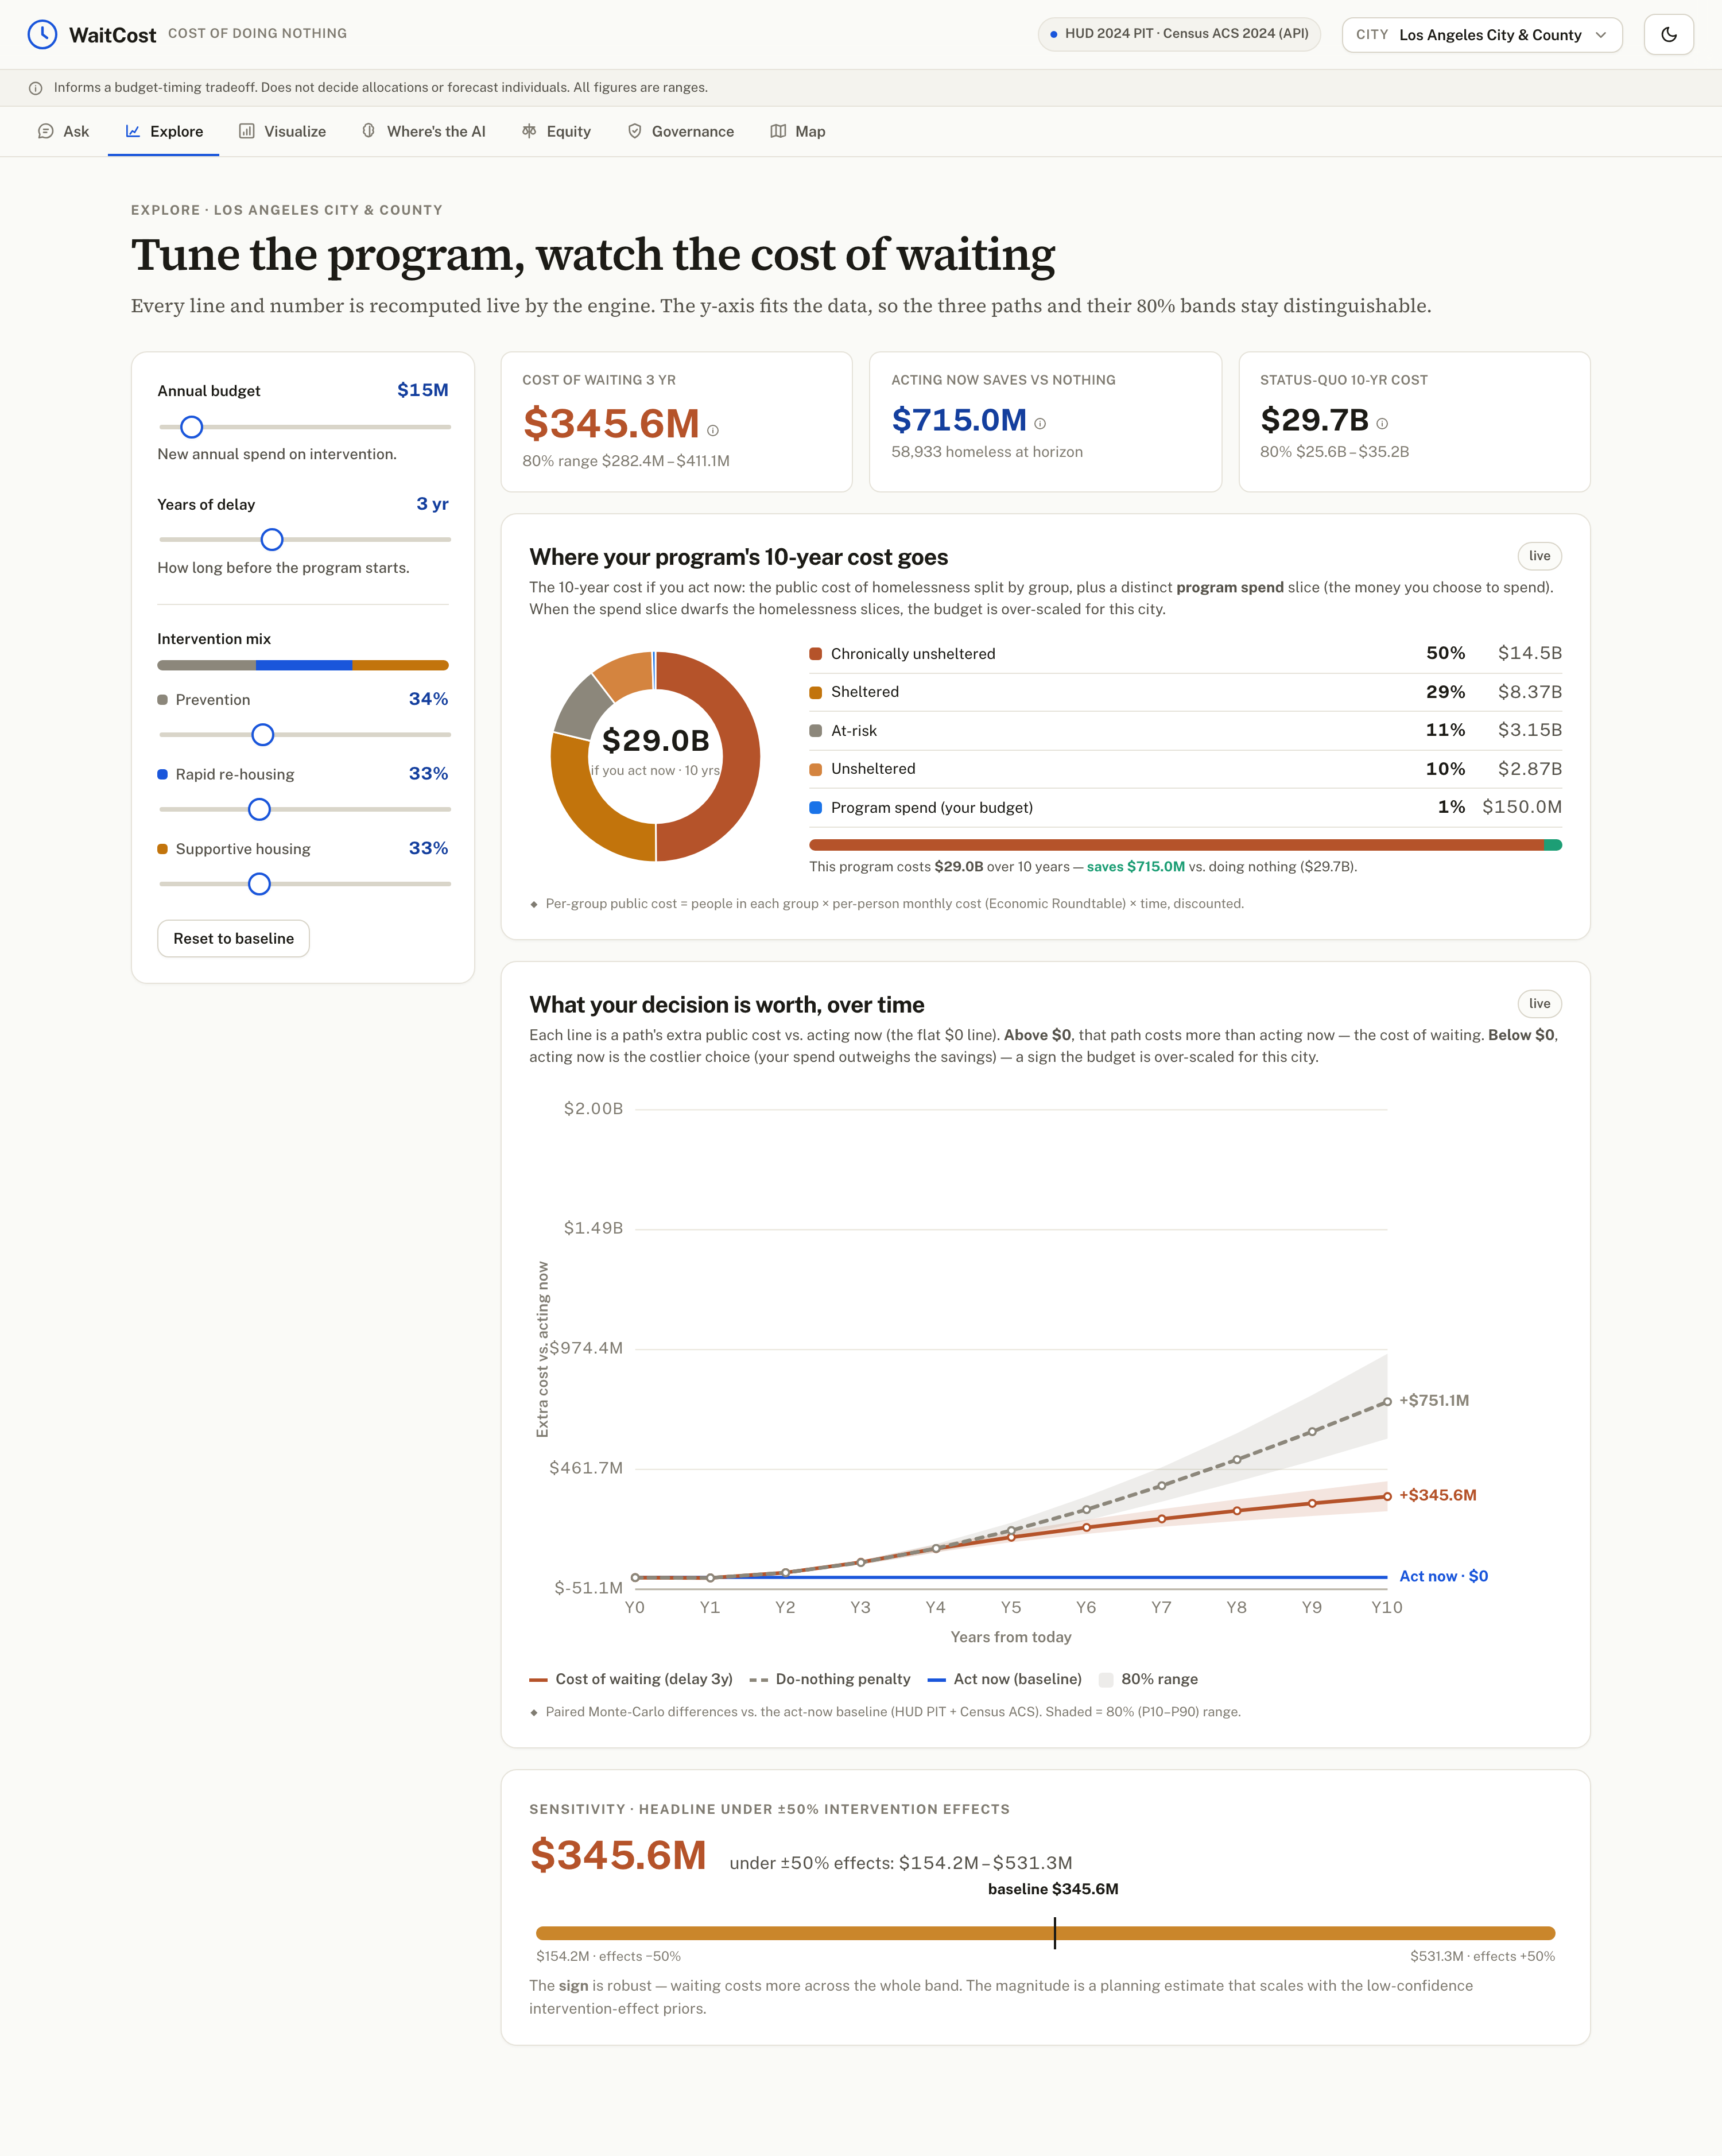
Explore details about cost of waiting to a city selected
-
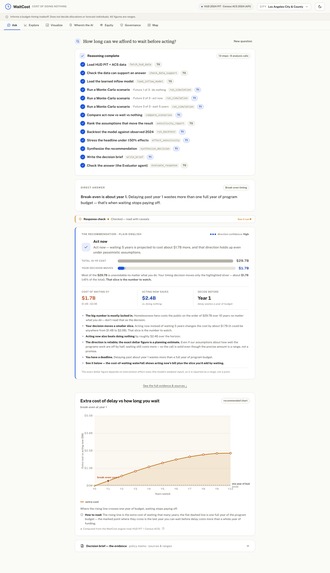
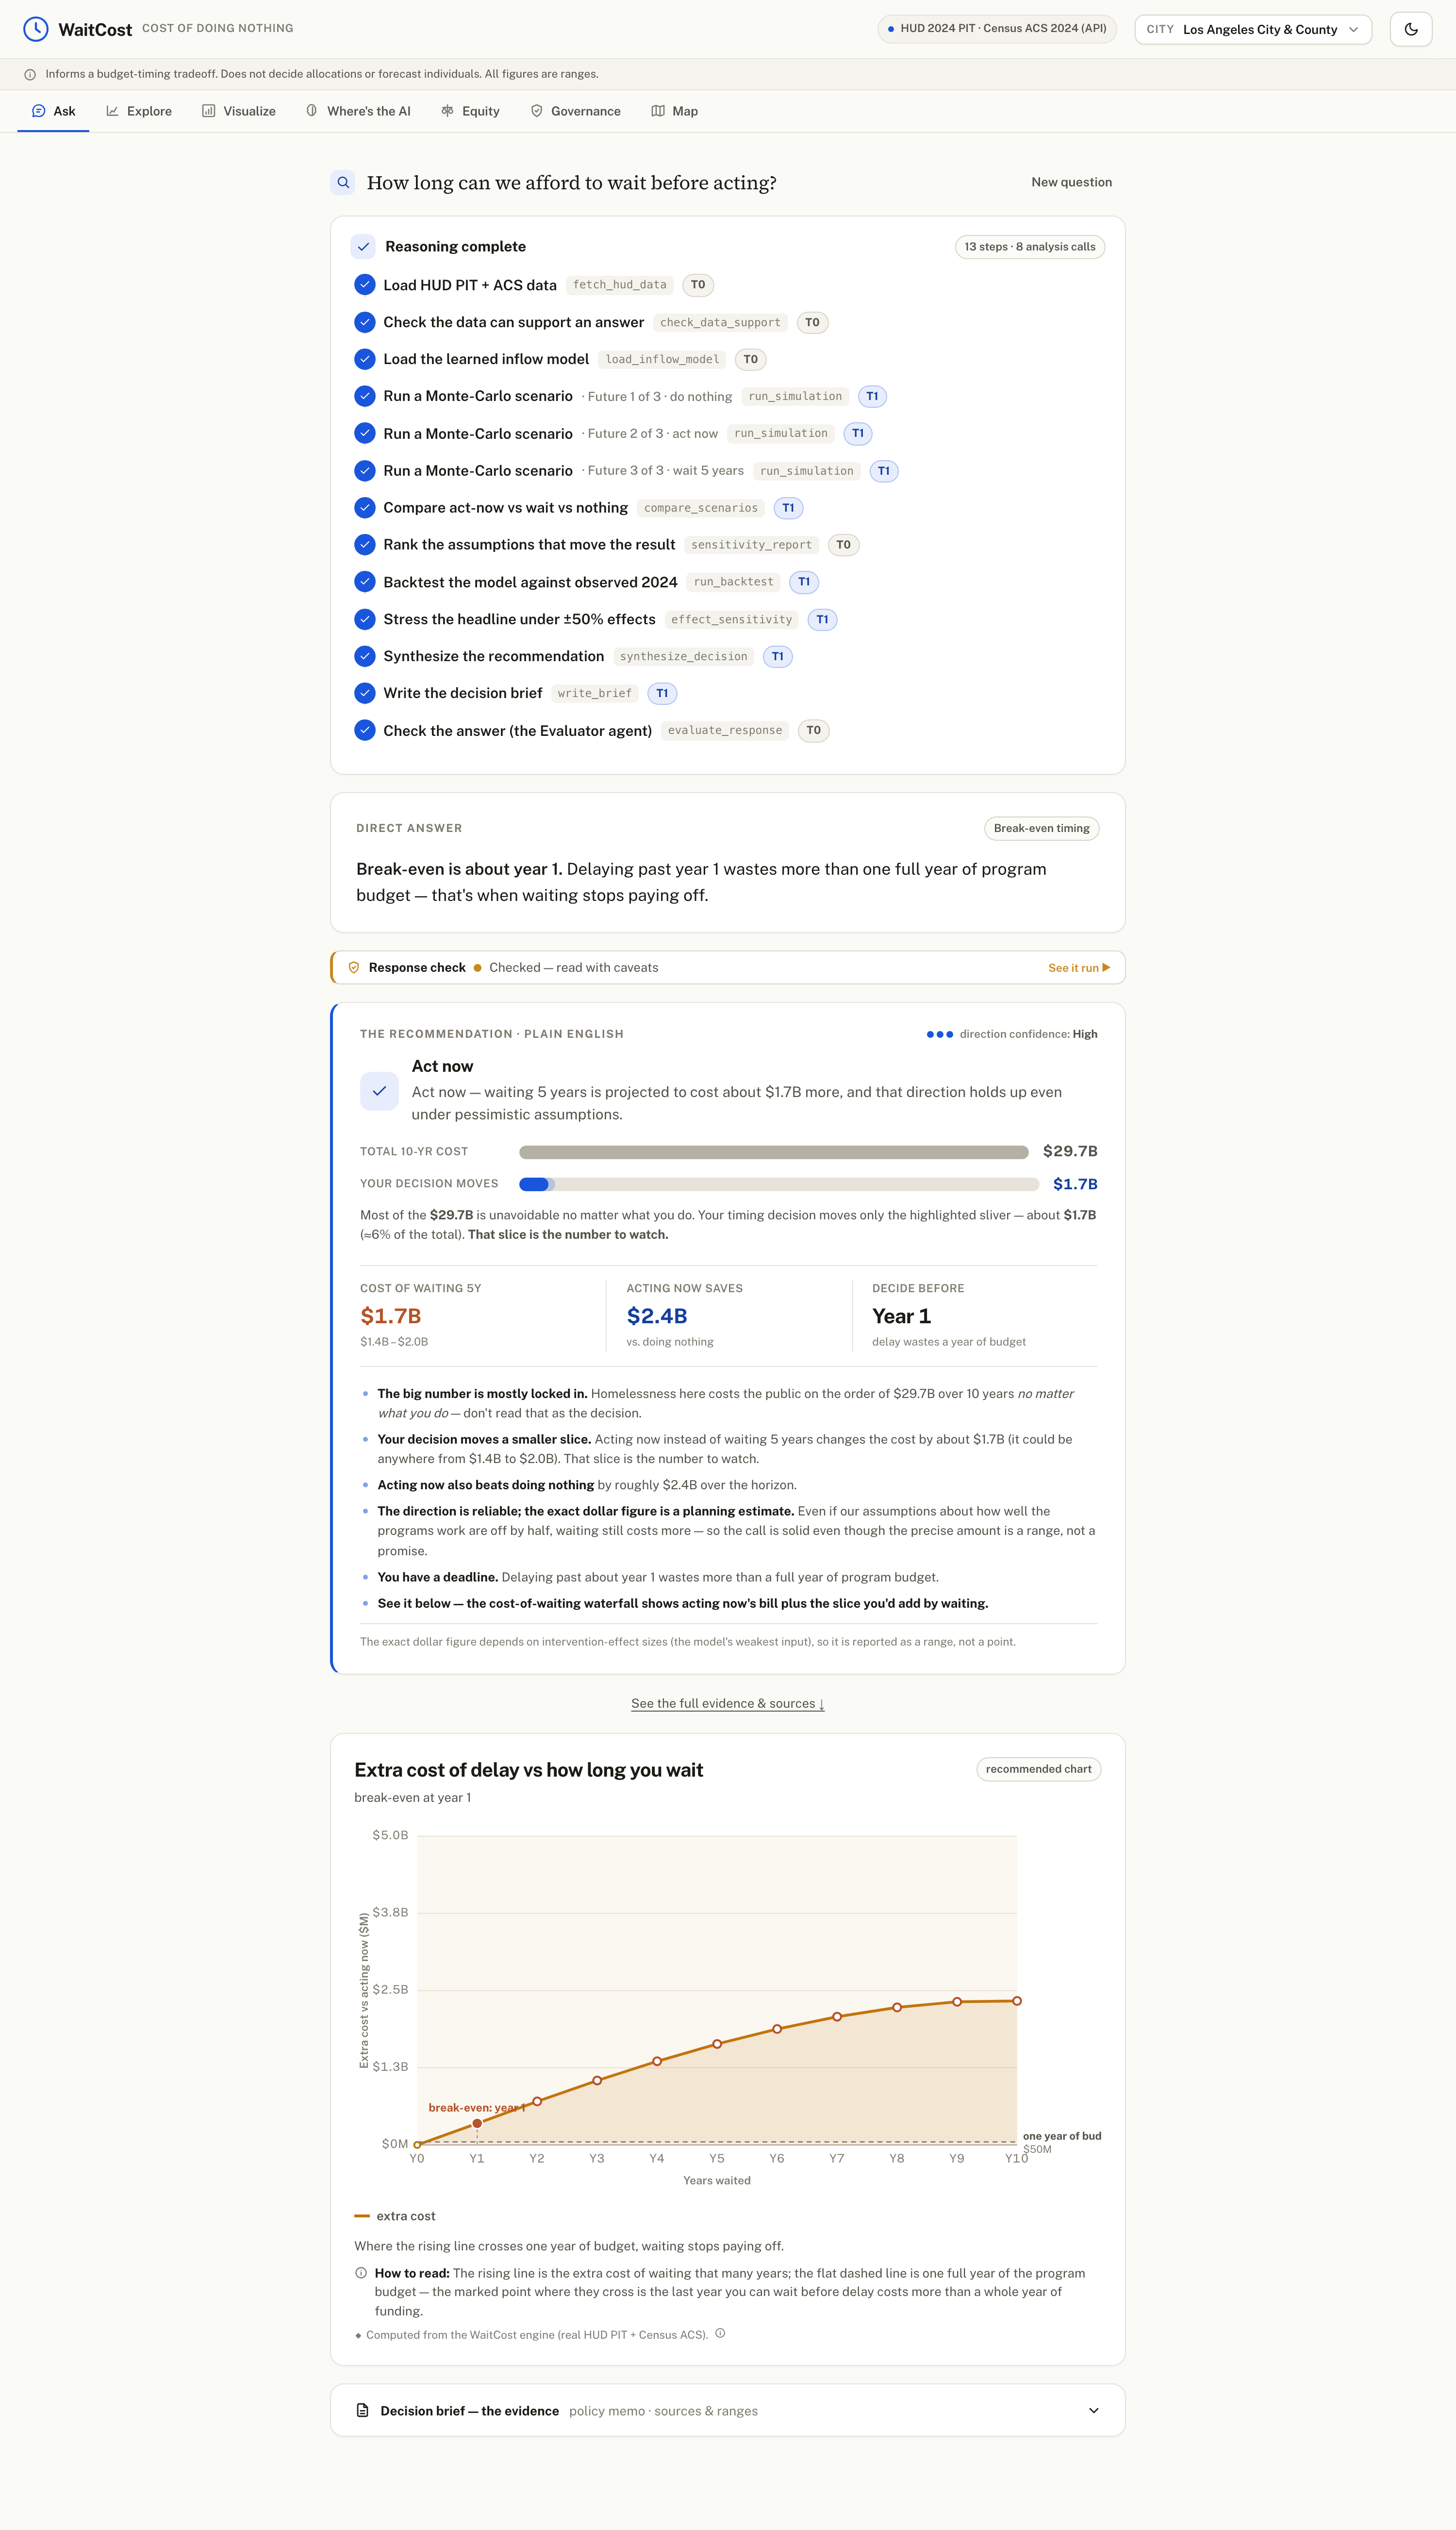
ask-how-long-to-wait
-
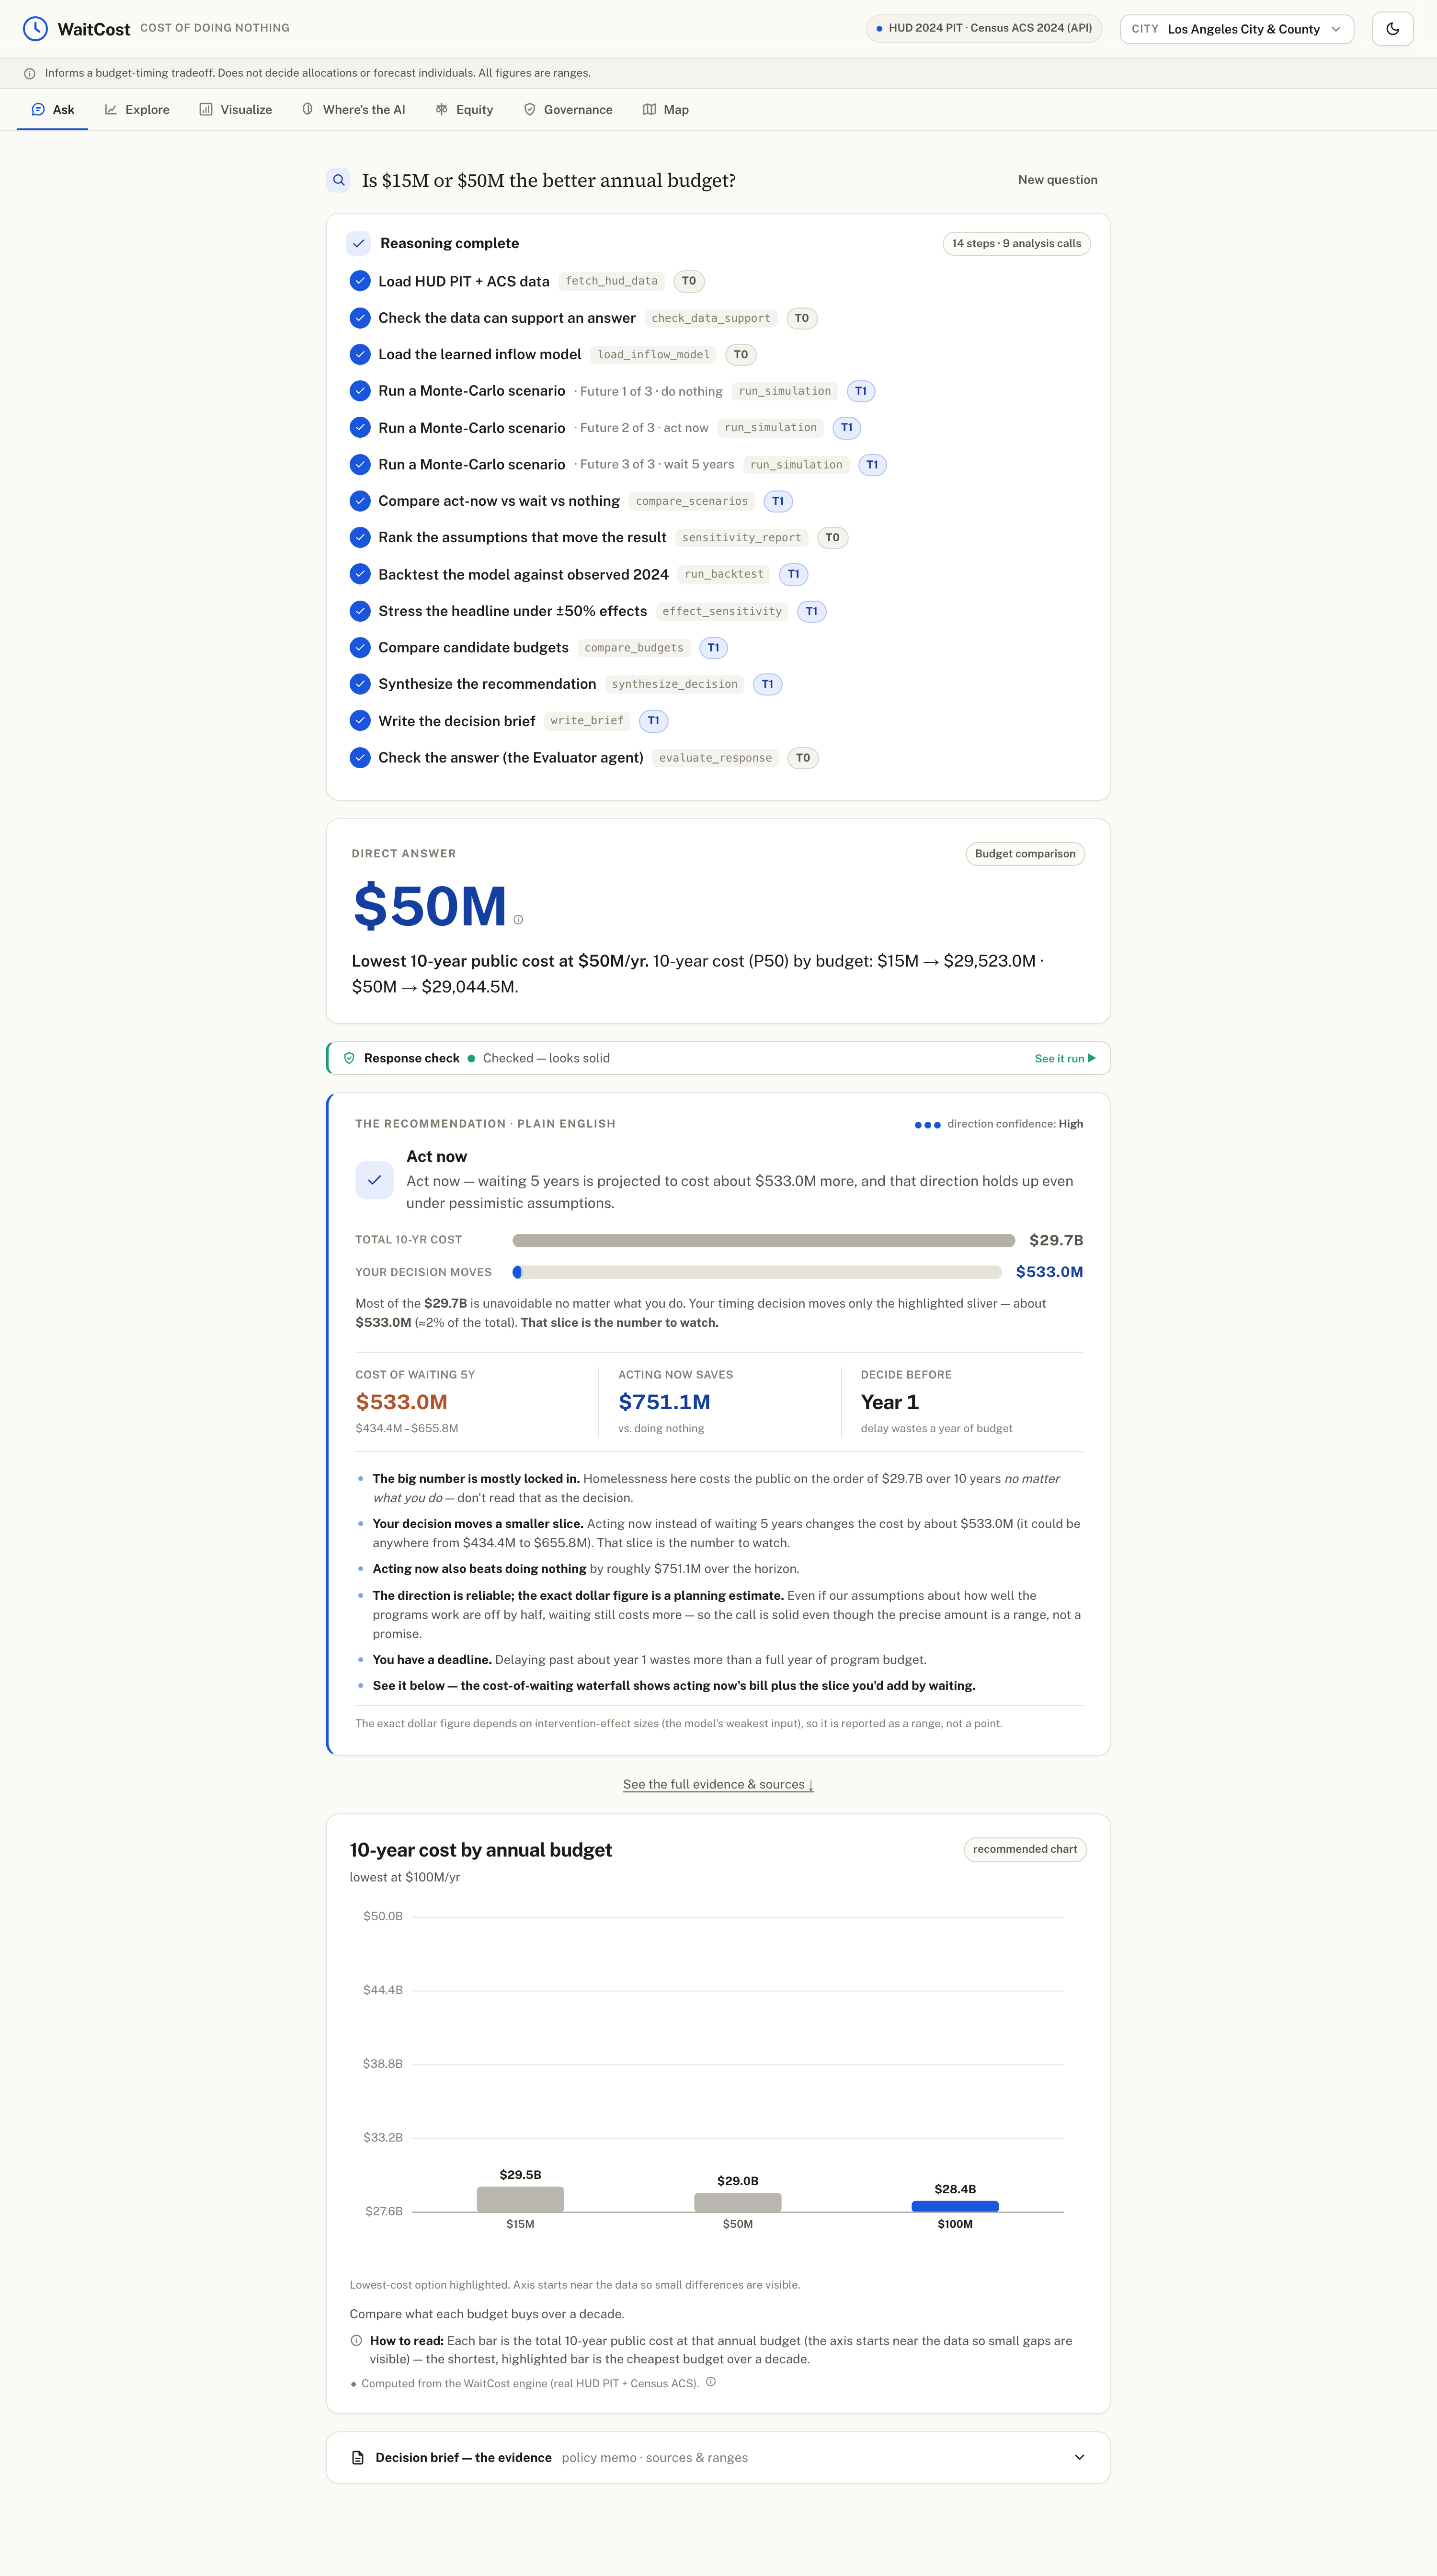
ask-budget-comparison
-
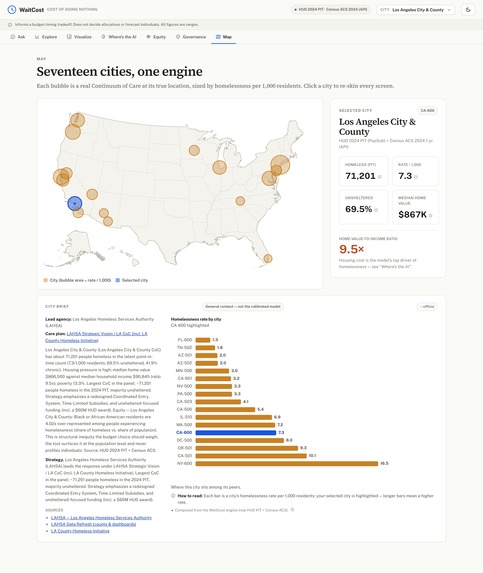
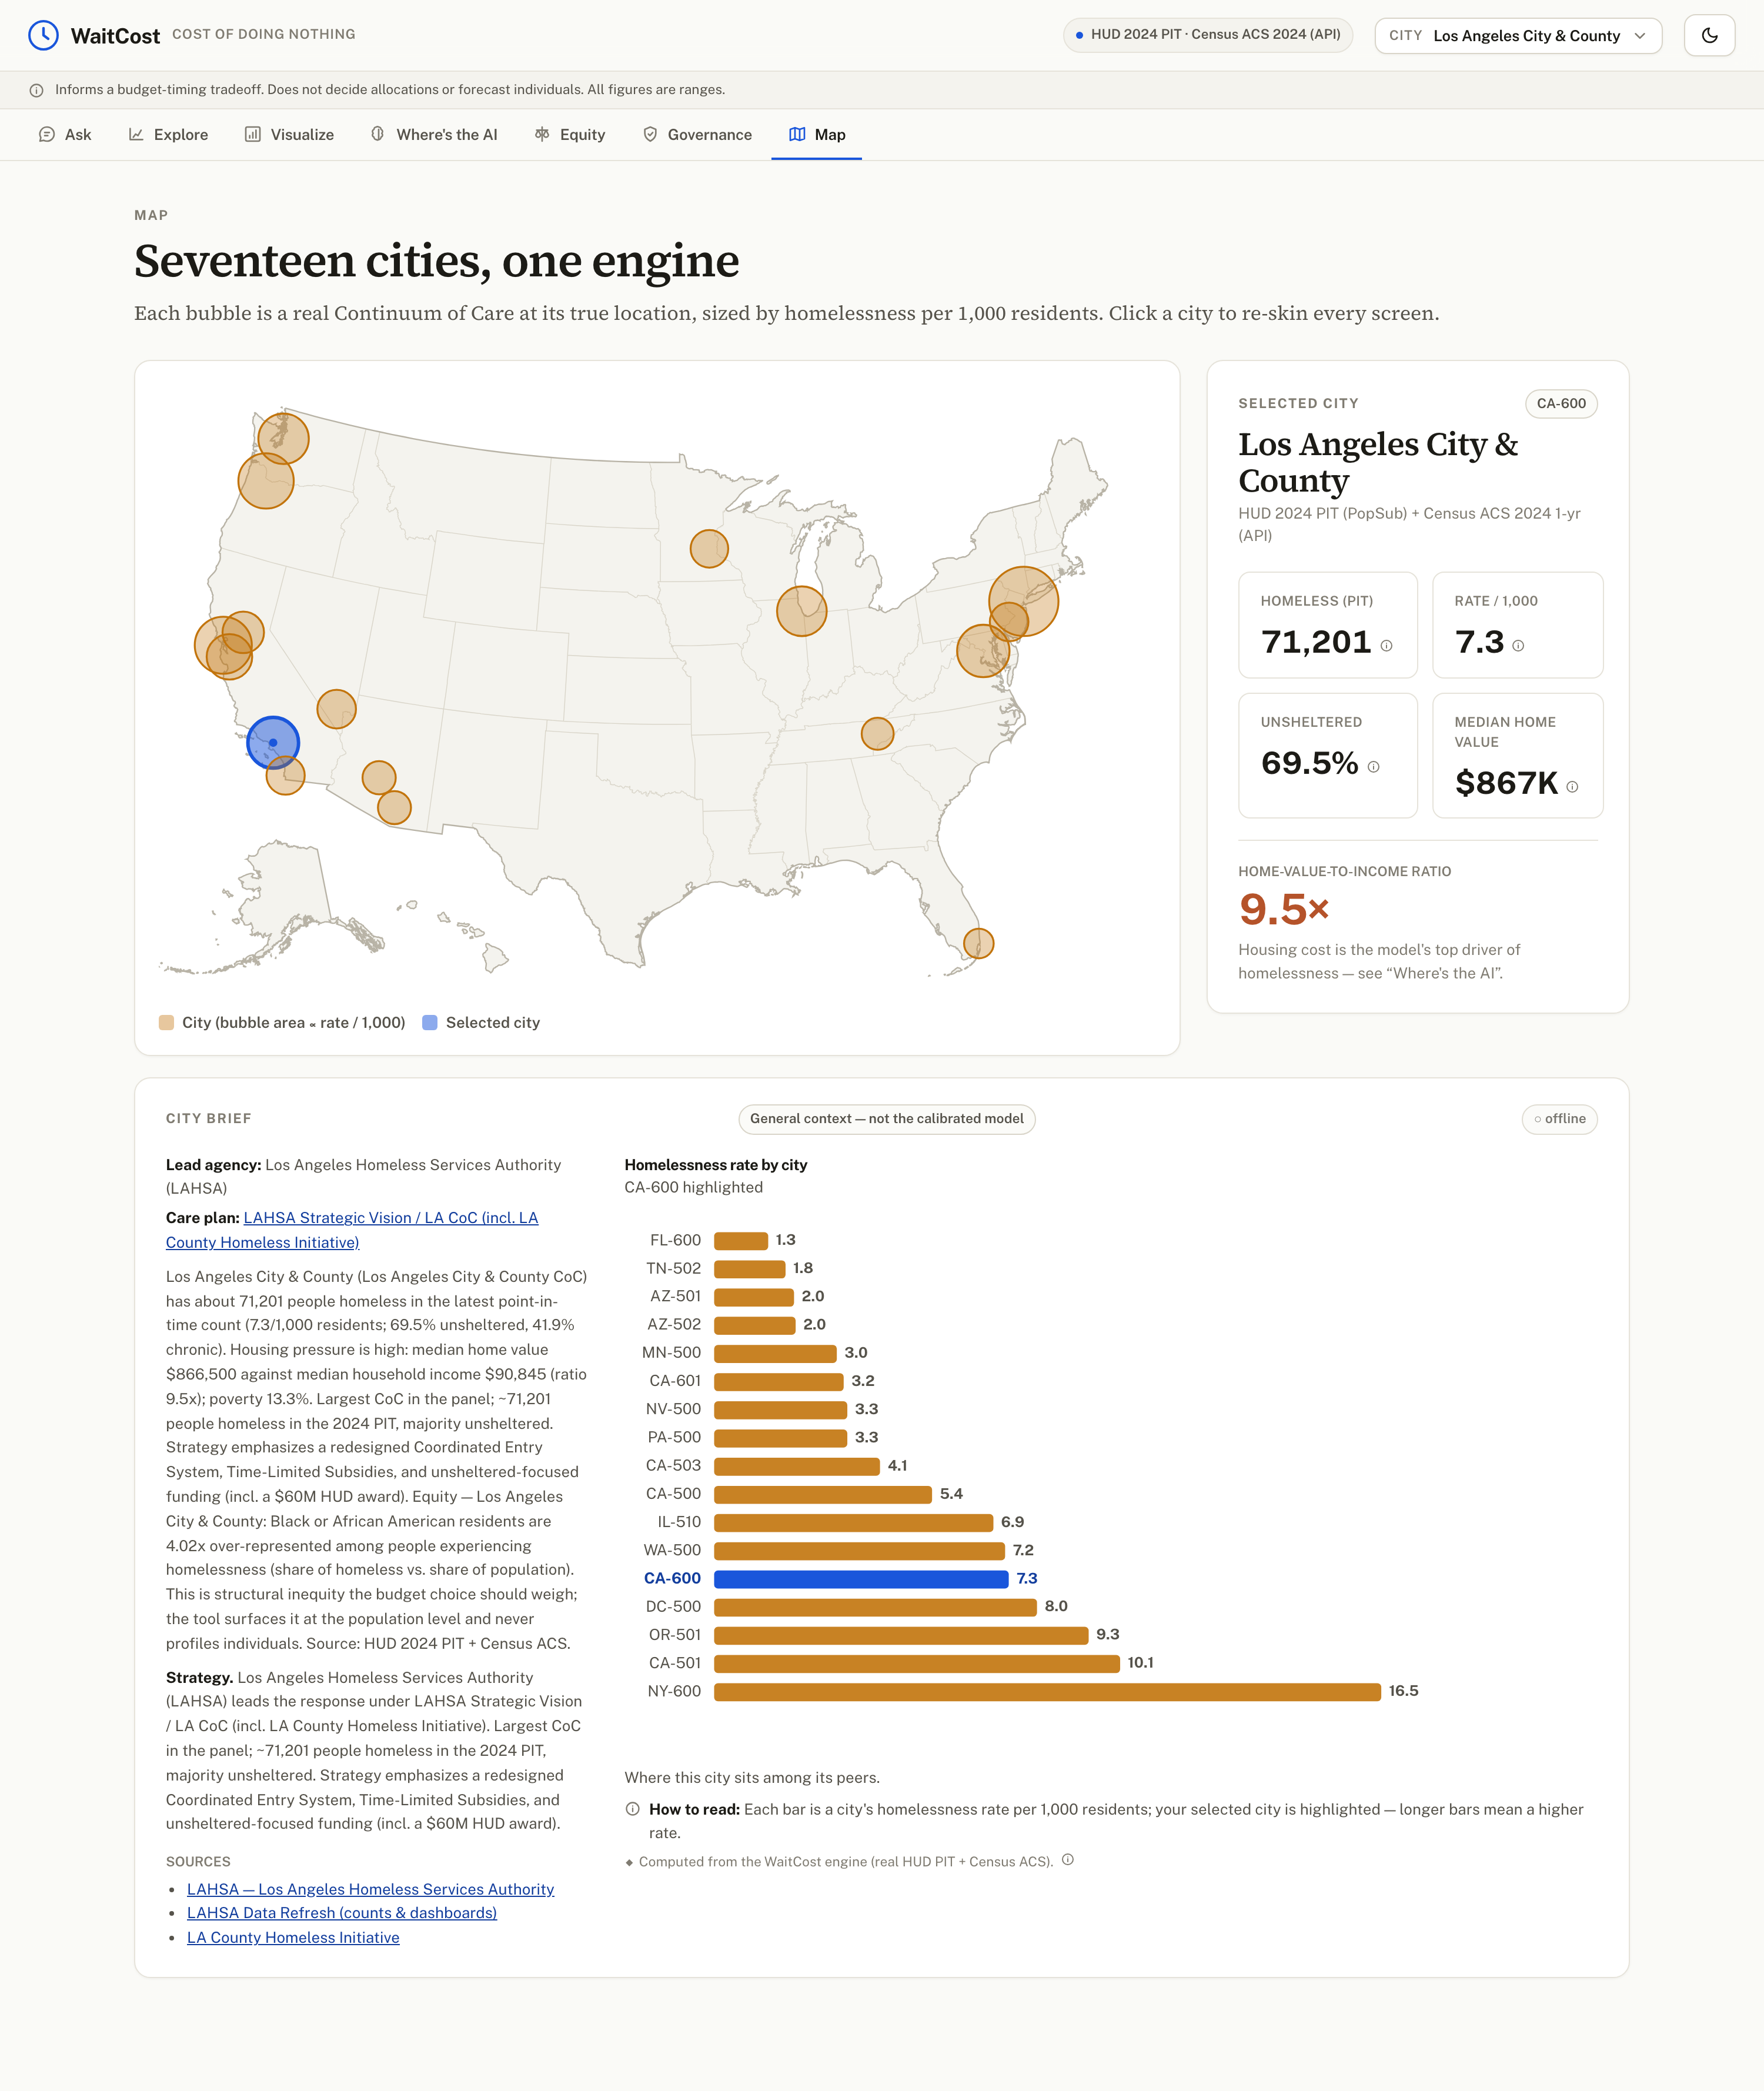
seventeen cities, one engine
-
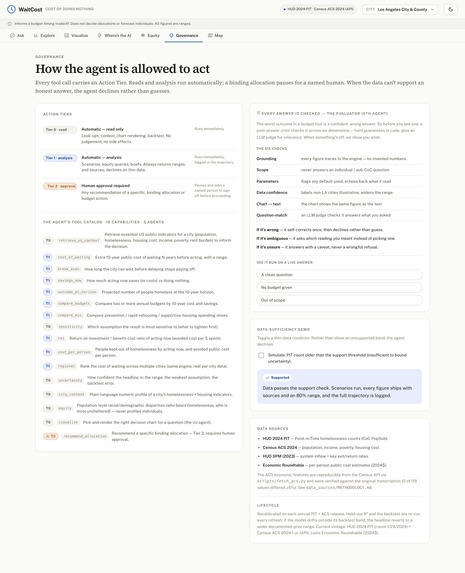
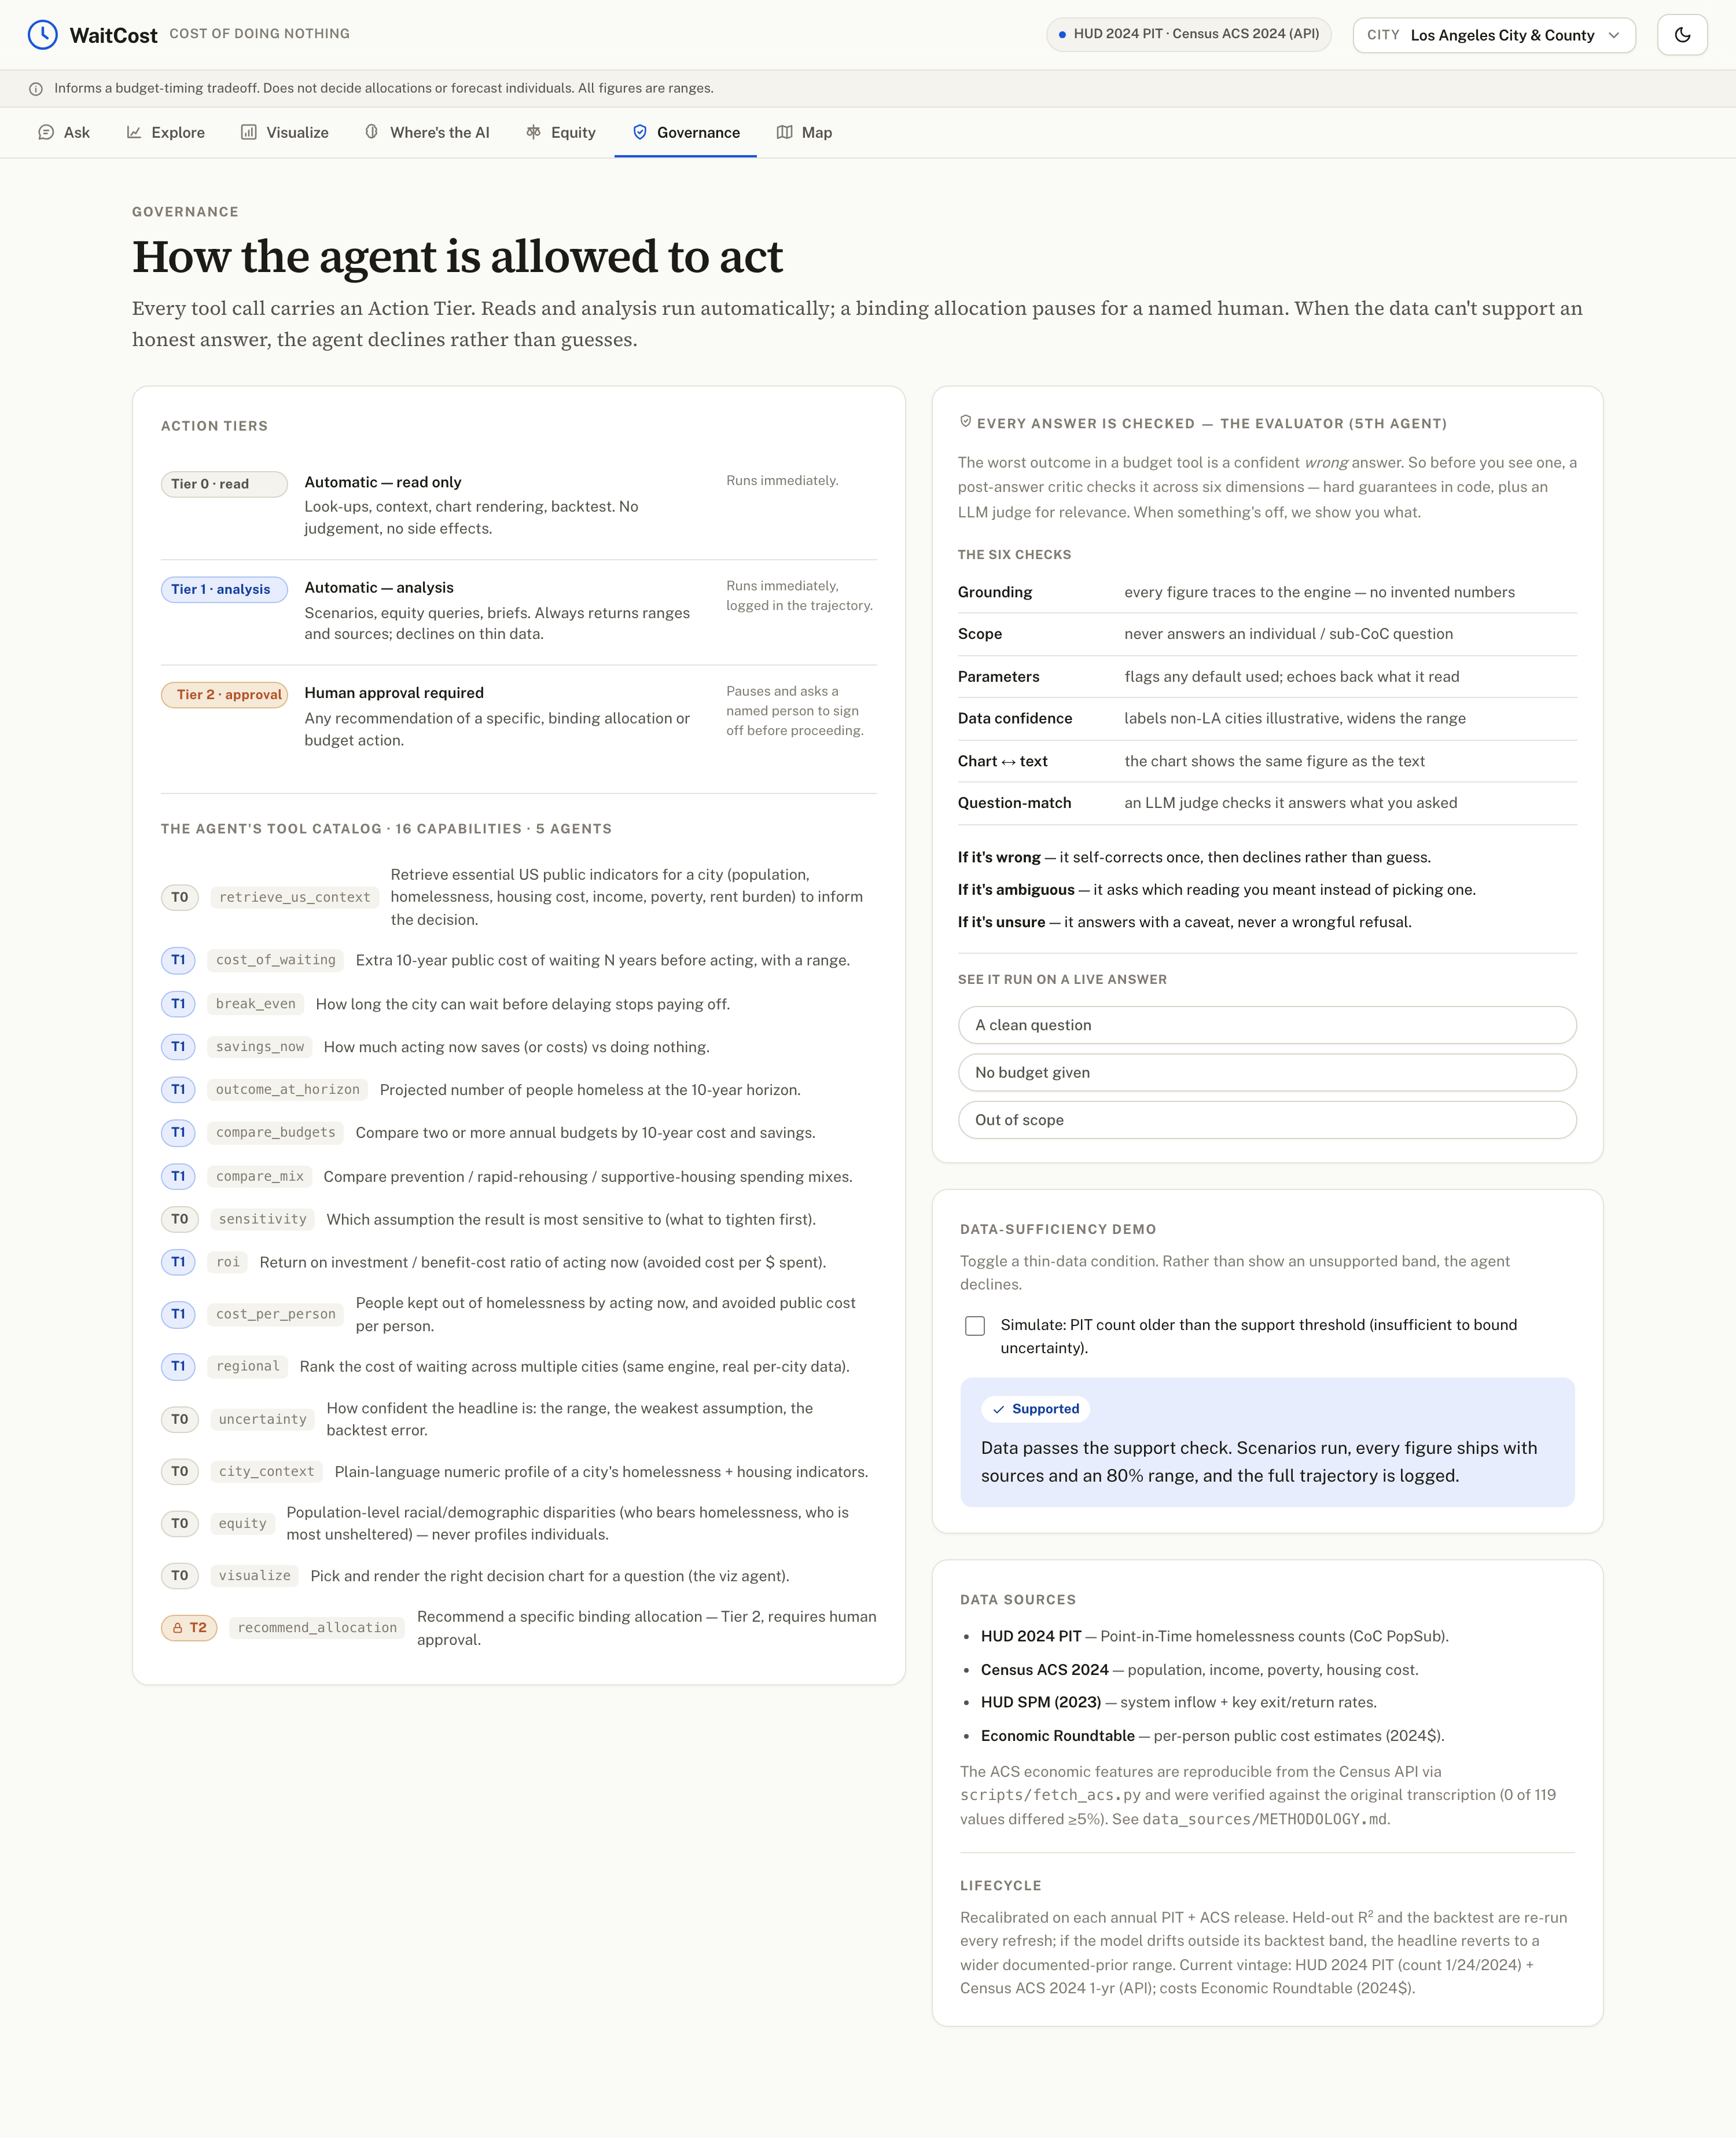
How agent is allow to act
-
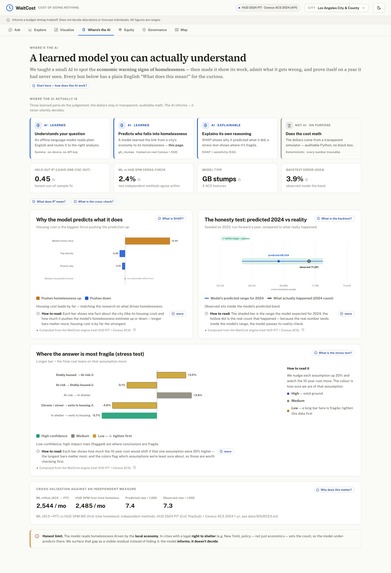
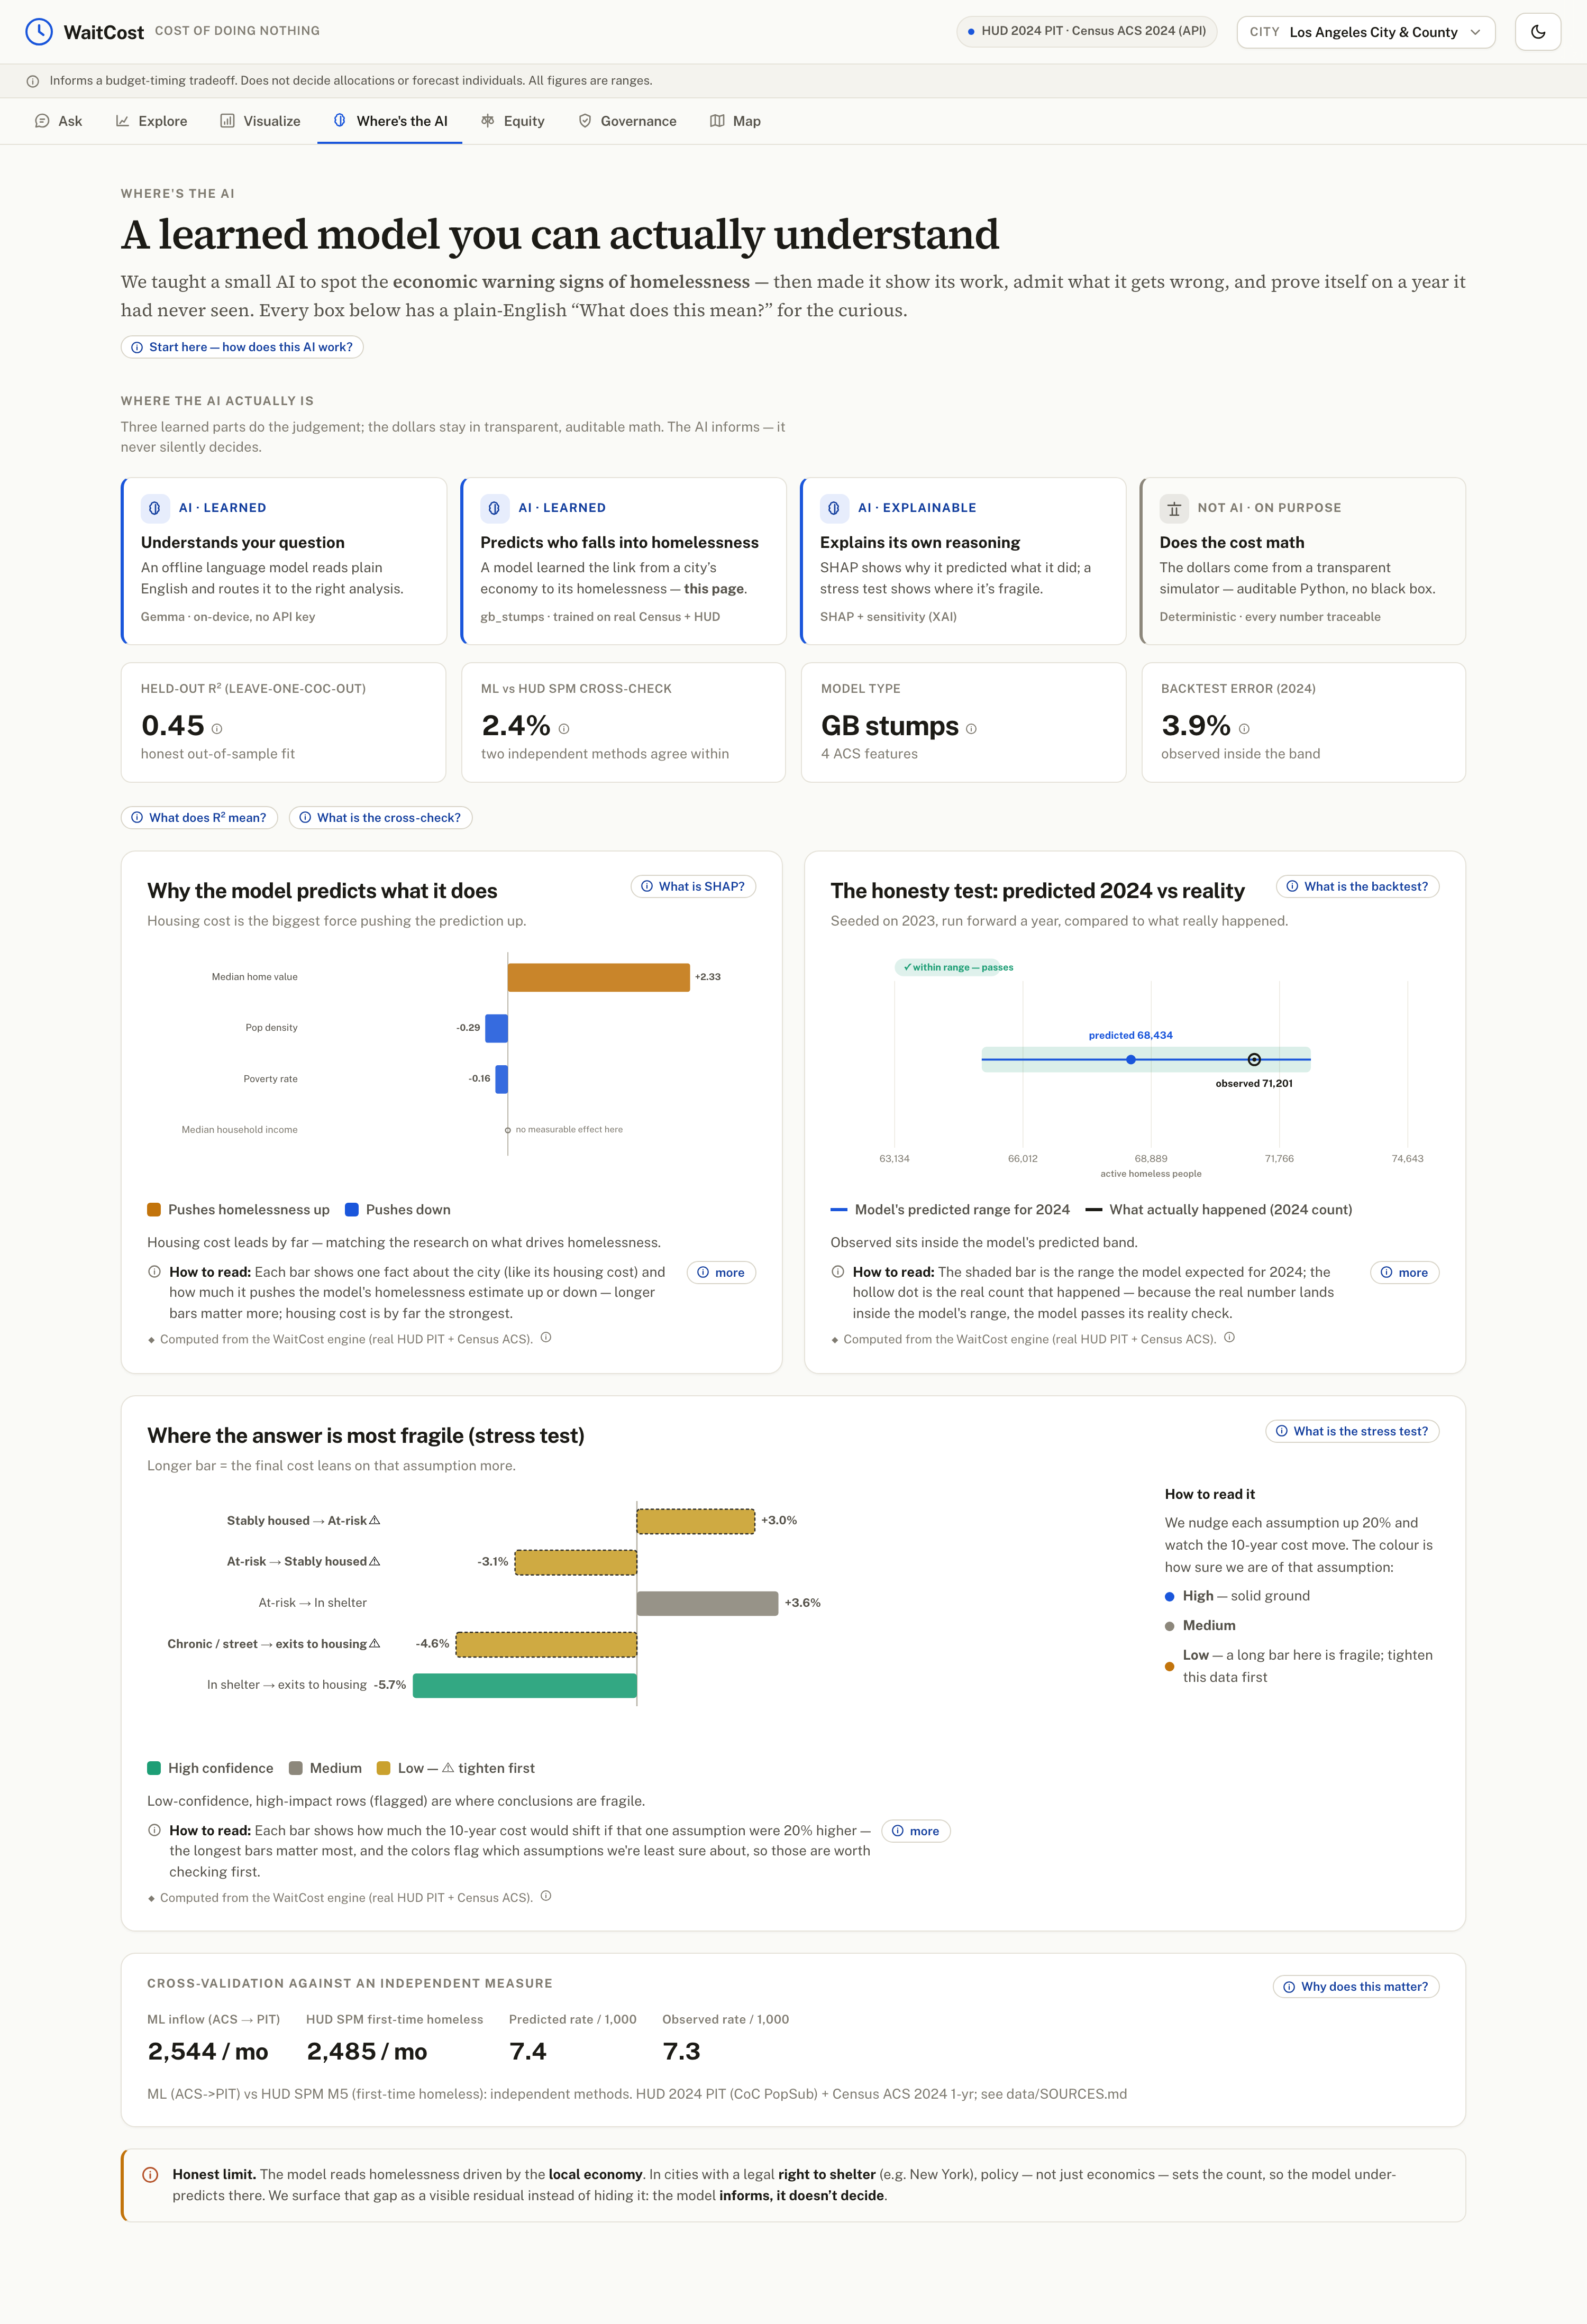
Where the AI, a learned model you can actually understand
Inspiration
A city budget office has to decide when to fund homelessness programs, not just whether. Waiting feels cheaper this year, but the problem compounds — more people, stuck longer, each costing the public more. Our user is a Los Angeles city budget office — the Continuum-of-Care (CoC) lead / budget analyst — deciding when to fund. No tool put a credible dollar figure on delay, so the safe-looking choice (wait) was being made blind. We built the missing number.
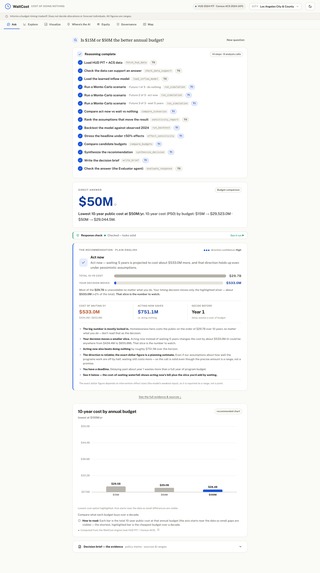
What it does
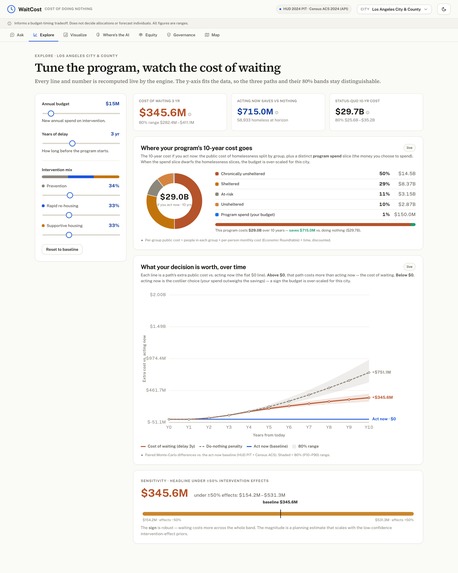
Ask a plain-English question — "What if we wait 3 years on a $15M program?" — and WaitCost answers in dollars, with an honest range and a one-page decision brief. For Los Angeles (CA-600), waiting 3 years costs about $345.6M more over 10 years (80% range $282.4M–$411.1M), and acting now instead of doing nothing saves about $751.1M. It reframes the decision too: that timing slice is only ~1% of the unavoidable ~$29.7B 10-year bill, so a director sees exactly which number their choice actually moves. It handles 16 question types (cost of waiting, break-even, ROI, budget and mix comparisons, equity, multi-city ranking, and more), recommends a direction (act now vs wait) with a confidence on that direction, and shows a "Response Check" so you know how much to trust each answer. It never decides the budget — it informs the timing trade-off and hands the allocation to a human.
How we built it
WaitCost is a multi-agent system with a clean input → AI → output flow, built so the AI reasons but a deterministic engine owns every number.
- The brain — Claude Sonnet 4.6: understands the question, plans, and routes it (confidence-gated), then runs as a real tool-using agent with adaptive thinking. With no API key it falls back to an offline model, then a deterministic rule planner — so the demo never breaks.
- The engine (Python sandbox): Claude calls real tools in a loop — a system-dynamics simulator (Monte Carlo over 10 years), a learned inflow model, US-data retrieval, and comparison metrics. The engine computes every figure; a number-guard rejects anything the model tries to invent.
- The prediction model: Census ACS → HUD homeless rate. We compared a Ridge baseline against gradient-boosted stumps with leave-one-CoC-out cross-validation and report the honest held-out score (R² ≈ 0.45). SHAP shows housing cost is the dominant driver, and the predicted inflow agrees with an independent HUD measure (first-time homeless) within ~2.4%.
- Five agents: Analyst, Visualization, City Brief, Decision, and an Evaluator that checks every answer before you see it.
- The web app — React + TypeScript (Vite): an interactive interface with a D3/TopoJSON US map. It only ever calls the engine and draws results — no number is computed in the browser — so the web app, the API, and the agent can never disagree. Deployed on Vercel, with the FastAPI engine on Hugging Face.
- Human in the loop: Action Tiers bound autonomy — reading data and running simulations are automatic, but recommending an actual allocation is Tier 2 and stops for human approval (enforced as a
TierViolationin code, with a test). - Responsible AI: the Evaluator checks grounding, scope, parameters, data confidence, chart–text consistency, and question-match, and shows what went wrong instead of a confident wrong answer. A safety rail forces individual / sub-neighborhood questions out of scope, equity is population-level only, and every dollar is a range.
- Data — all public and verified: HUD 2024 Point-in-Time counts, U.S. Census ACS 2024 (pulled live from the API, 0 of 119 values off by ≥5%), HUD System Performance Measures FY2023 (flow rates), and the Economic Roundtable cost study — calibrated for Los Angeles, scoring 17 cities.
- Stack: React · TypeScript · Vite · D3 + TopoJSON (interactive US map) · Python · FastAPI · Claude Sonnet 4.6 (Anthropic API) · scikit-learn · SHAP · Plotly · Streamlit · Ollama/Gemma (offline fallback) · deployed on Vercel (web app) + Hugging Face (API).
Challenges we ran into
The hardest part by far was the data. We started out hoping there would be one clean dataset with everything we needed, ready to run through standard data-science techniques — but it doesn't exist. The real information is scattered across government reports, APIs, and city websites, in different formats and geographies. So we split the work across the team, managed our time tightly, and went source by source:
- Finding it: we combined online research with AI tools to suggest where the data actually lived, then pulled it from several different places.
- API access: the Census ACS API needs an account, and some sign-ups expect a company or business email — so we used our school email to get a key and pull the economic data programmatically.
- Reading the reports: HUD's homeless counts and flow rates have no clean API, so we read the official PDF reports to extract the right figures and trace the related sources that matter for understanding homelessness.
- City context: to describe each city's situation we searched each one individually and recorded cited sources.
- Merging it: HUD reports by region and the Census by county, so we built a matching / crosswalk system to combine everything into one consistent panel we could actually run, then re-fetched from the API to verify it.
Two more hard parts:
- Bridging the pieces together. We built the engine as plain functions first, then layered a notebook, then Streamlit, then the React web app — keeping every number coming from the same core so the layers could never disagree. Getting all of these ideas to work as one system was the toughest challenge of all.
- From offline AI to deployment. We first built around an offline model, which was great for development but hard to deploy — it needs a real machine and resources to run. So we moved the brain to Claude Sonnet 4.6, which improved the reasoning and let the agent coordinate the whole operation — while keeping the offline model as a fallback.
- Keeping a frontier LLM on a short leash. Every number still has to trace to the engine, which meant a number-guard, a deterministic safety rail, an evaluator on top, and reporting honest ranges (including surfacing the model's under-prediction for right-to-shelter cities like New York instead of hiding it). ## Accomplishments that we're proud of What we're proudest of is working out where the line belongs between the AI and the code, and building a clean multi-agent architecture around it:
- A sandbox of trusted functions, with the LLM as the router. We learned that an LLM shouldn't do the data analysis itself — so we pre-built the essential analytical functions, and the AI's job is to understand the question and route it to the right specialized agent. Ask a technical question and a function-running agent retrieves the right function, runs it on our real data, and returns the result. The code does the math; the model never invents a number.
- An English-explainer agent that compares the raw function output to the question you actually asked, works out what it means, and explains it in plain language you can act on — because the functions run in the background and return numbers that aren't easy to interpret on their own.
- A visualization agent the LLM guides to pick the chart that fits the question and the function's output, so the picture always matches the answer.
- An Evaluator agent that checks whether the question is in scope and whether the sandbox's outputs look accurate or off — an automatic self-check on every answer.
- A city-brief agent for qualitative, cited context on each city. The insight behind all of it: chatting is easy, but it has limits — for anything technical you have to guide the LLM and keep it inside the sandbox. We're proud that the same design works whether the brain is an offline model or a cloud LLM, and that on the cloud it also conserves tokens and resources while keeping answers accurate — because the model reasons and routes, but the engine does the heavy lifting. And we shipped it as a real, deployed product: calibrated and backtested for Los Angeles (within ~4% of the observed 2024 count) in a React web app, with a reframe that separates the unavoidable ~$29.7B 10-year bill from the ~$345.6M slice the decision actually moves. And we can apply it to other cities we have.
What we learned
Trust comes from constraint. The more capable the model, the more the guardrails matter — the winning design was "smart brain, strict cage." We also learned that the most valuable thing a budget tool can do isn't just produce a number; it's show how much to trust it.
What's next for WaitCost — The Cost of Doing Nothing
- Calibrate more cities. Fit flow rates from HUD SPM for more of the 17 cities, moving them from "illustrative" to fully calibrated.
- Tighten the weakest input. Add causal effect-size estimates (difference-in-differences across CoCs).
- Pilot with a real city, on real data. Getting access to good data was our biggest hurdle, so the next step is partnering with a Continuum of Care or a city budget office to run WaitCost on their own, richer data.
- Privacy-first, offline deployment for government. Because the same design runs fully offline, a government can keep sensitive data on its own machines instead of sending it to a cloud service every time — a privacy-preserving option that matters for public-sector information. Our agent-plus-sandbox approach is exactly what makes the system portable between offline and cloud brains.
- Go beyond budget timing. Homelessness is tightly tied to economics, so we want to model the drivers around it — employment and occupation services, financial aid, and other supports — and partner with city mayors to answer not just when to fund, but which combination of interventions most reduces homelessness and helps people back into work and stable housing.
Built With
- anthropic
- claude
- claude-sonnet-4.6
- d3.js
- docker
- fastapi
- gemma
- hugging-face
- numpy
- ollama
- pandas
- plotly
- python
- react
- scikit-learn
- shap
- streamlit
- topojson
- typescript
- u.s.-census-acs-api
- vercel
- vite


Log in or sign up for Devpost to join the conversation.