-
-
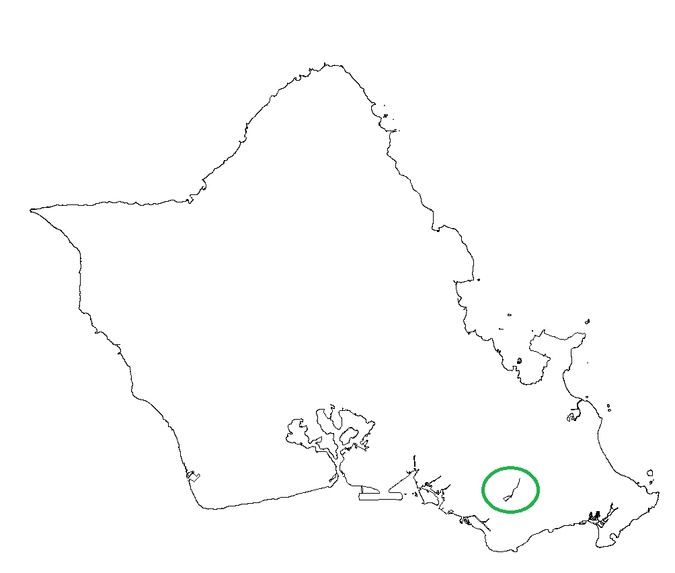
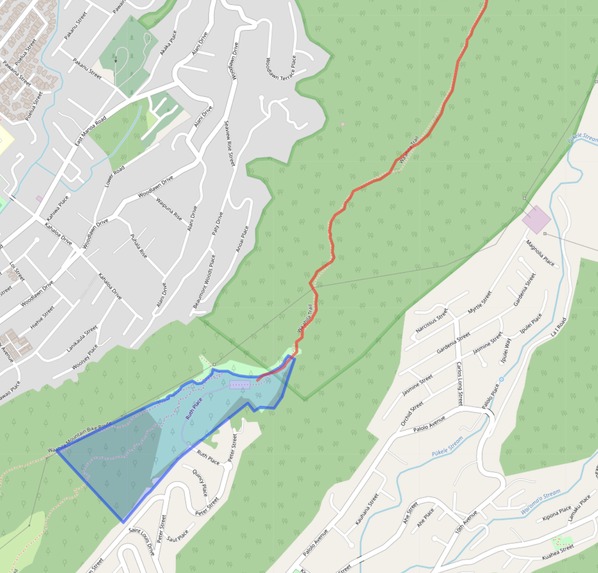
Oahu and Waahila trail bare
-
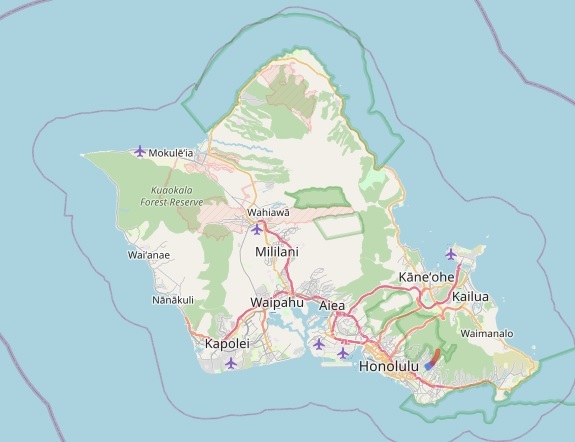
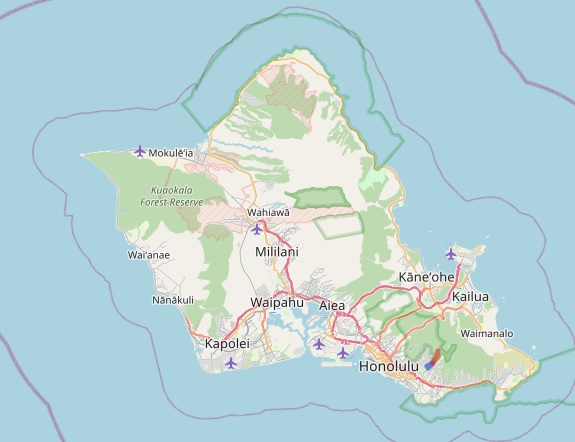
oahu small
-
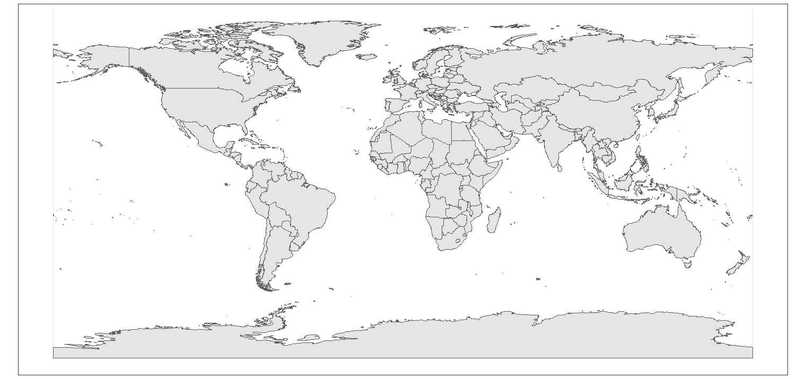
world
-
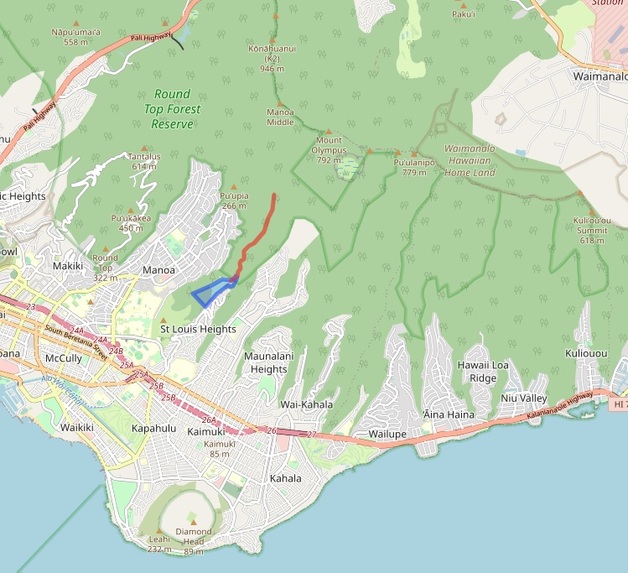
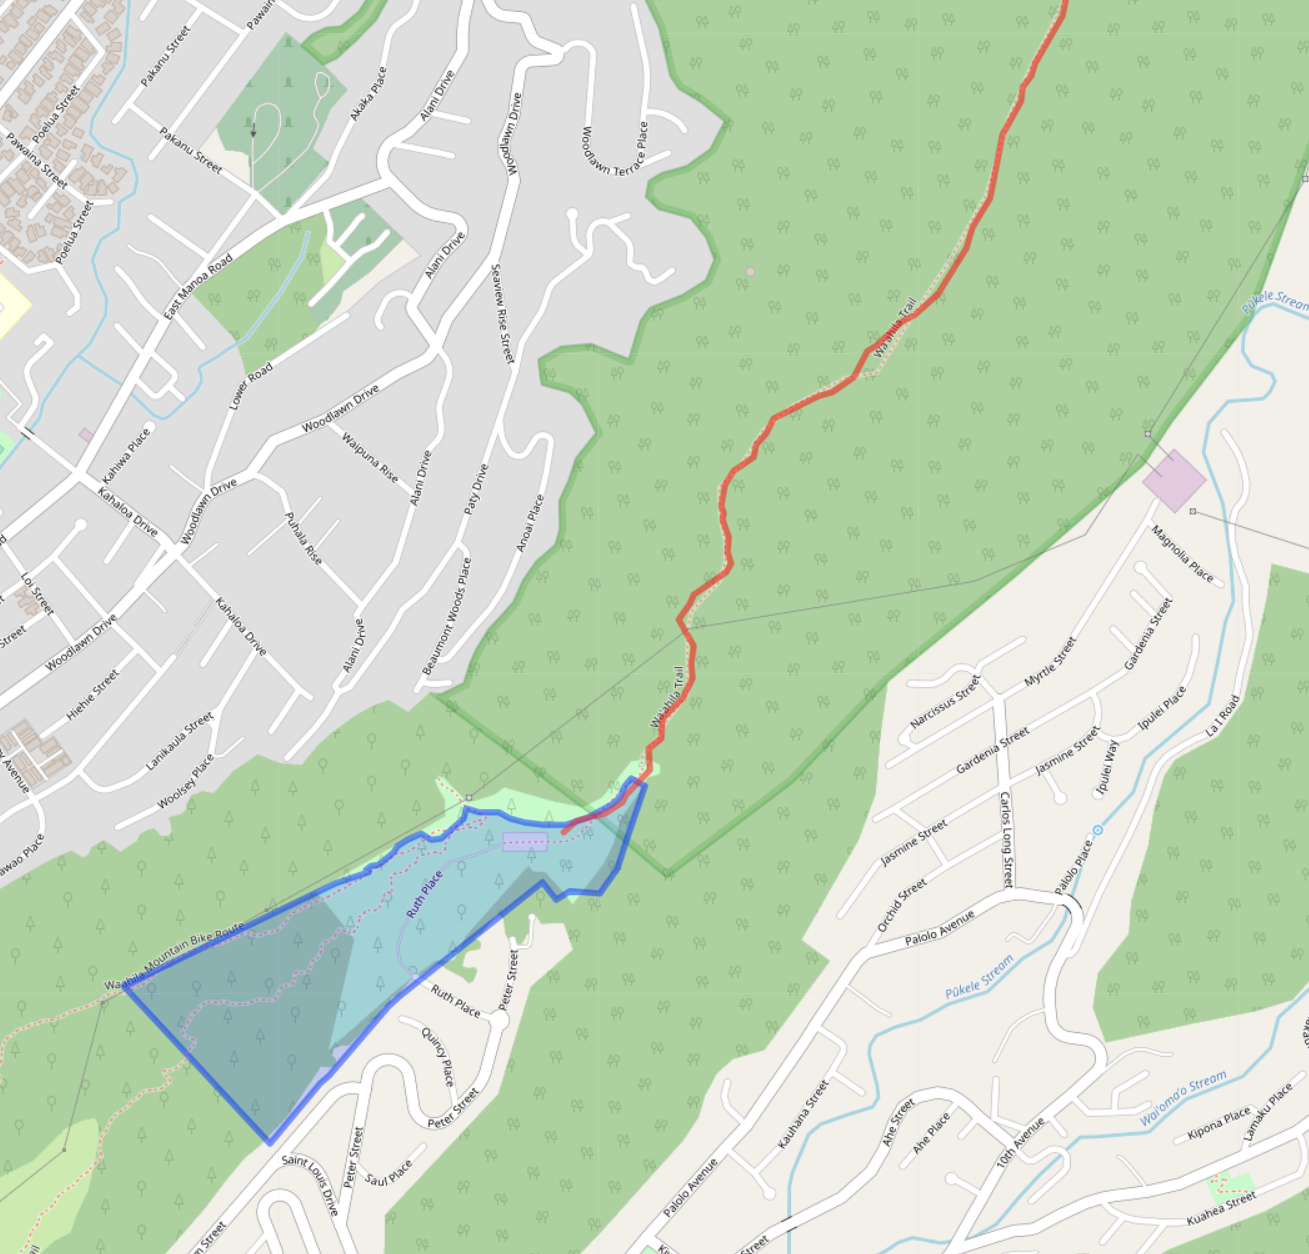
waahila trail and parl,jpeg
-
waahila trail and parl,jpeg


Inspiration
Use cell phone data to manage, monitor, and analyze visitor activity in the parks. We are going to use R to plot cell-phone ping data as provided by the dlnr to show visitor traffic within park boundaries.
What it does
Our app shows traffic along Hawaii hiking trails using location data from mobile phones.
How we built it
We looked for open source utilities that could plot geodata, and found that R was well suited for our needs. We used the state of Hawaii's ARCGIS data, that is publicly available to render maps of hawaii, trails, and park boundaries. Lastly, we plotted the cell phone ping data that was provided by the DLNR.
Challenges we ran into
Some major challenges we ran into were time, handling geodata, and shape files. Another challenge that we faced was plotting kml data.
Accomplishments that we're proud of
Learning to code in R and creating professional looking maps was certainly something to be proud of, seeing all of that raw code turned to images and maps was an amazing accomplishment.
What we learned
We learned that Hawaii has tons of geographical data for parks, that we can transfer easily to polygon python code, and build layers of code over it to display the data and maps together.
What's next for w-h-s bulldogs 2021
If we make it to the next round, we plan to increase our capability, and add a new function that is built on the R.
Built With
- kml
- powershell
- r


Log in or sign up for Devpost to join the conversation.