Inspiration
W-Cycle was inspired by a simple observation: waste does not appear randomly. In student-heavy suburbs, the same academic calendar that drives move-ins also drives move-outs, which means reusable furniture, appliances, and electronics appear in predictable waves.
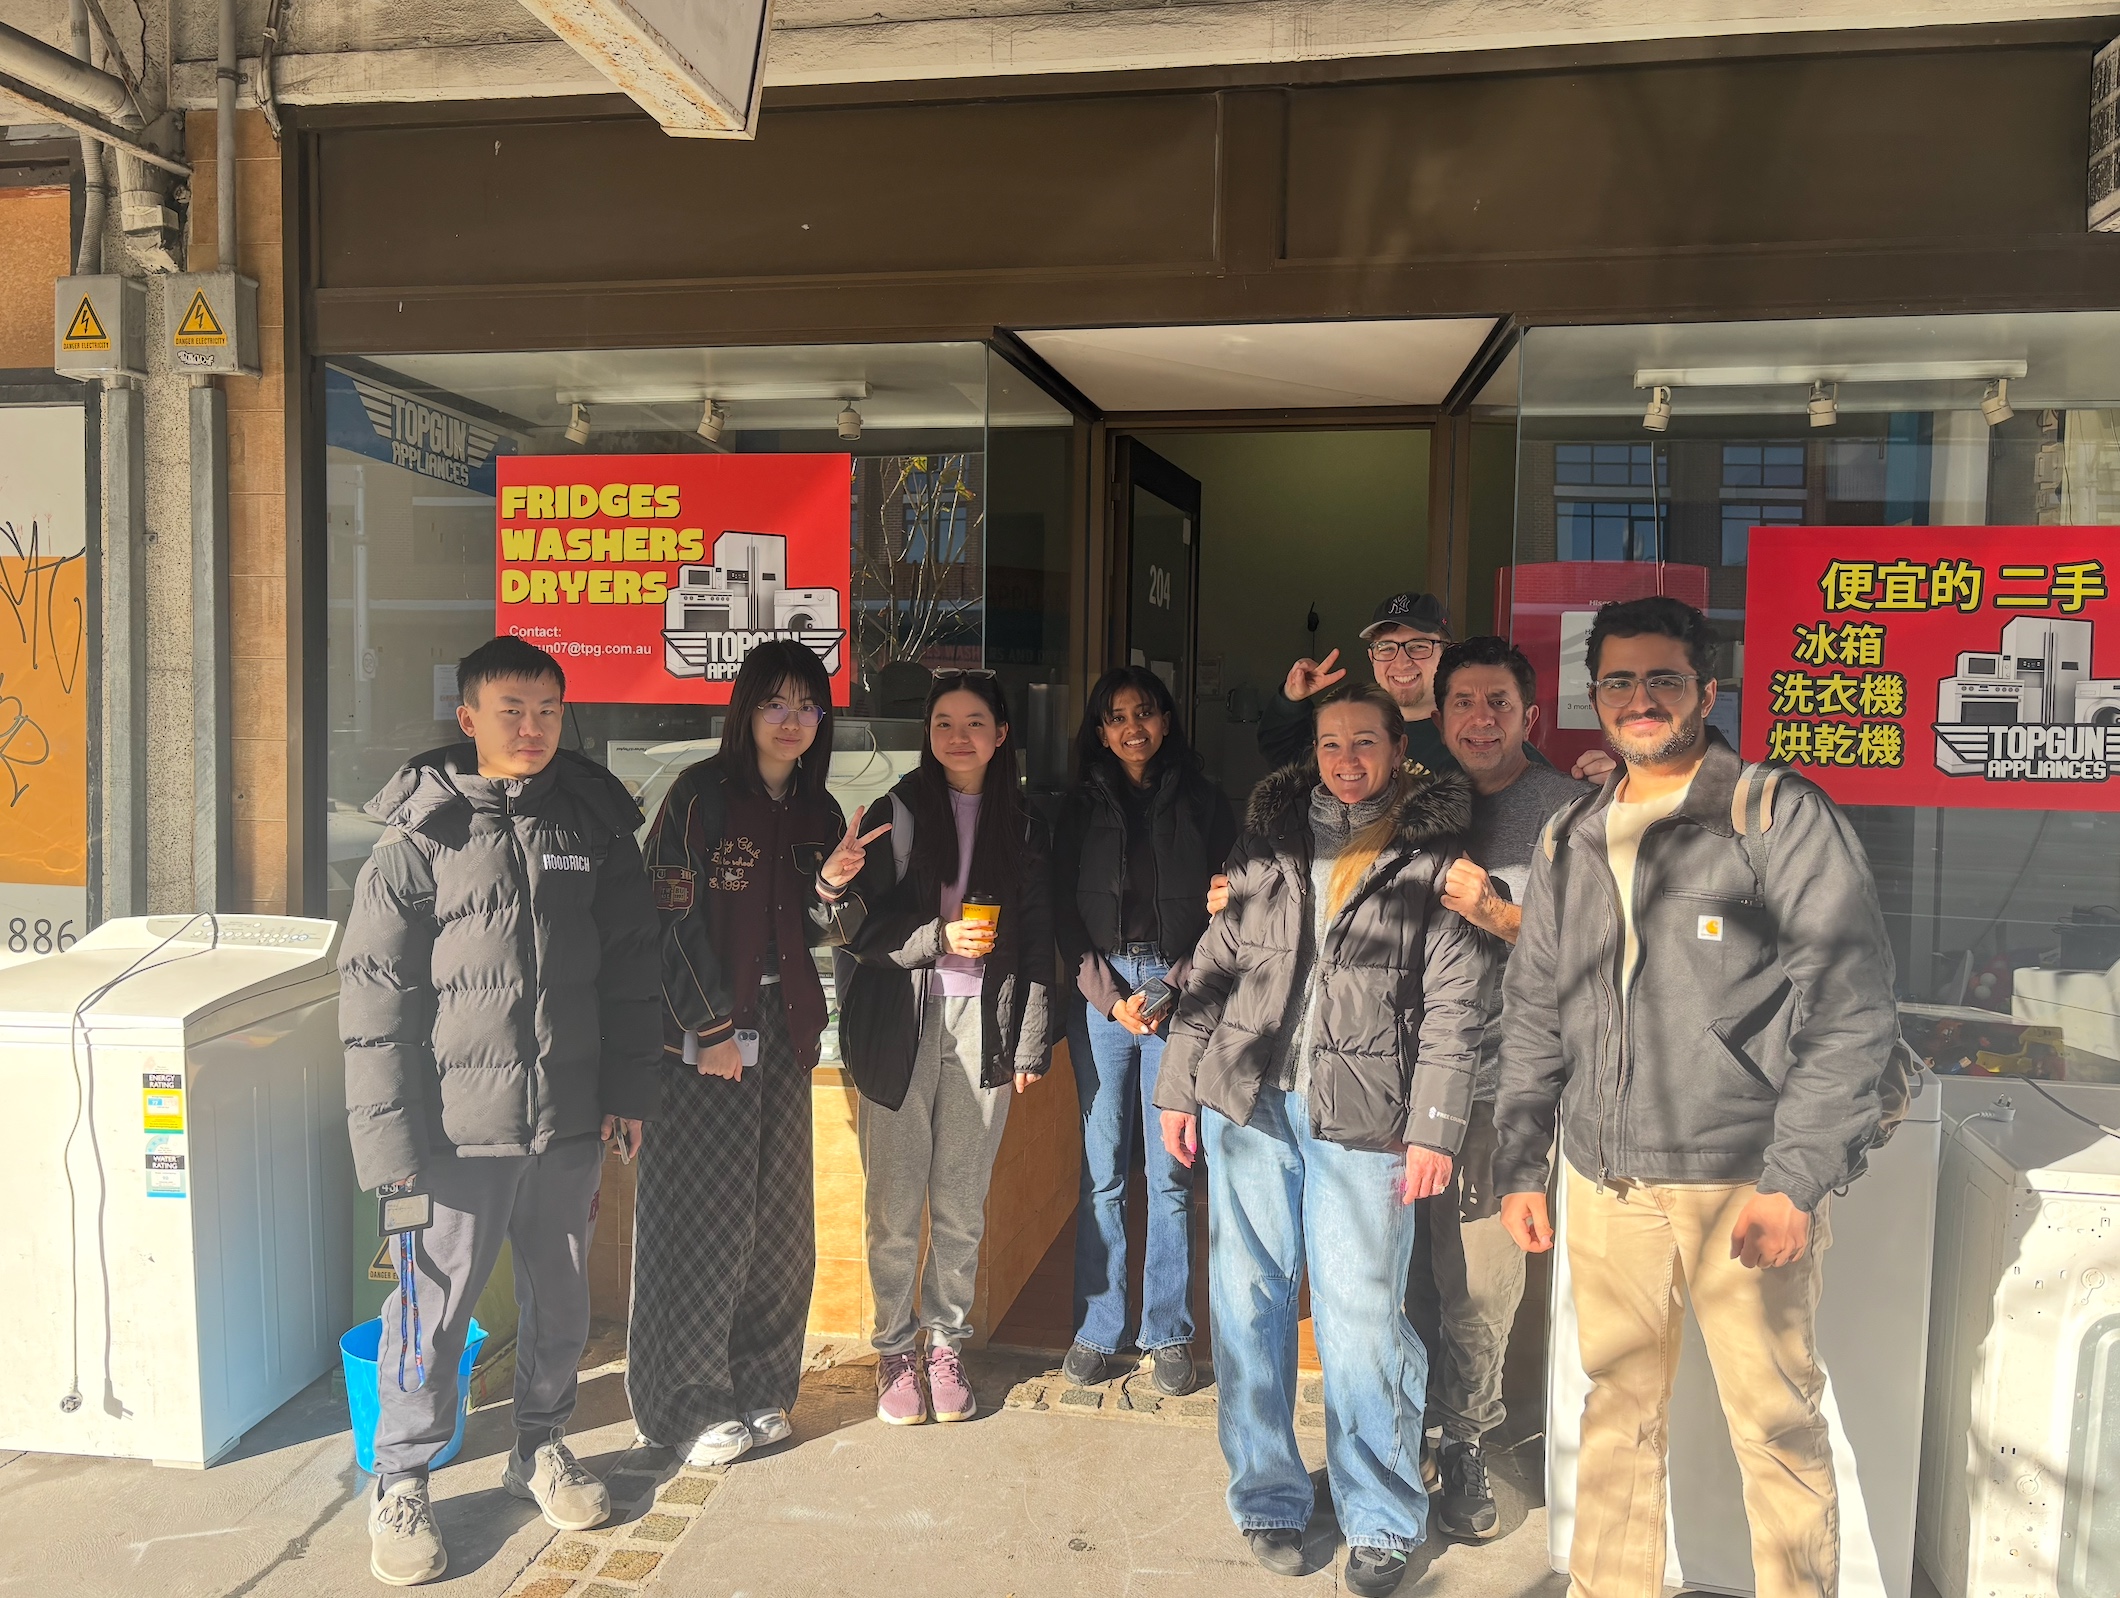
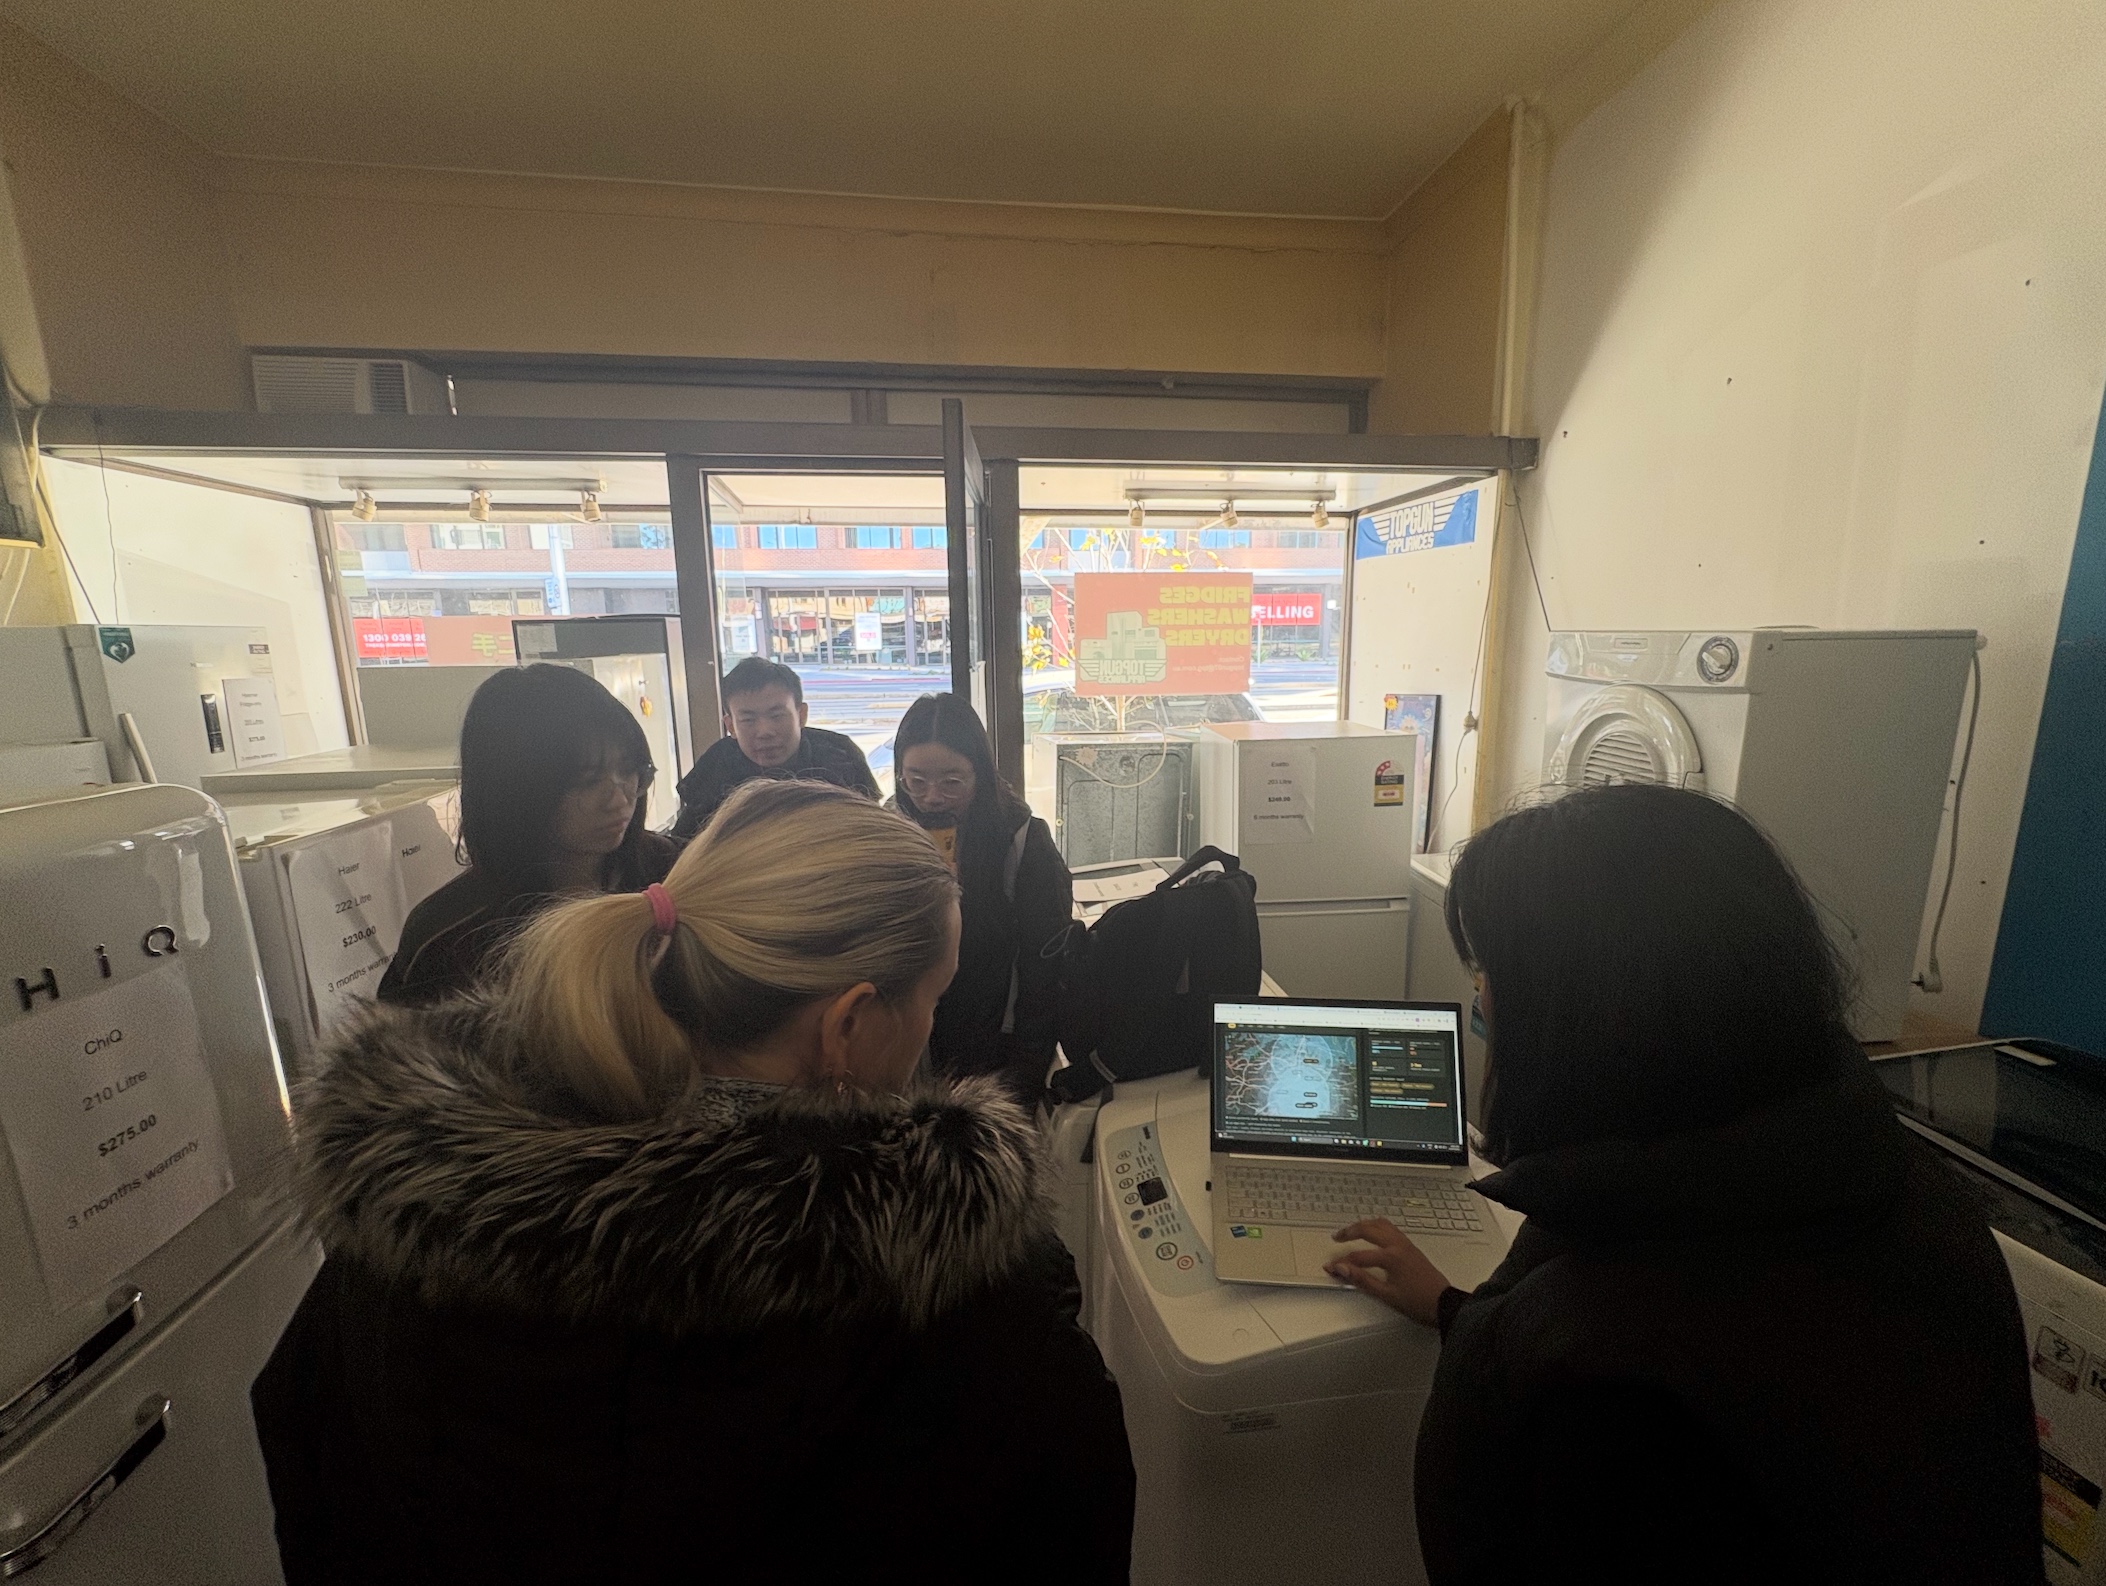
A teammate had recently moved and knew a local second-hand appliance business, Top Gun Appliances. We spoke with them about how they collect items, what kinds of products they recover, and how their business works in practice. That conversation validated the idea and helped us understand a real workflow we wanted to support.
What it does
W-Cycle predicts when and where reusable items are likely to appear before they become waste. It helps recycling, repair, and resale businesses prepare ahead of disposal peaks instead of reacting after items have already been left on the street.
The model forecasts move-in and clearout cycles using university calendars, suburb-level patterns, and category-based weighting. Users can explore forecasts by month, suburb, and business type through an interactive dashboard.
How we built it
We built W-Cycle as a transparent forecasting system with two parts: a FastAPI backend and a frontend.
The backend contains the reference forecasting logic and API endpoints. The model uses university term start and end dates to generate move-in and clearout signals, then combines those signals with suburb volume and category mix to rank the precincts most relevant for each business type.
The frontend is a Leaflet-based dashboard that visualises the forecasts on a map with a timeline slider and business search. We also embedded the forecasting logic client-side so the demo stays instant and responsive.
Challenges we ran into
One challenge was balancing realism with limited data. Some inputs, like university calendars and business locations, could be verified directly, while others, like suburb-level category mix, had to be estimated from context. We had to make sure those estimates were clearly labeled and did not pretend to be measured facts.
Another challenge was making the ranking logic meaningful. If we only used raw population, the results would be too generic, so we had to make sure category fit actually changed the ranking outcome.
Accomplishments that we're proud of
We’re proud that the project is grounded in a real business conversation rather than a purely hypothetical problem.
We’re also proud that the model is transparent and testable. Instead of treating it like a black box, we built logic that can be explained, verified, and adapted.
Finally, we’re proud that the final product is both practical and presentable.
What we learned
We learned the importance of separating real data from modeled estimates, especially when building something that needs to feel credible and honest.
What's next for W-Cycle
Next, we want to replace modeled estimates with stronger real-world data where possible, especially council hard-waste and collection data by item type.
We’d also like to connect the frontend directly to the backend API, pull live university calendar data, and expand the model beyond student housing to other predictable waste cycles.
Built With
- css
- docker
- fastapi
- github
- html
- javascript
- leaflet.js
- pydantic
- python
- uvicorn
- vercel

Log in or sign up for Devpost to join the conversation.