


Inspiration
Machine learning engineers rely heavily on visualizations. When we're learning about a new architecture in a paper or blog post, we often find ourselves immediately scanning for a model diagram to give us a sense of the network's structure and key features. When we're implementing our own models, we use automatically-generated diagrams like those in TensorBoard to diagnose bugs and identify mistakes. Visualizations are the best way to quickly and intuitively understand a neural network and bridge the gap between code and our own mental models.
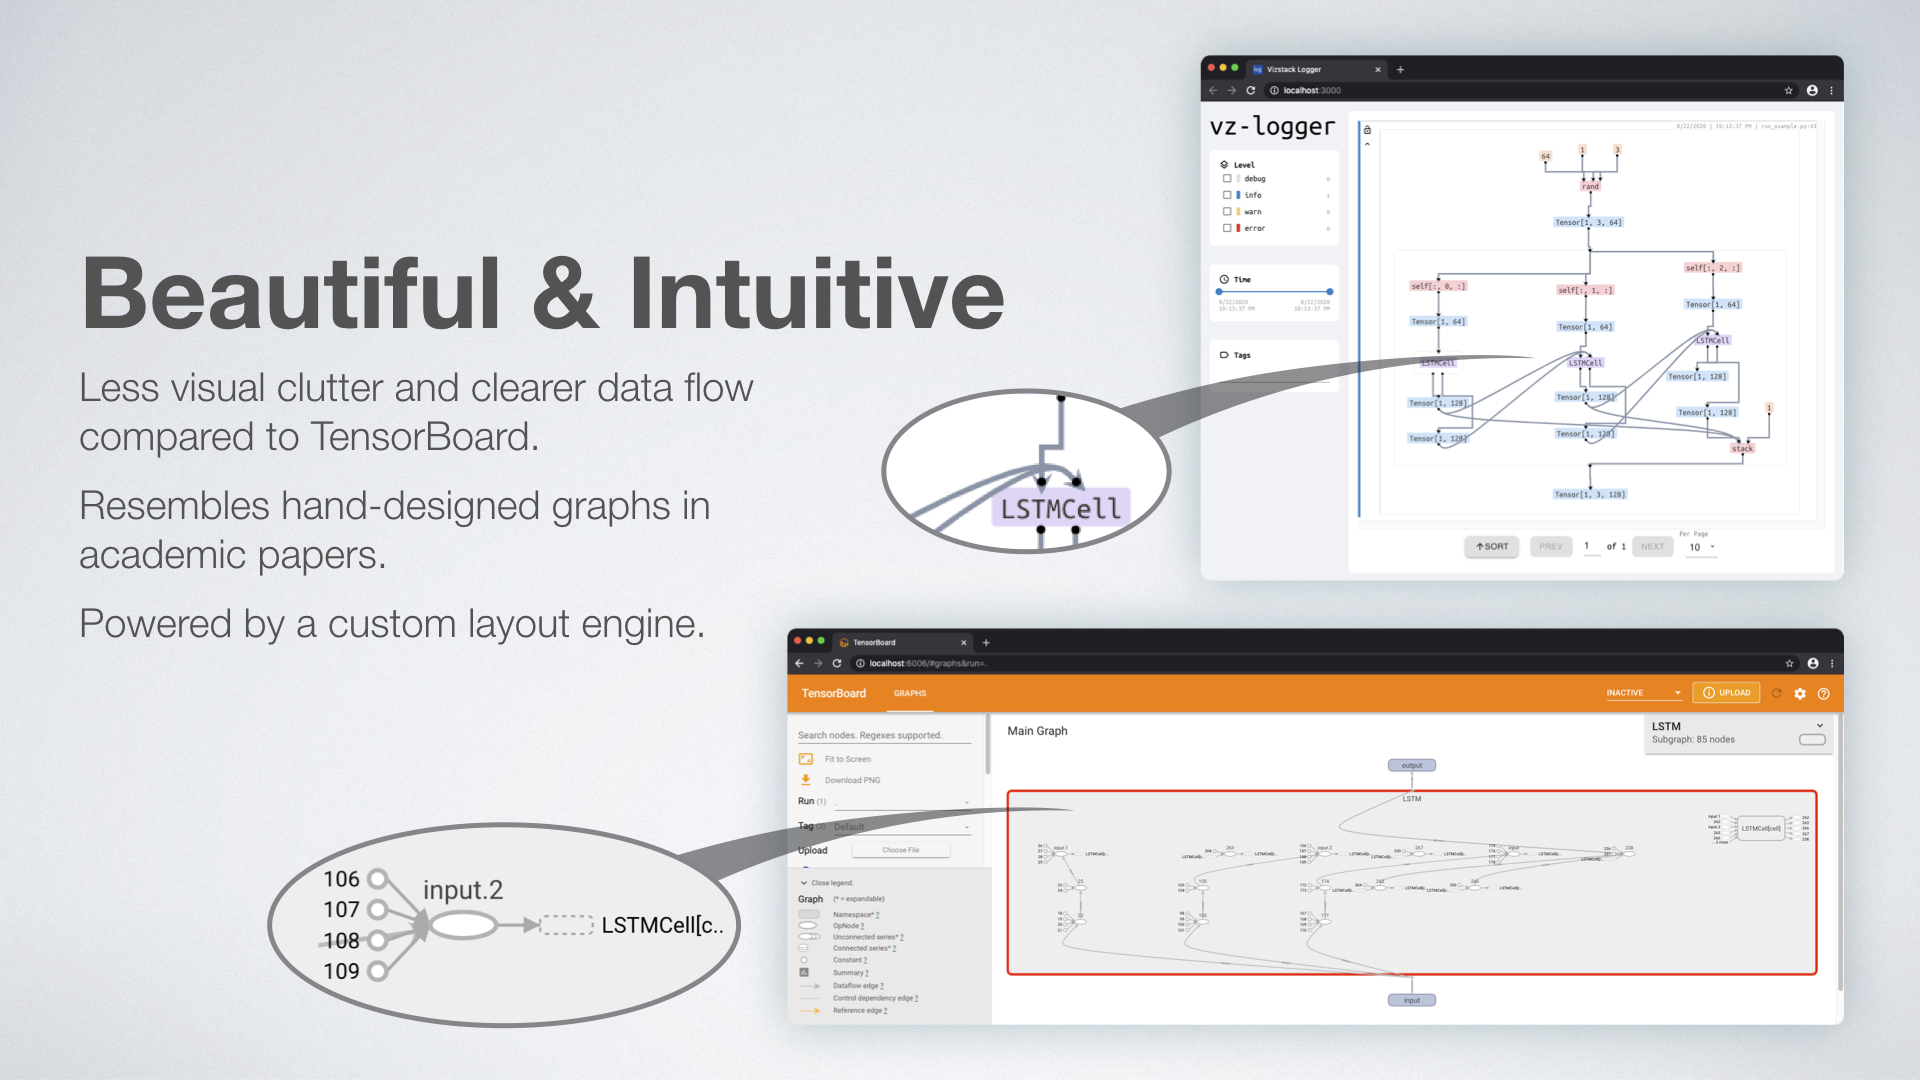
But current model diagramming solutions leave a lot to be desired. Existing automatic graph visualizers often fail to capture our intuitions. For instance, while every hand-designed diagram of an RNN shows it unrolled across time, layout engines like TensorBoard have no notion of time and end up producing jumbled and chaotic graphs in these common use cases. Even if we the engineers know how we want the diagram to look, we have no way to influence these automatic visualizers, and have to manually maintain a diagram with pen & paper, or PowerPoint. Neither of these solutions help bridge the gap between code and mental models, so we still find ourselves flitting between diagrams, plots, and command-line outputs, trying to remember which metrics correspond to which parts of the model.
What it does
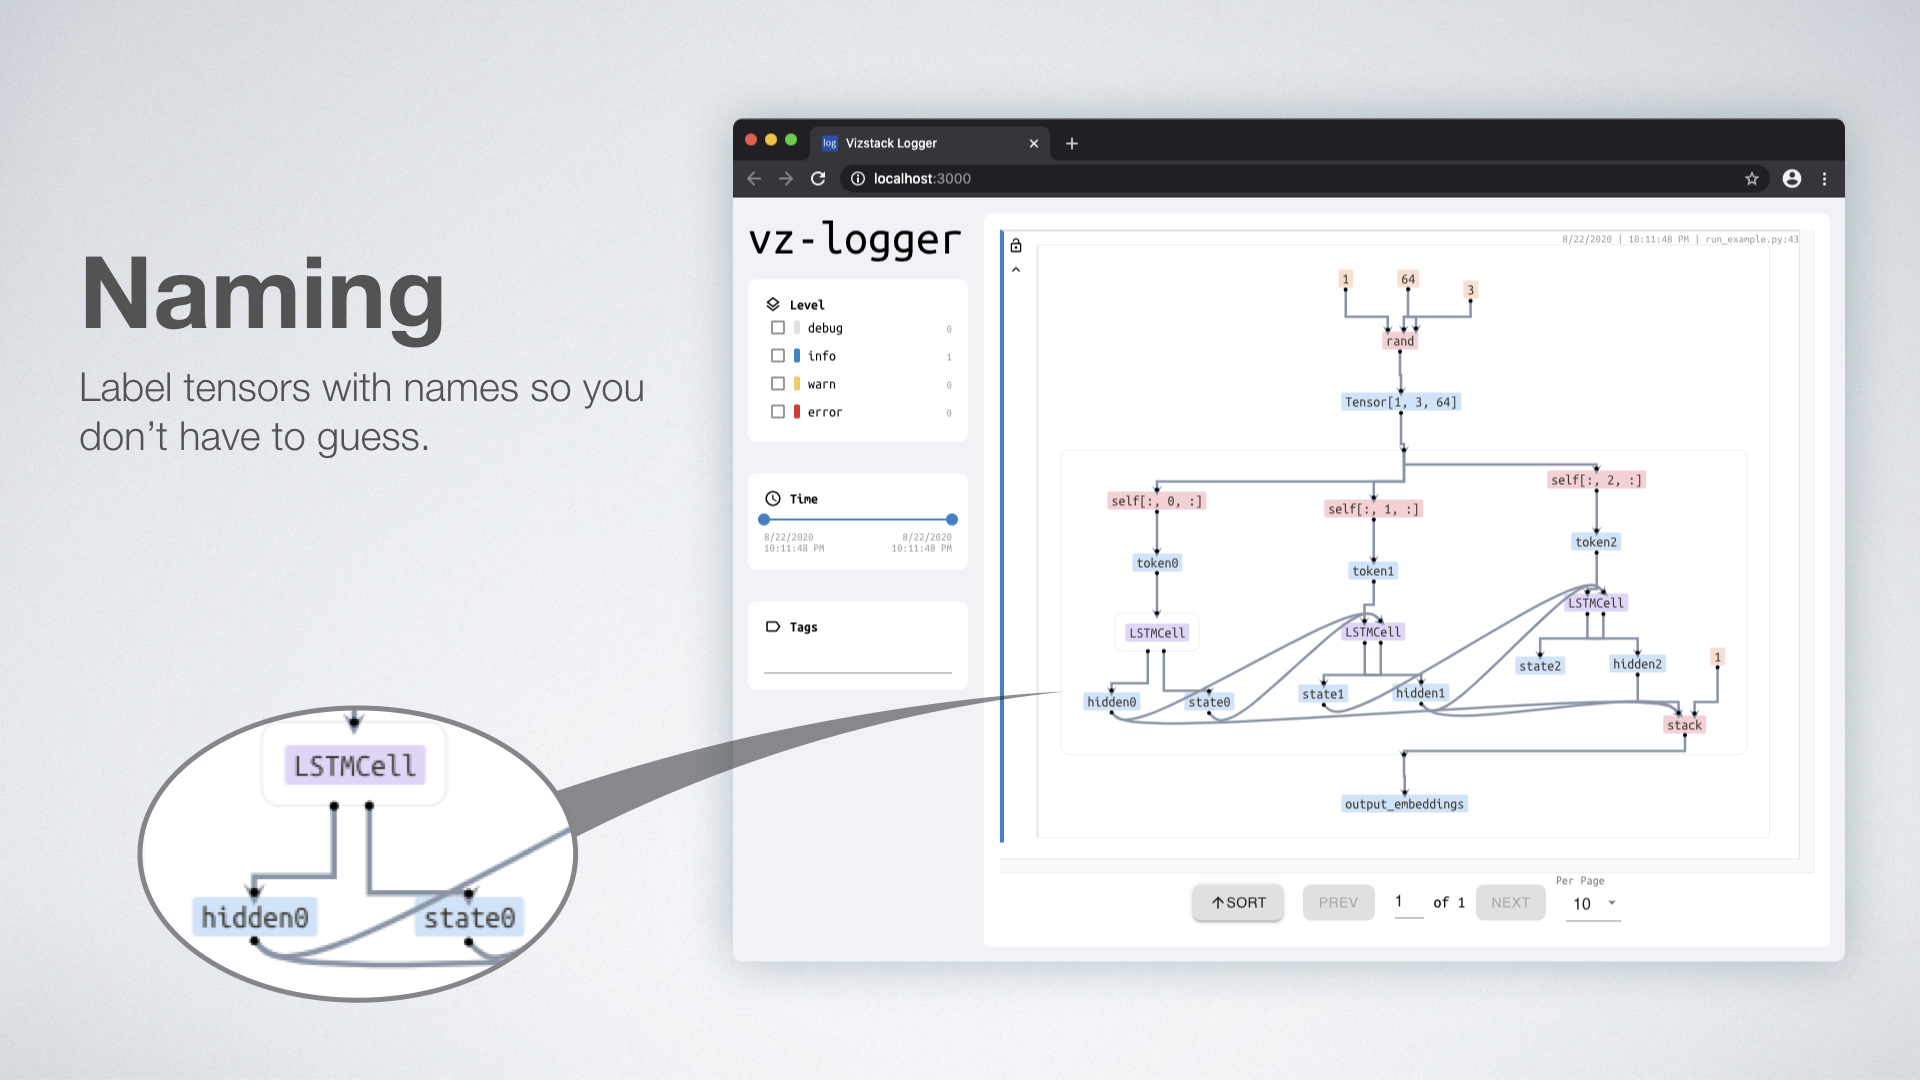
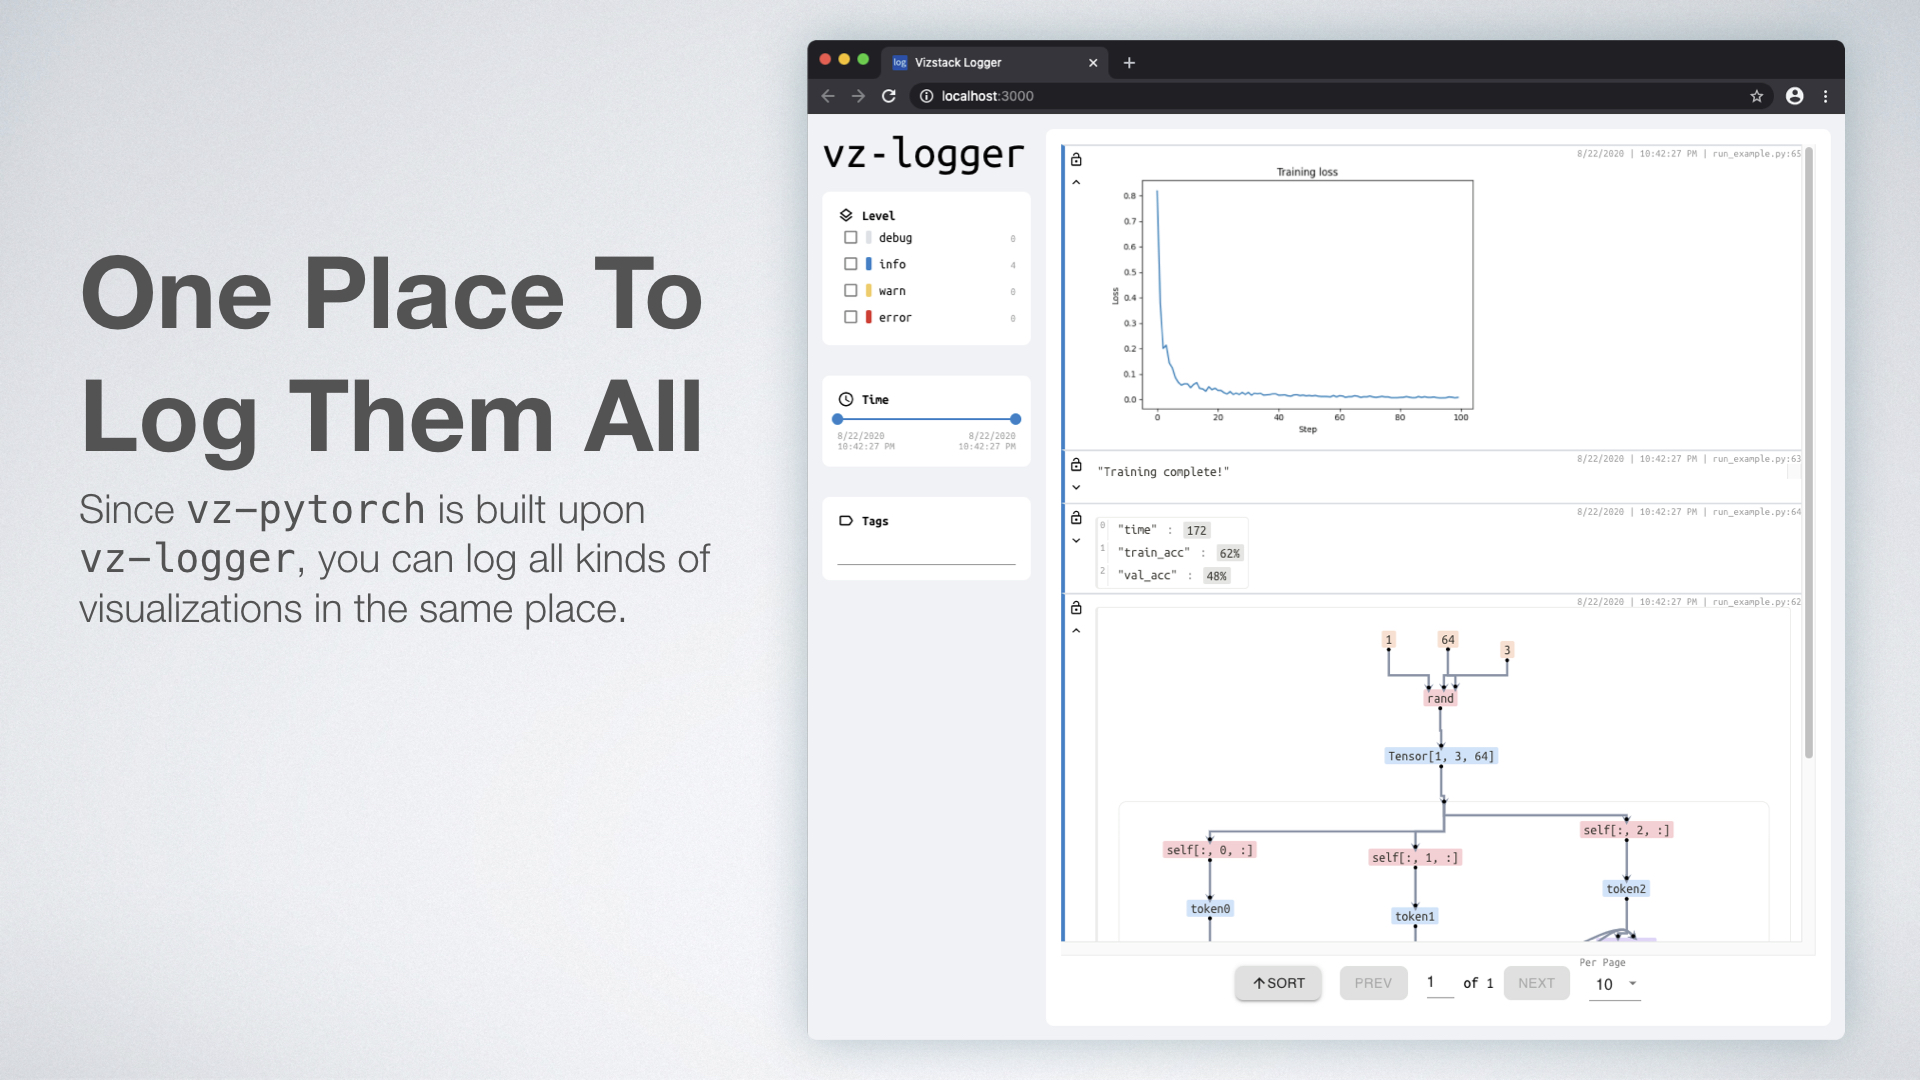
VZ-PyTorch produces beautiful, intuitive neural network visualizations that unify structure, implementation, and metrics. With just a few lines of code, VZ-PyTorch can render a diagram of any PyTorch model. These diagrams can be fine-tuned by inserting unobtrusive visualization cues into your code, which tell the layout engine how to structure your diagram to match your intuition. You can also attach plots and text outputs to the diagram, embedding information about your layers and tensors within the diagram itself.
How we built it
VZ-PyTorch combines a Python library with a simple logging server and a visualization tool we developed called Vizstack. A typical usage of VZ-PyTorch looks like this:
- The user imports the
vz-pytorchPython library into their code and specifies a PyTorch model they wish to track. vz-pytorchuses PyTorch hooks and monkeypatching to track execution of PyTorch functions and modules in a computation graph data structure.- The computation graph is translated to a Vizstack directed acyclic graph layout, which is serialized and sent to a simple Node.js logging server.
- The logging server sends the serialized graph to any connected frontends, which render the graphs using Vizstack React components.
Challenges we ran into
The biggest problem we encountered was how to beautifully lay out neural networks. A key feature of neural network models is their deeply nested structure; if each node is a function call, there might be additional function calls within that, which in turn call other functions, and so on. Many graph layout libraries do not handle this well, either pretending the nested structure doesn't exist or crashing entirely. Ideal neural network diagrams have other properties which are often unsupported, like horizontal or vertical alignments of nodes, orthogonal edge routing, and different edge orientation directions at different levels of nesting. To work around the limitations of existing libraries, we had to implement our own graph layout library called Nodal that could handle these advanced use cases.
Another substantial problem was how exactly to track PyTorch model execution. Module hooks which update the computation graph when executed are helpful, but fail to capture common operators like addition and transposition. We ultimately settled on an approach which combined hooks with dynamic overwrites of the functions in the torch library and on torch.Tensor, which update the computation graph when called.
Accomplishments that we're proud of
We are proud that our tool, without any special casing, is able to handle a diverse set of models, from basic feedforward networks to complex time-series RNNs and Transformers. We put a lot of work into understanding the styles and semantics of good machine learning diagrams and believe that our solution accurately captures those properties. We're also proud that the entire rendering pipeline, from the Python library to the React components to the graph layout engine, is built using our Vizstack and Nodal libraries, giving us full control and ensuring that we can tune our tool to consistently produce beautiful diagrams. The flexibility of our Vizstack tools also allowed us to implement key VZ-PyTorch features, like embedded plots, in less than an hour and with no special casing.
What we learned
A harsh lesson of this project was just how hard it is to get visualization right. Humans are incredibly good at synthesizing information from a diagram, but this means that even a slightly jumbled or sloppy diagram can really confuse the viewer. This is why the TensorBoard visualization falls short for virtually all the ML researchers we talked to. For our diagrams to be beautiful and useful, we spent a lot of time optimizing our graph layouts and tweaking parameters like colors, shapes, and sizes.
The flipside of this lesson was experiencing how powerful a good visualization can be. When we got these parameters right, the structure of complex models like Transformers and ResNets quickly became clear, even to team members who weren't familiar with those models before. Our visualizations even helped us debug our example models; it wasn't until we saw the excess edges in the graph that we realized we were returning unnecessary vectors from our LSTM implementation. When a visualization is just right, everything clicks and becomes clear.
What's next for VZ-Pytorch
We plan to continuing improving our layout engine to make even cleaner diagrams at even larger model scales. Support for more advanced models will also require improvements to our Python library, such as enabling tracking of C function and CUDA kernel calls. We're also working on expanding our selection of out-of-the-box embedded plots, making it even easier to add useful information about tensors and layers in model diagrams.
Built With
- python
- pytorch
- react
- typescript
- vizstack


Log in or sign up for Devpost to join the conversation.