-
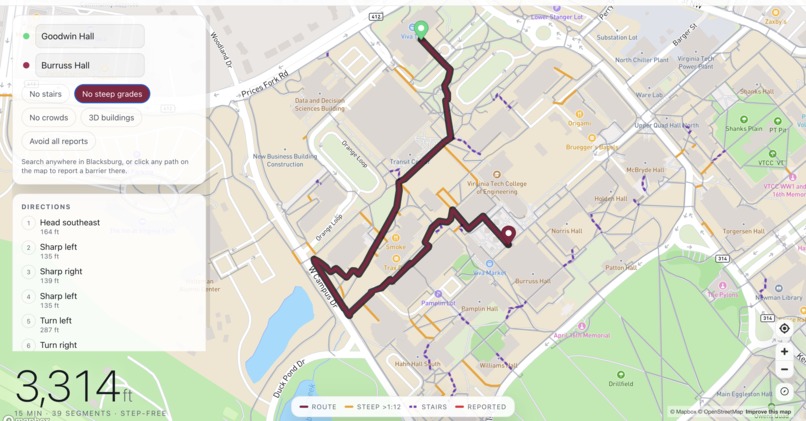
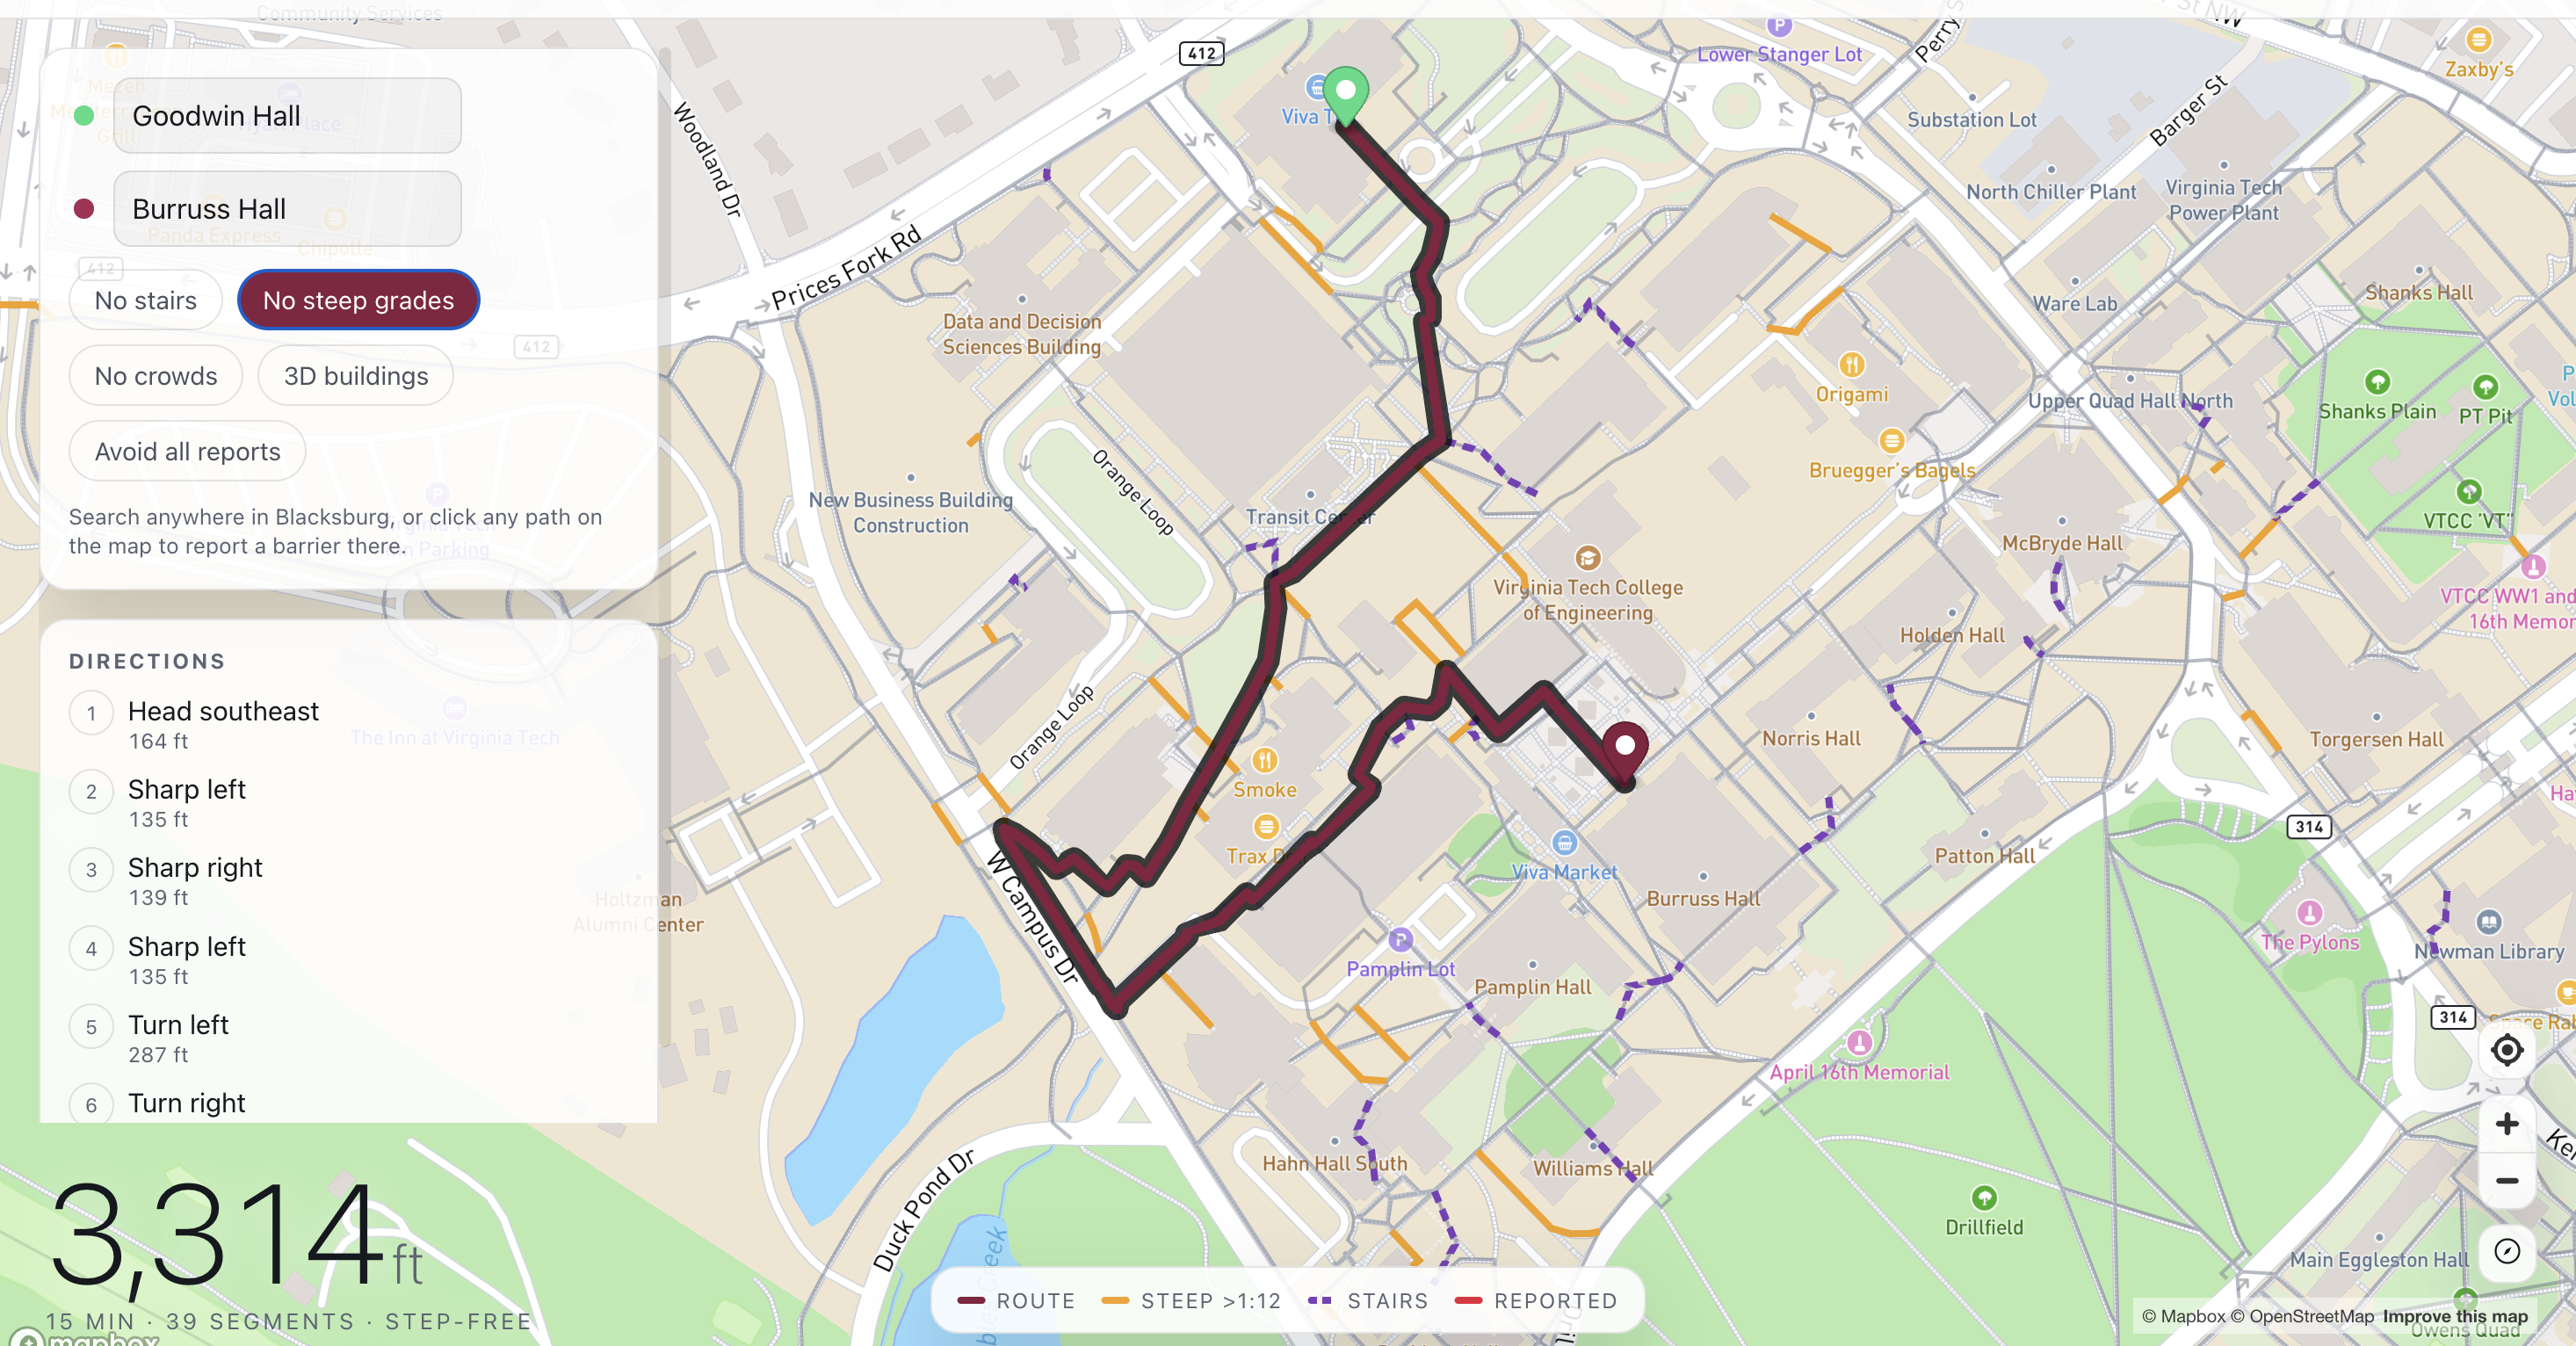
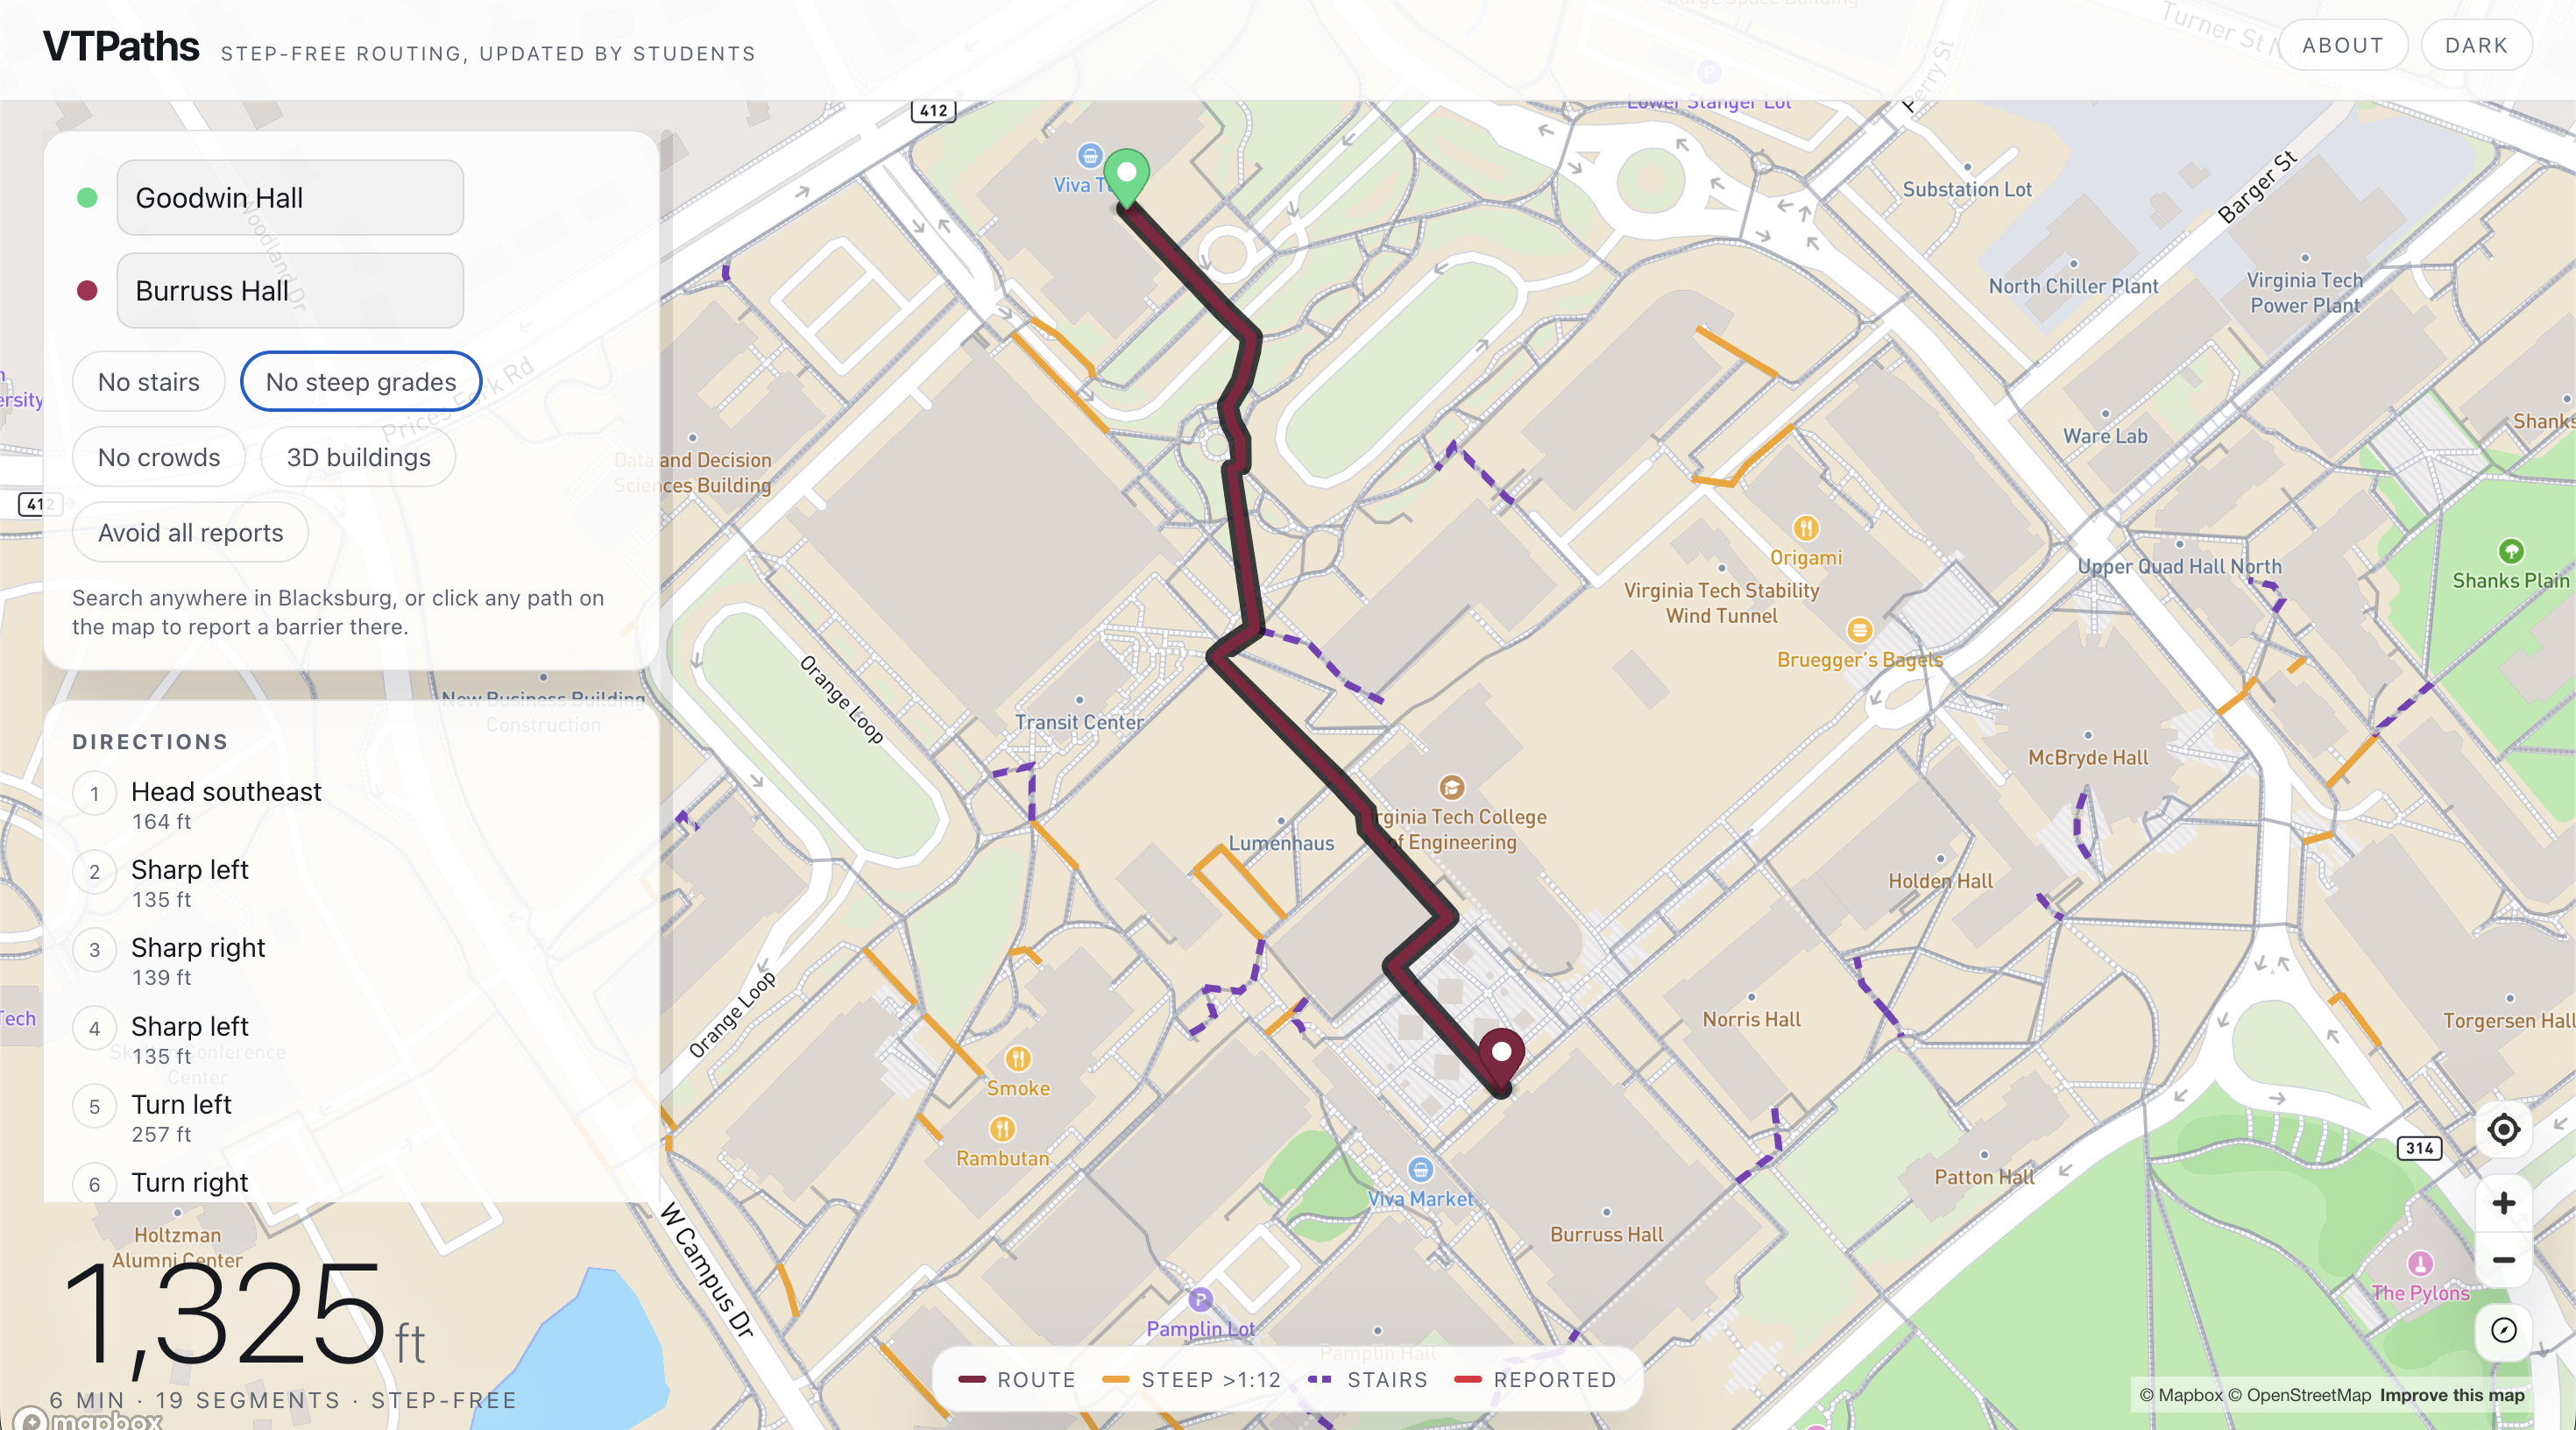
Detour to avoid Steep inclines
-
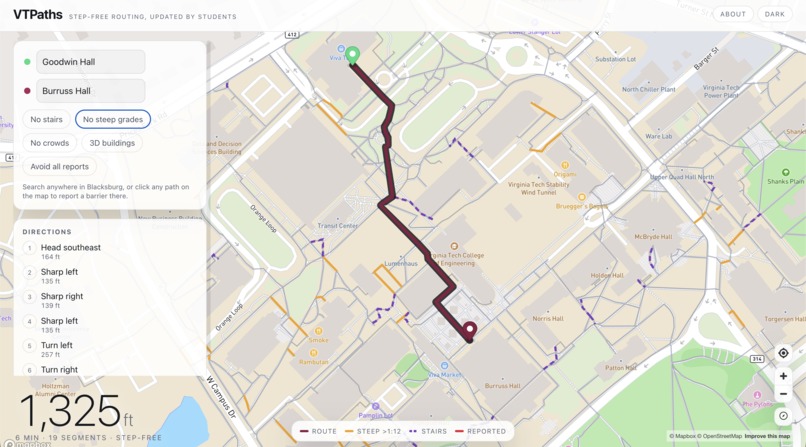
Path with optimistic conditions
-
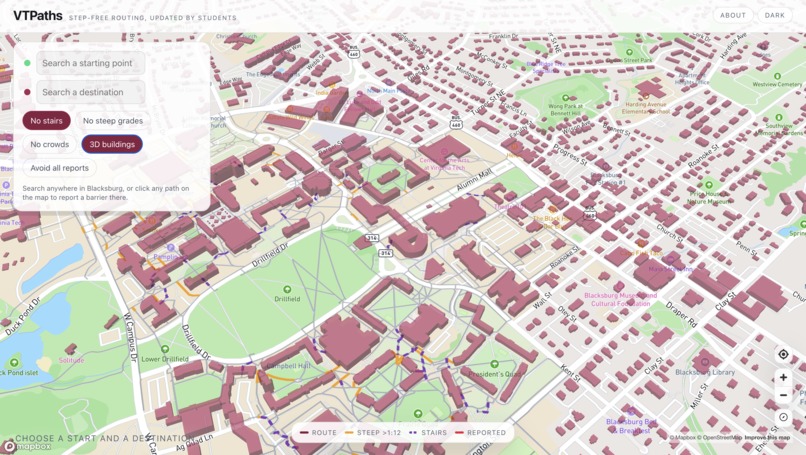
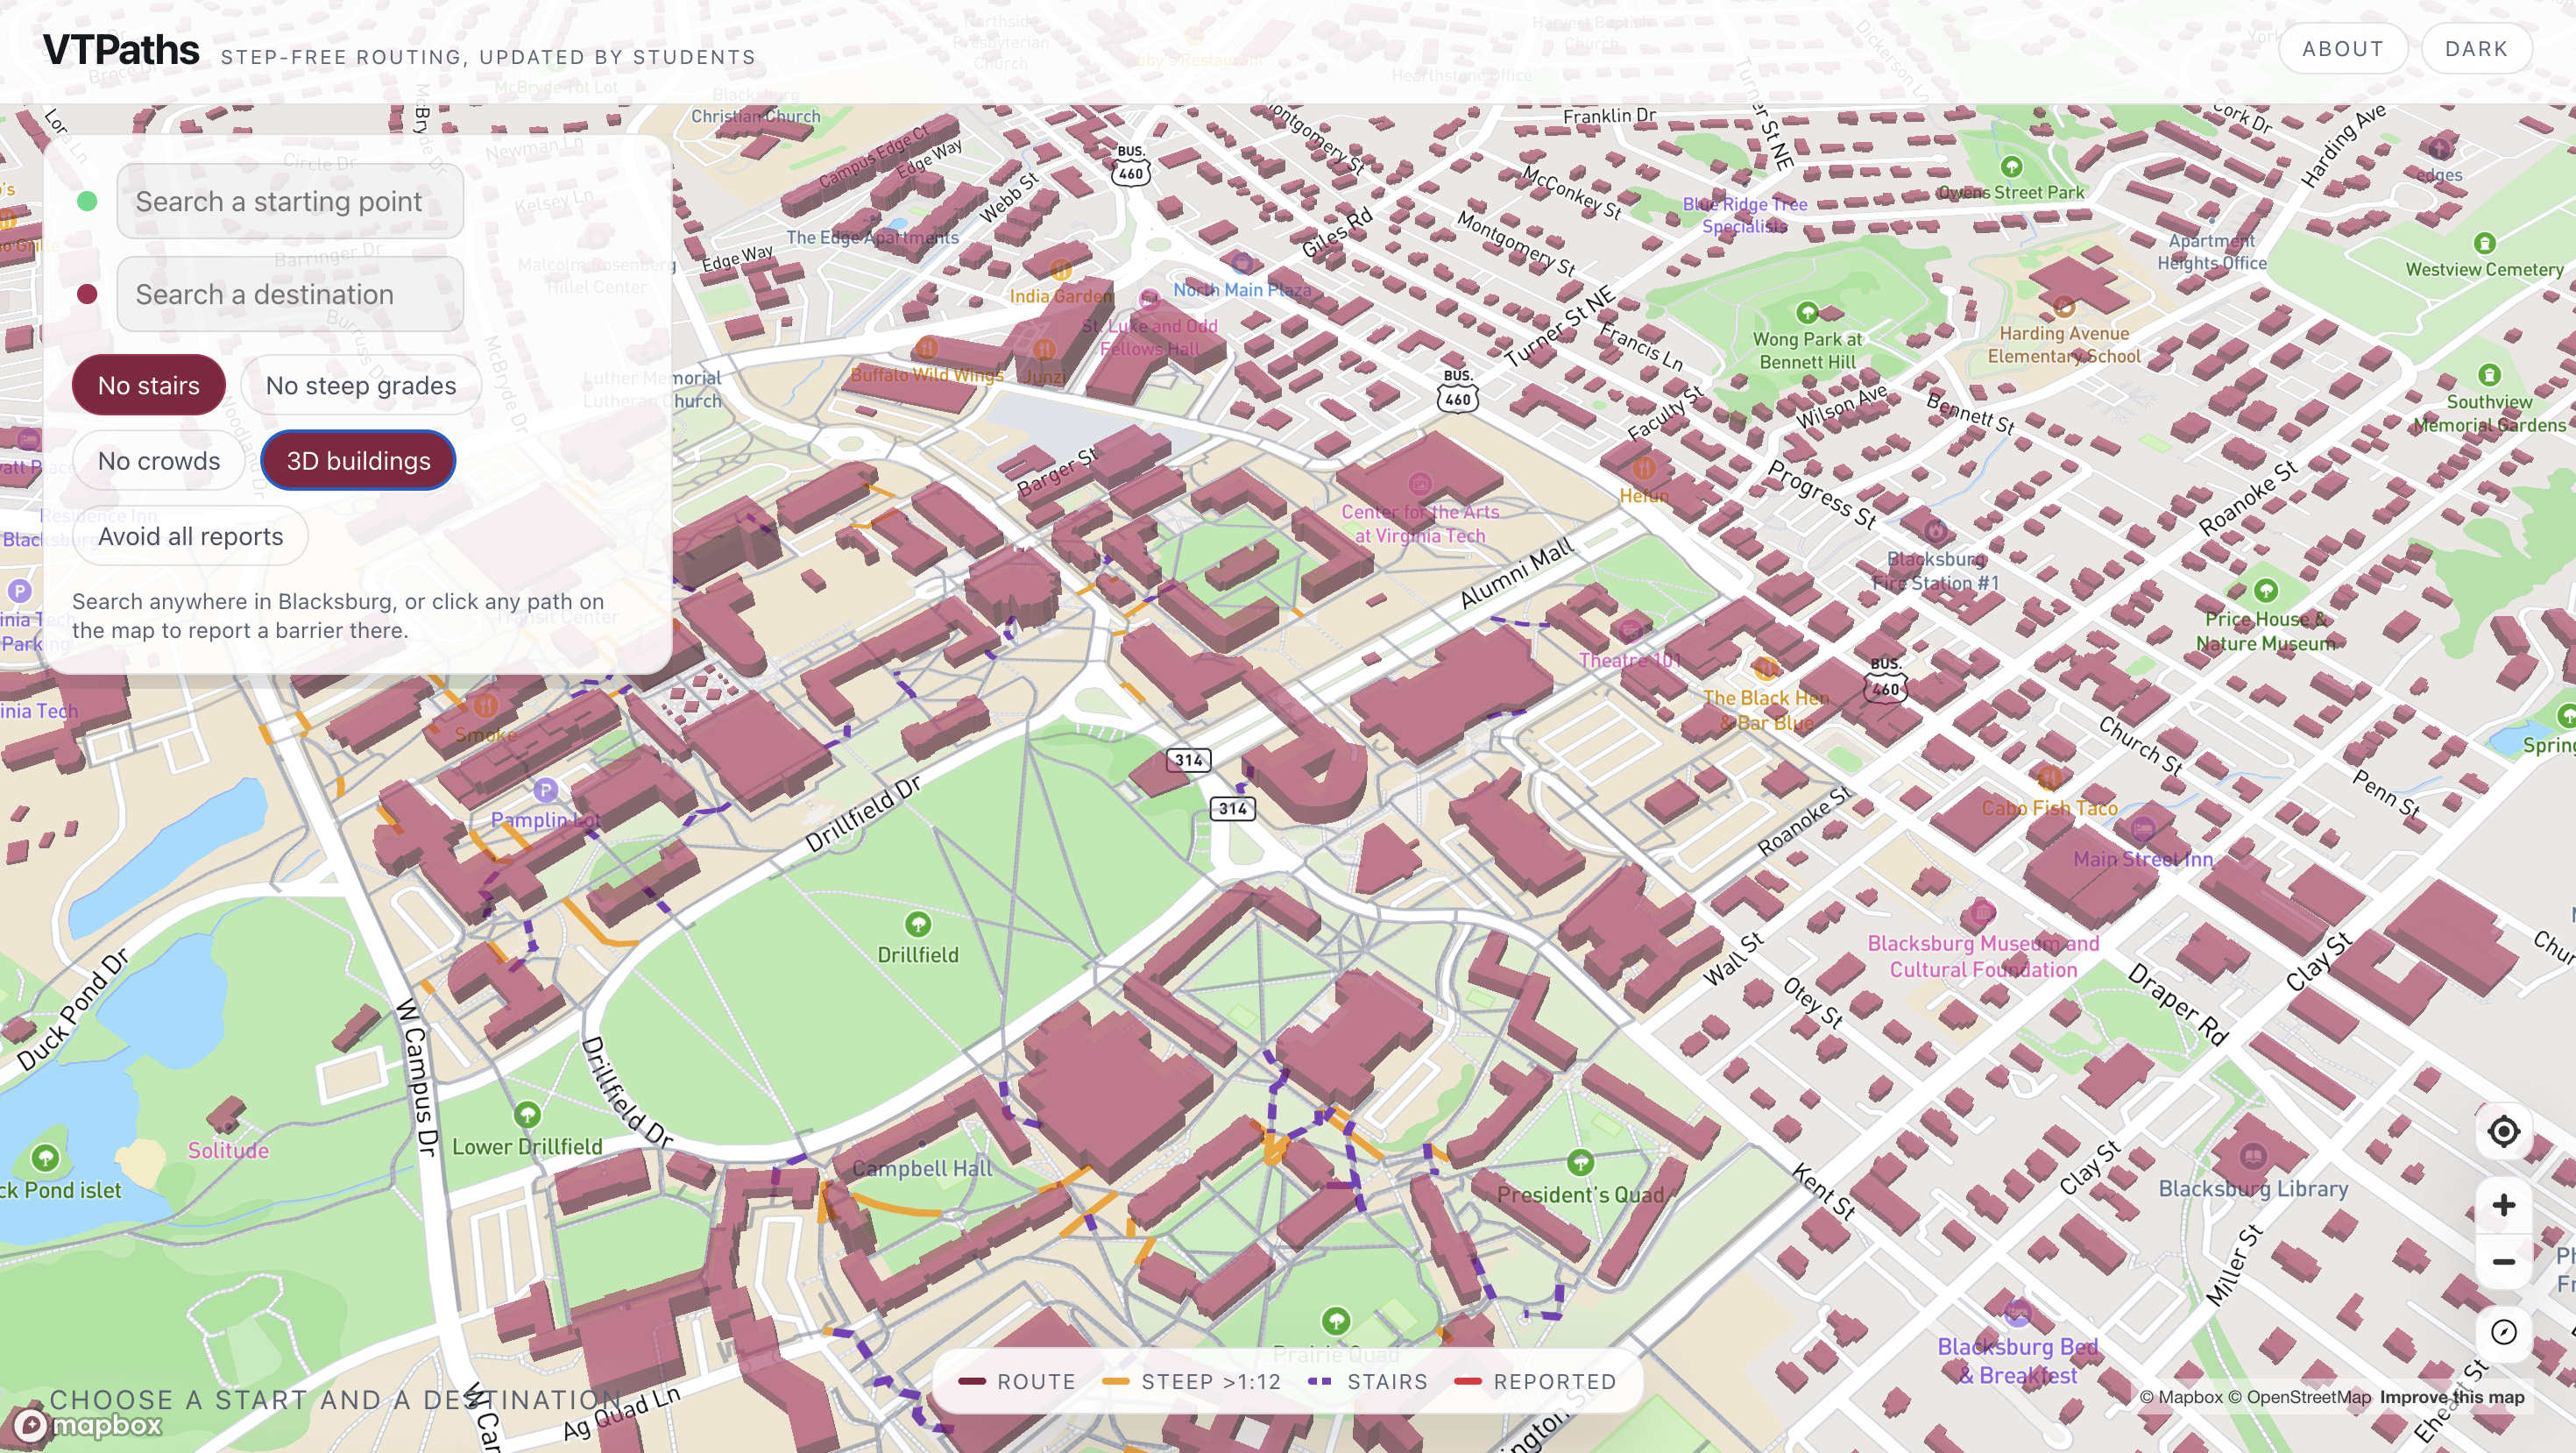
3D Map of Blacksburg visualized using public ArcGIS data
Inspiration
Virginia Tech already has an accessible campus map. Since 2022, Enterprise GIS has run it with the Office for Equity and Accessibility and the Disability Alliance and Caucus, and it routes between two points using only accessible paths. It is good, and we are not trying to replace it. Instead, we're allowing students to interact with the accessibility map and provide each other warnings and details about campus walking conditions.
What it does
VTPaths routes you across campus on step-free paths and reroutes everyone when someone reports a barrier.
- Step-free routing across 2,002 path segments and 1,790 intersections - about 67 km of VT's surveyed accessible network - between any of 158 campus buildings, or anywhere in Blacksburg via search, snapped onto the routable network.
- Preference toggles for stairs and steep grades that visibly redraw the route, with the affected segments drawn on the map so you can see what's being avoided.
- Barrier reports of five fixed types (blocked, elevator out, construction, ice, crowded), tied to a specific path segment. One report makes a segment expensive; a second confirmation makes it impassable.
- Live sync. A student taps a barrier on their phone at /report, and every open client redraws its route.
How we built it
Vite, React, TypeScript, Mapbox GL, Supabase, and Vercel. No backend service, no auth, no state management library, no graph library.
The data is VT's own. We pull the Access Route layer from VT's public ArcGIS REST service - strictly read-only, GET /query and nothing else - and snap the raw polylines into a node/edge graph. VT's layer doesn't carry everything routing needs, so we enriched it from two open sources: USGS NED 10m elevation to derive grades against the ADA 1:12 threshold, and OpenStreetMap to find stairs. That produced 111 steep segments and 45 stair segments the raw layer couldn't tell us about.
Routing is a hand-written Dijkstra in 58 lines.
Challenges we ran into
VT's polylines are not a graph. They're a pile of line segments whose endpoints are sometimes a survey hair apart. Snapped naively, the network fragments into 119 disconnected components: the largest holds only 1,378 of 1,790 nodes. A building snapped onto a stranded fragment looks perfectly routable and then never finds a route. We run union-find at startup and only offer destinations in the main component.
The data didn't have what the toggles needed. VT's type field is meant to flag steep segments at the ADA threshold, but every live feature came back "Normal." And the accessible-path layer excludes stairs by construction rather than tagging them, so stair shortcuts simply don't exist in it. Both had to come from outside VT's data.
Accomplishments that we're proud of
Last year's VTHacks saw a campus wheelchair routing project win "Best Hack That Didn't Work," and it failed because its route data was hand-drawn and sparse. We read that as the central risk and designed around it: every feet of geometry we route on is VT's own survey work, and we never hand-drew a path where a VT layer existed.
What we learned
We learned that we can make a good product without necessarily making an unheard of technology. We built our project atop of public data and a project from Enterprise GIS, but because of our unique perspective as students we were able to improve it by making it interactive.
What's next for VTPaths
- Making it a mobile app, we only used a website because it would be easier to demonstrate during presentations.
- Official closures and student reports on one map, clearly distinguished
- Offering this to Enterprise GIS as an input to their map, not a competitor to it
Built With
- mapbox
- supabase
- typescript
- vercel

Log in or sign up for Devpost to join the conversation.