Vrinda-Stores-Data-Analysis
Project Details Steps used for building the project: -> Importing file to Excel -> Data Cleaning, Data Processing (using formula) -> Pivot Tables -> Annual Sales Report -> Interactive Dashboard with filters
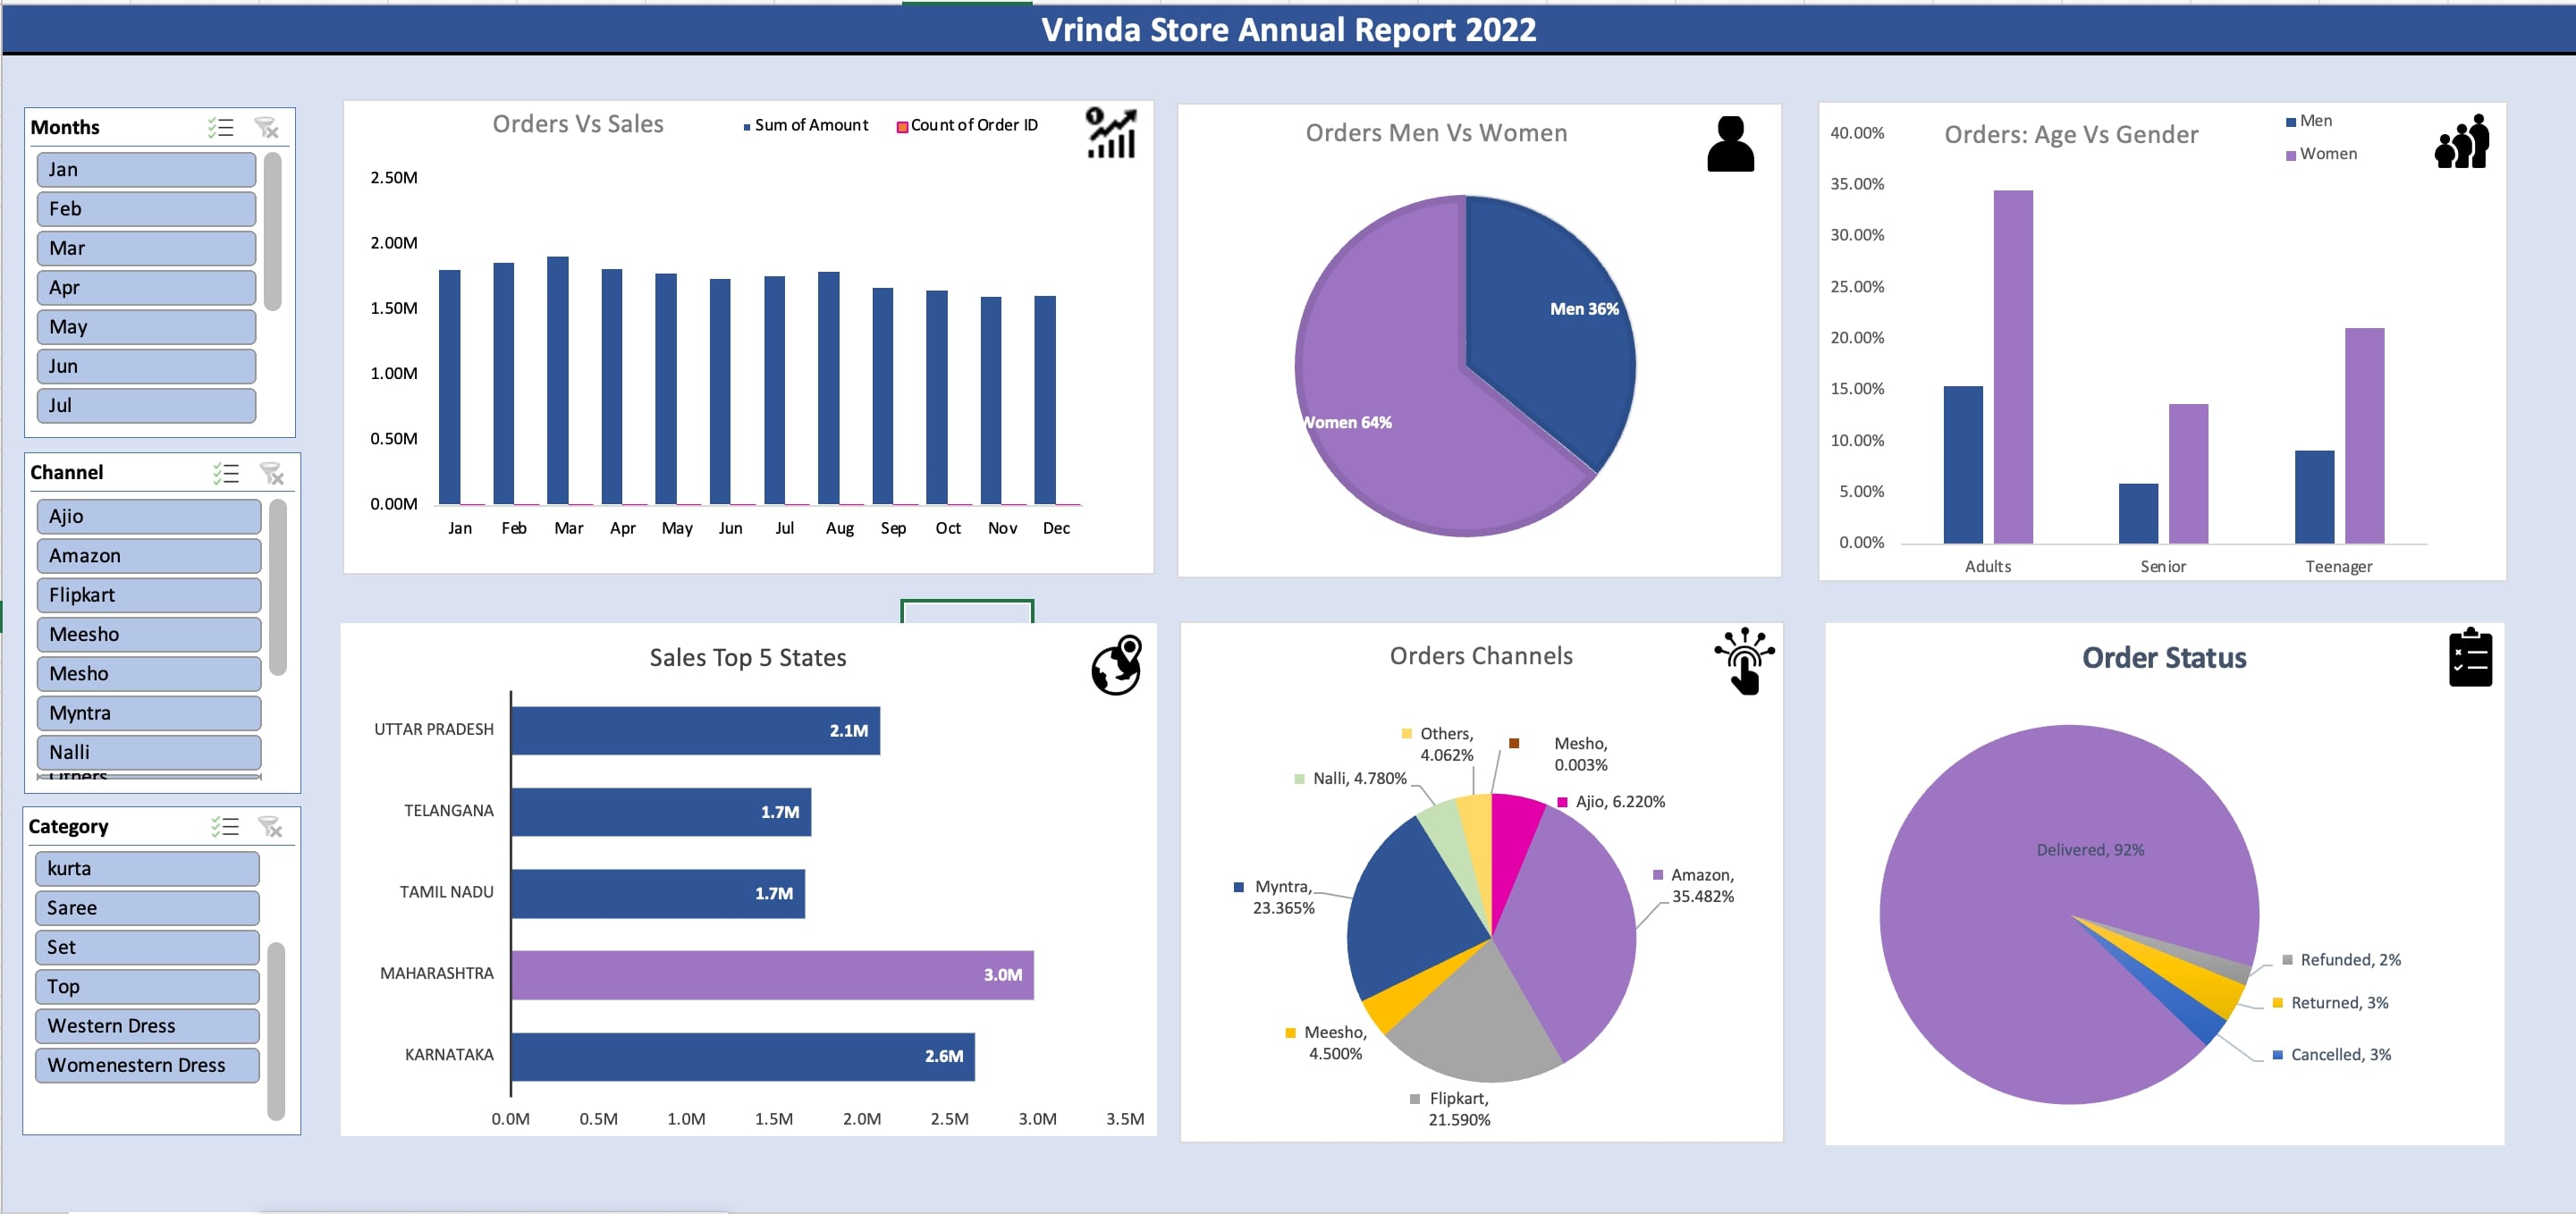
Following are the key insights which are derived from the Annual Sales Report -
1️⃣ Maximum sales and maximum number of orders is in March and November recorded the minimum sales and minimum number of orders.
2️⃣ Out of the total orders placed, 64% orders are placed by Women and the rest 36% orders are placed by Men. In Women category, Adult Women are having the maximum orders followed by Senior Men having the minimum orders.
3️⃣ Maharashtra is the state with the maximum order followed by Karnataka, Uttar Pradesh, Telangana, and Uttar Pradesh.
4️⃣ Amazon is the channel through which the maximum orders are delivered. Delivered rate is 92% with cancelled rate 3%, returned rate 3% and refunded rate 2%.
Built With
- cleaning
- excel
- pivot-table
- power-query

Log in or sign up for Devpost to join the conversation.