-
-
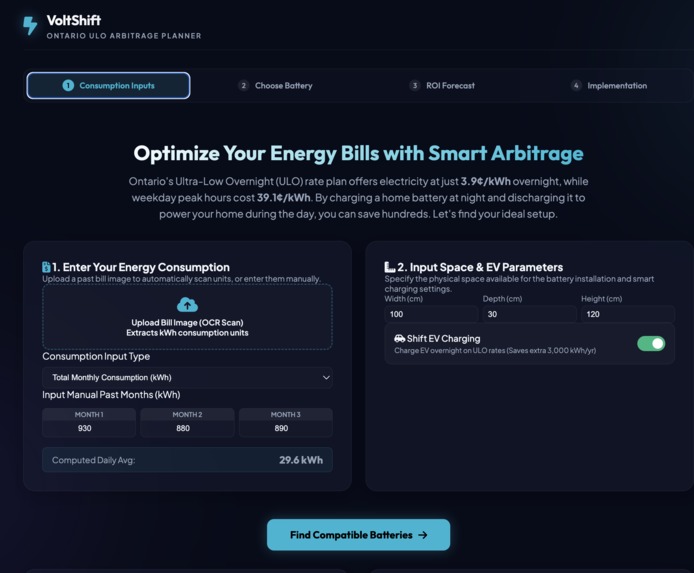
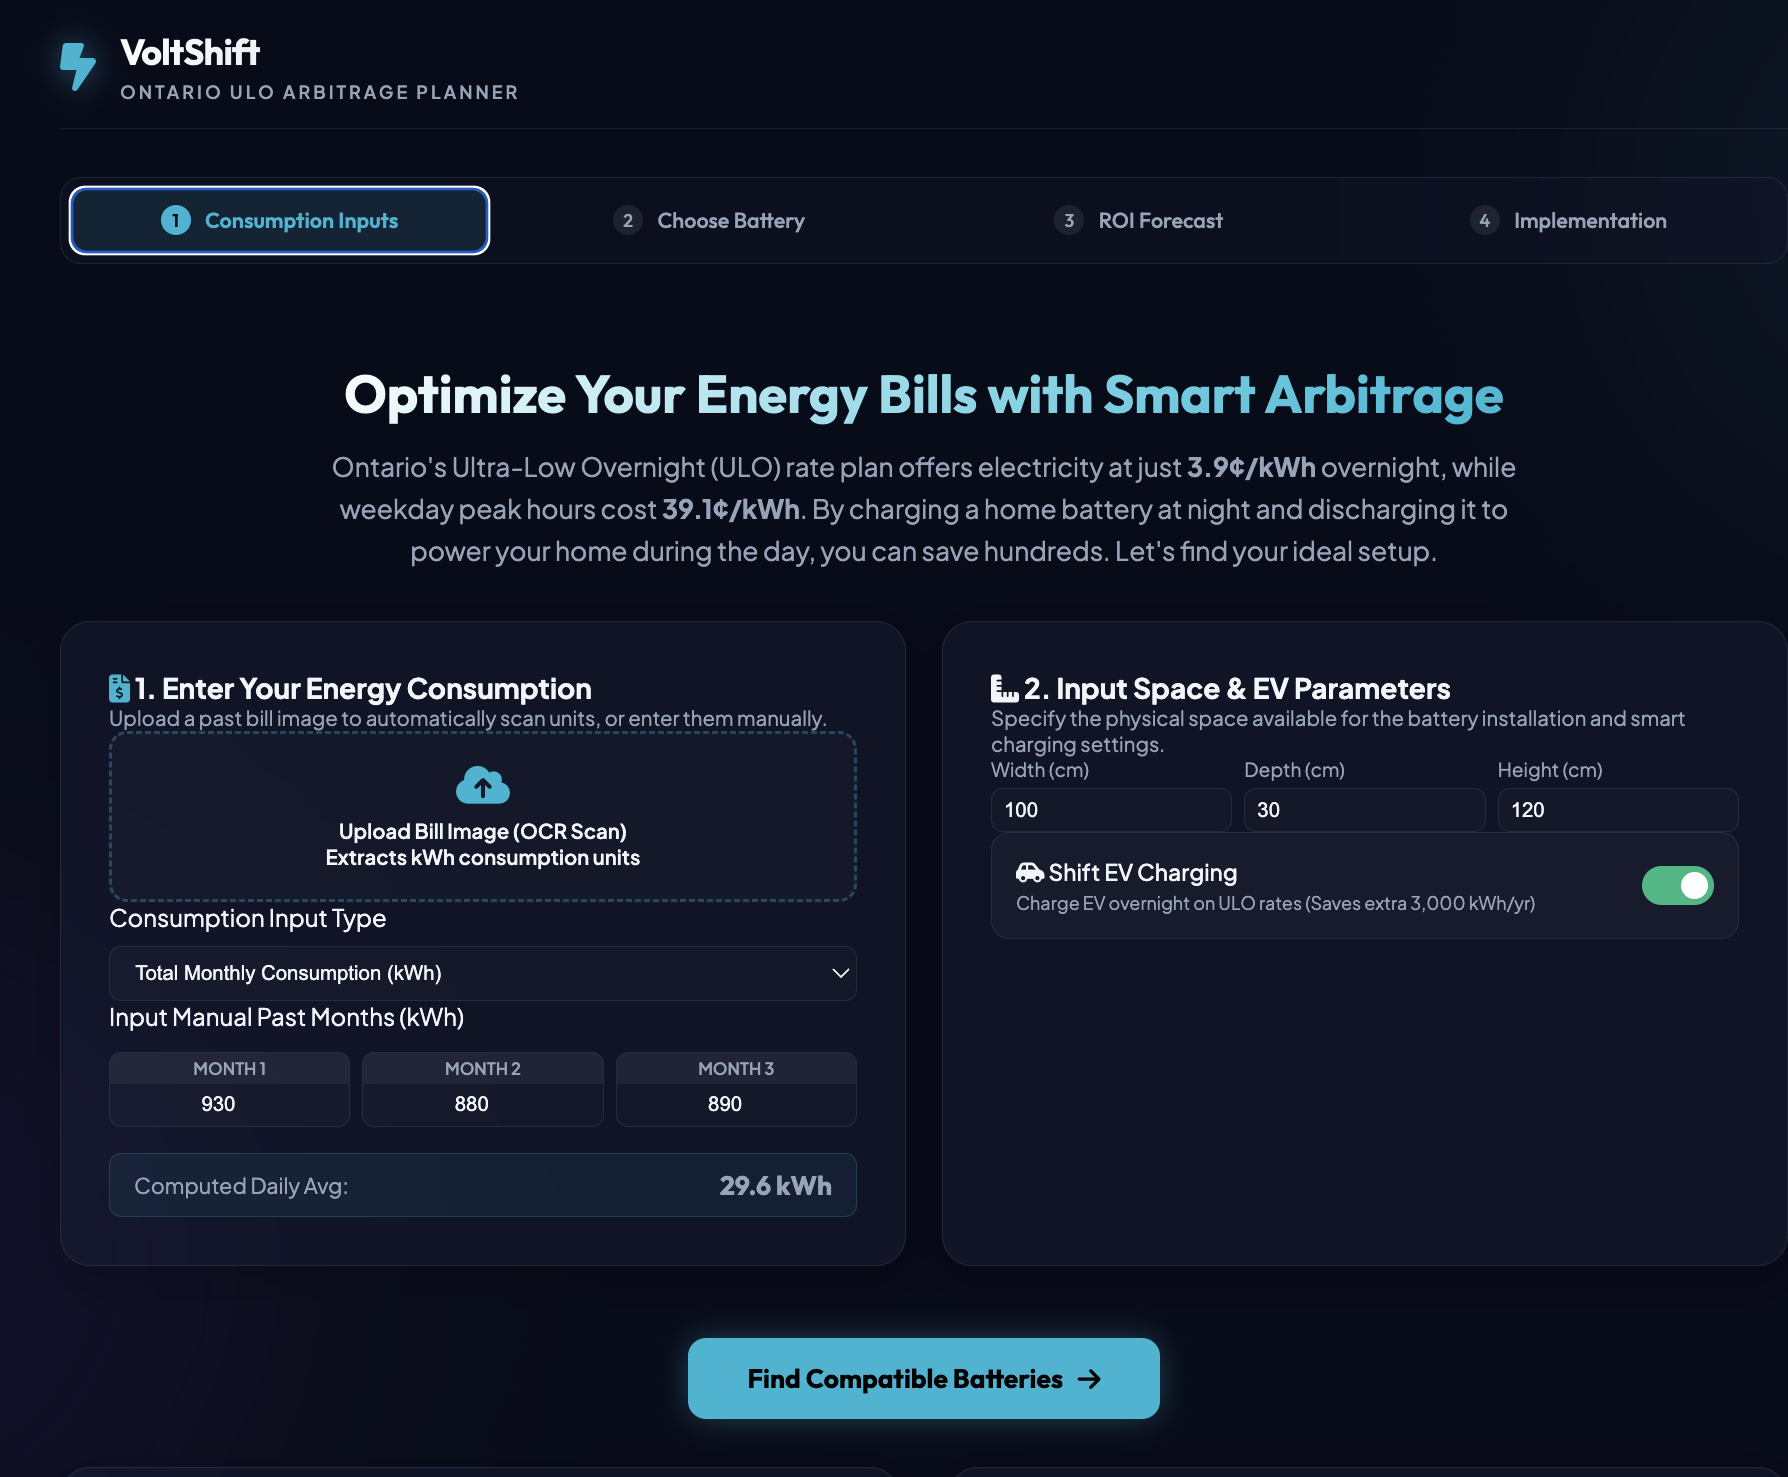
understand consumption
-
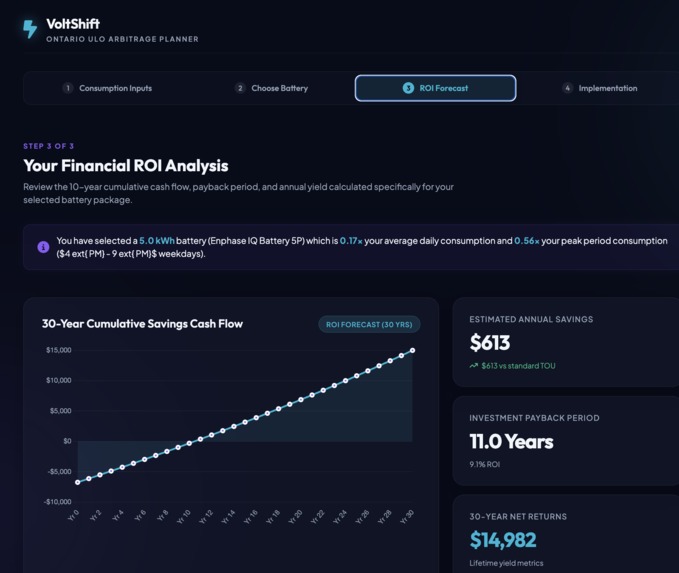
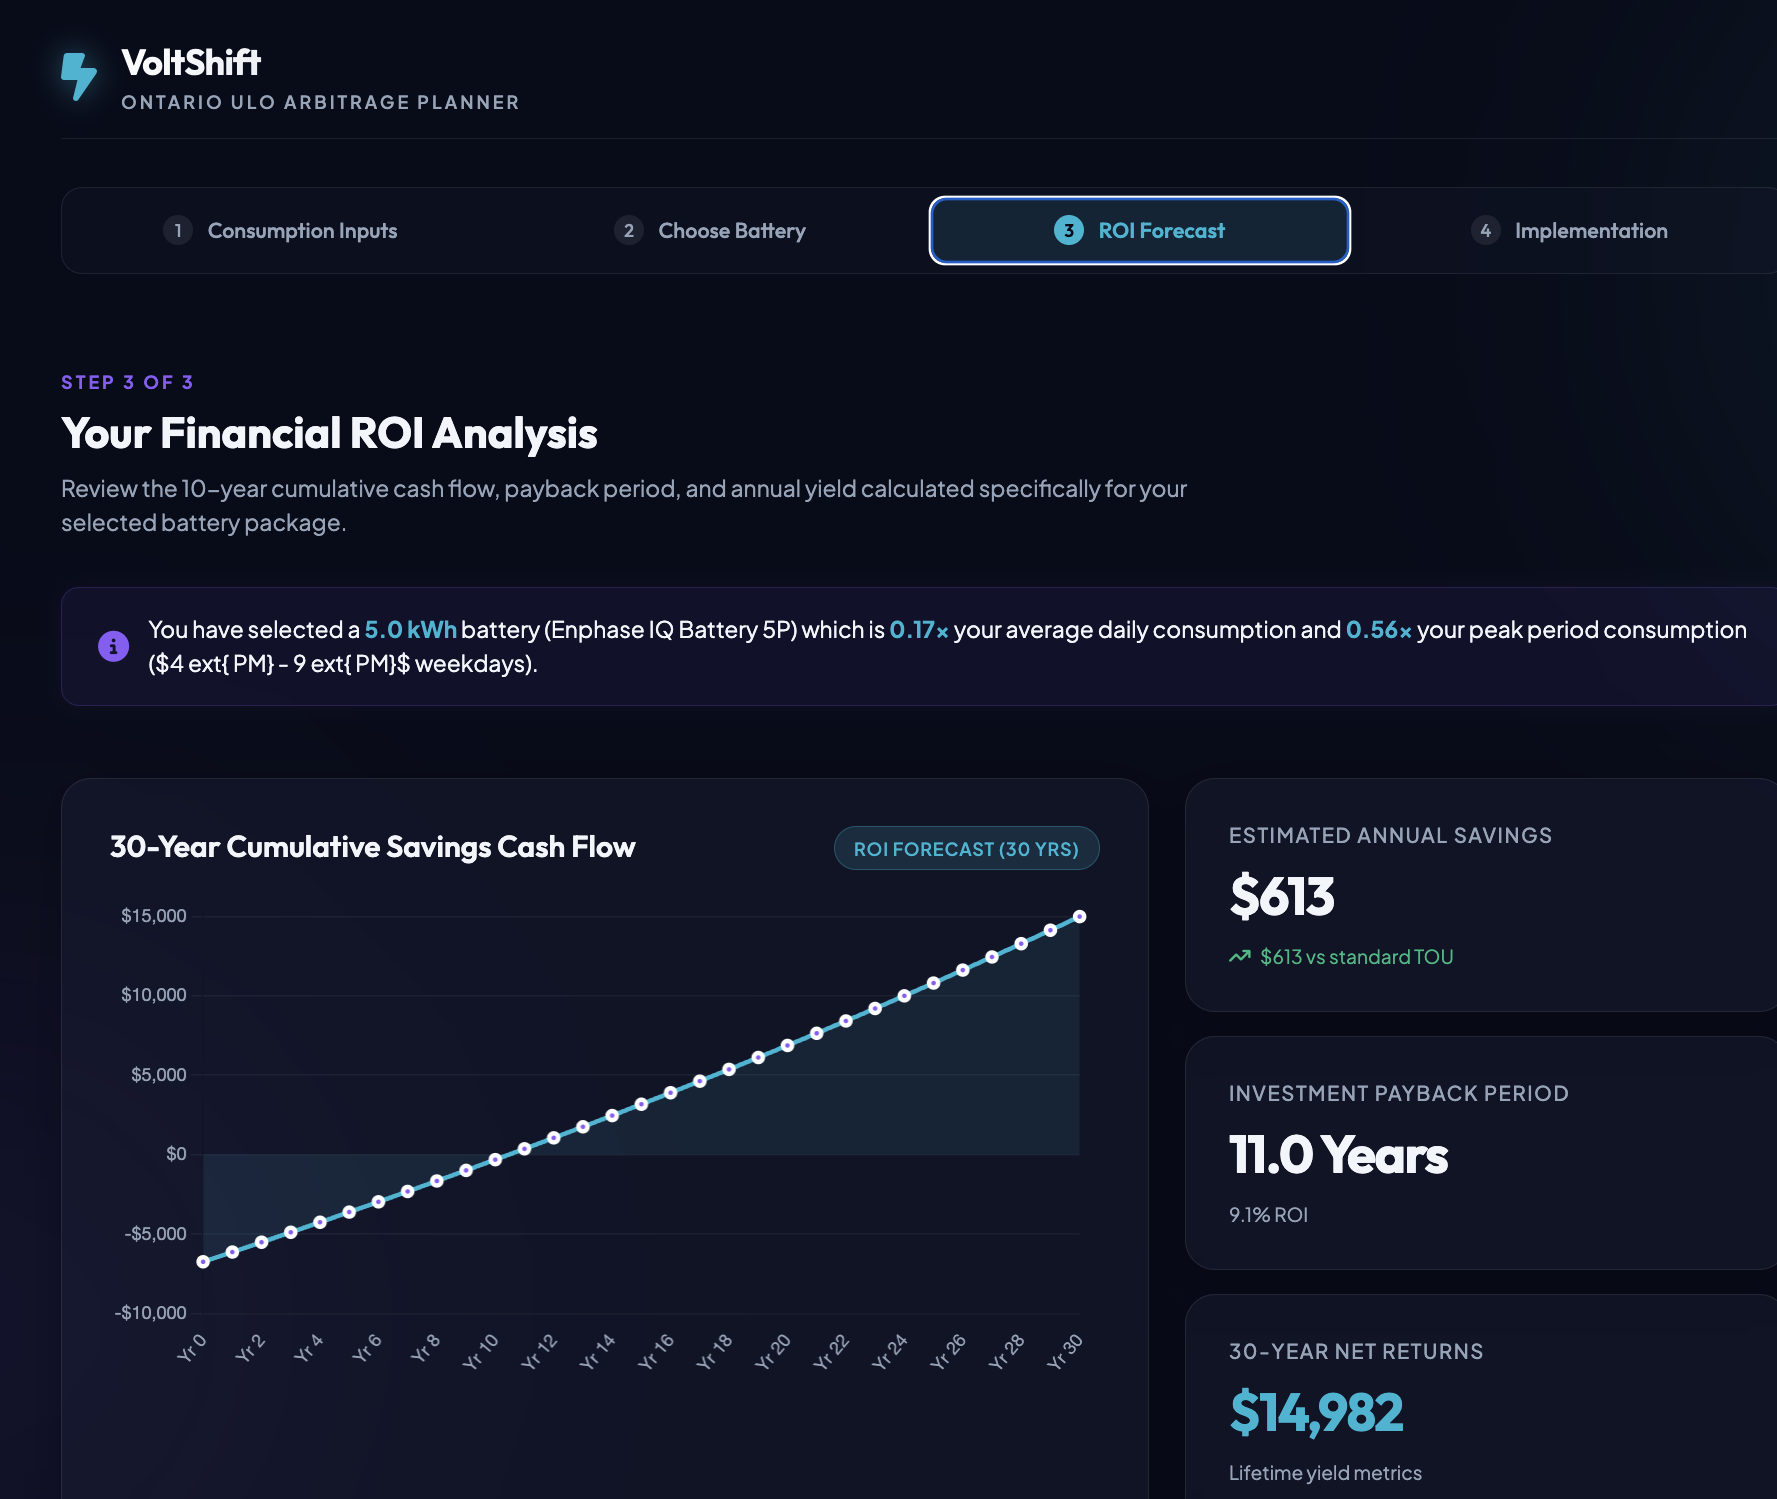
ROI calculator
-
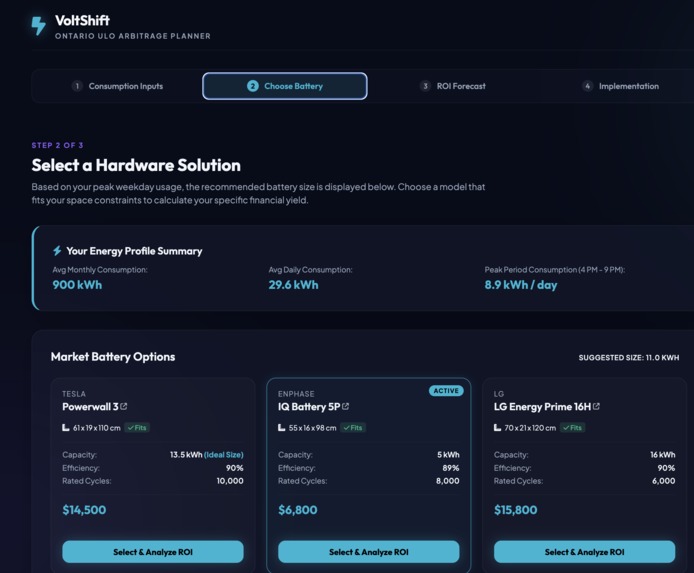
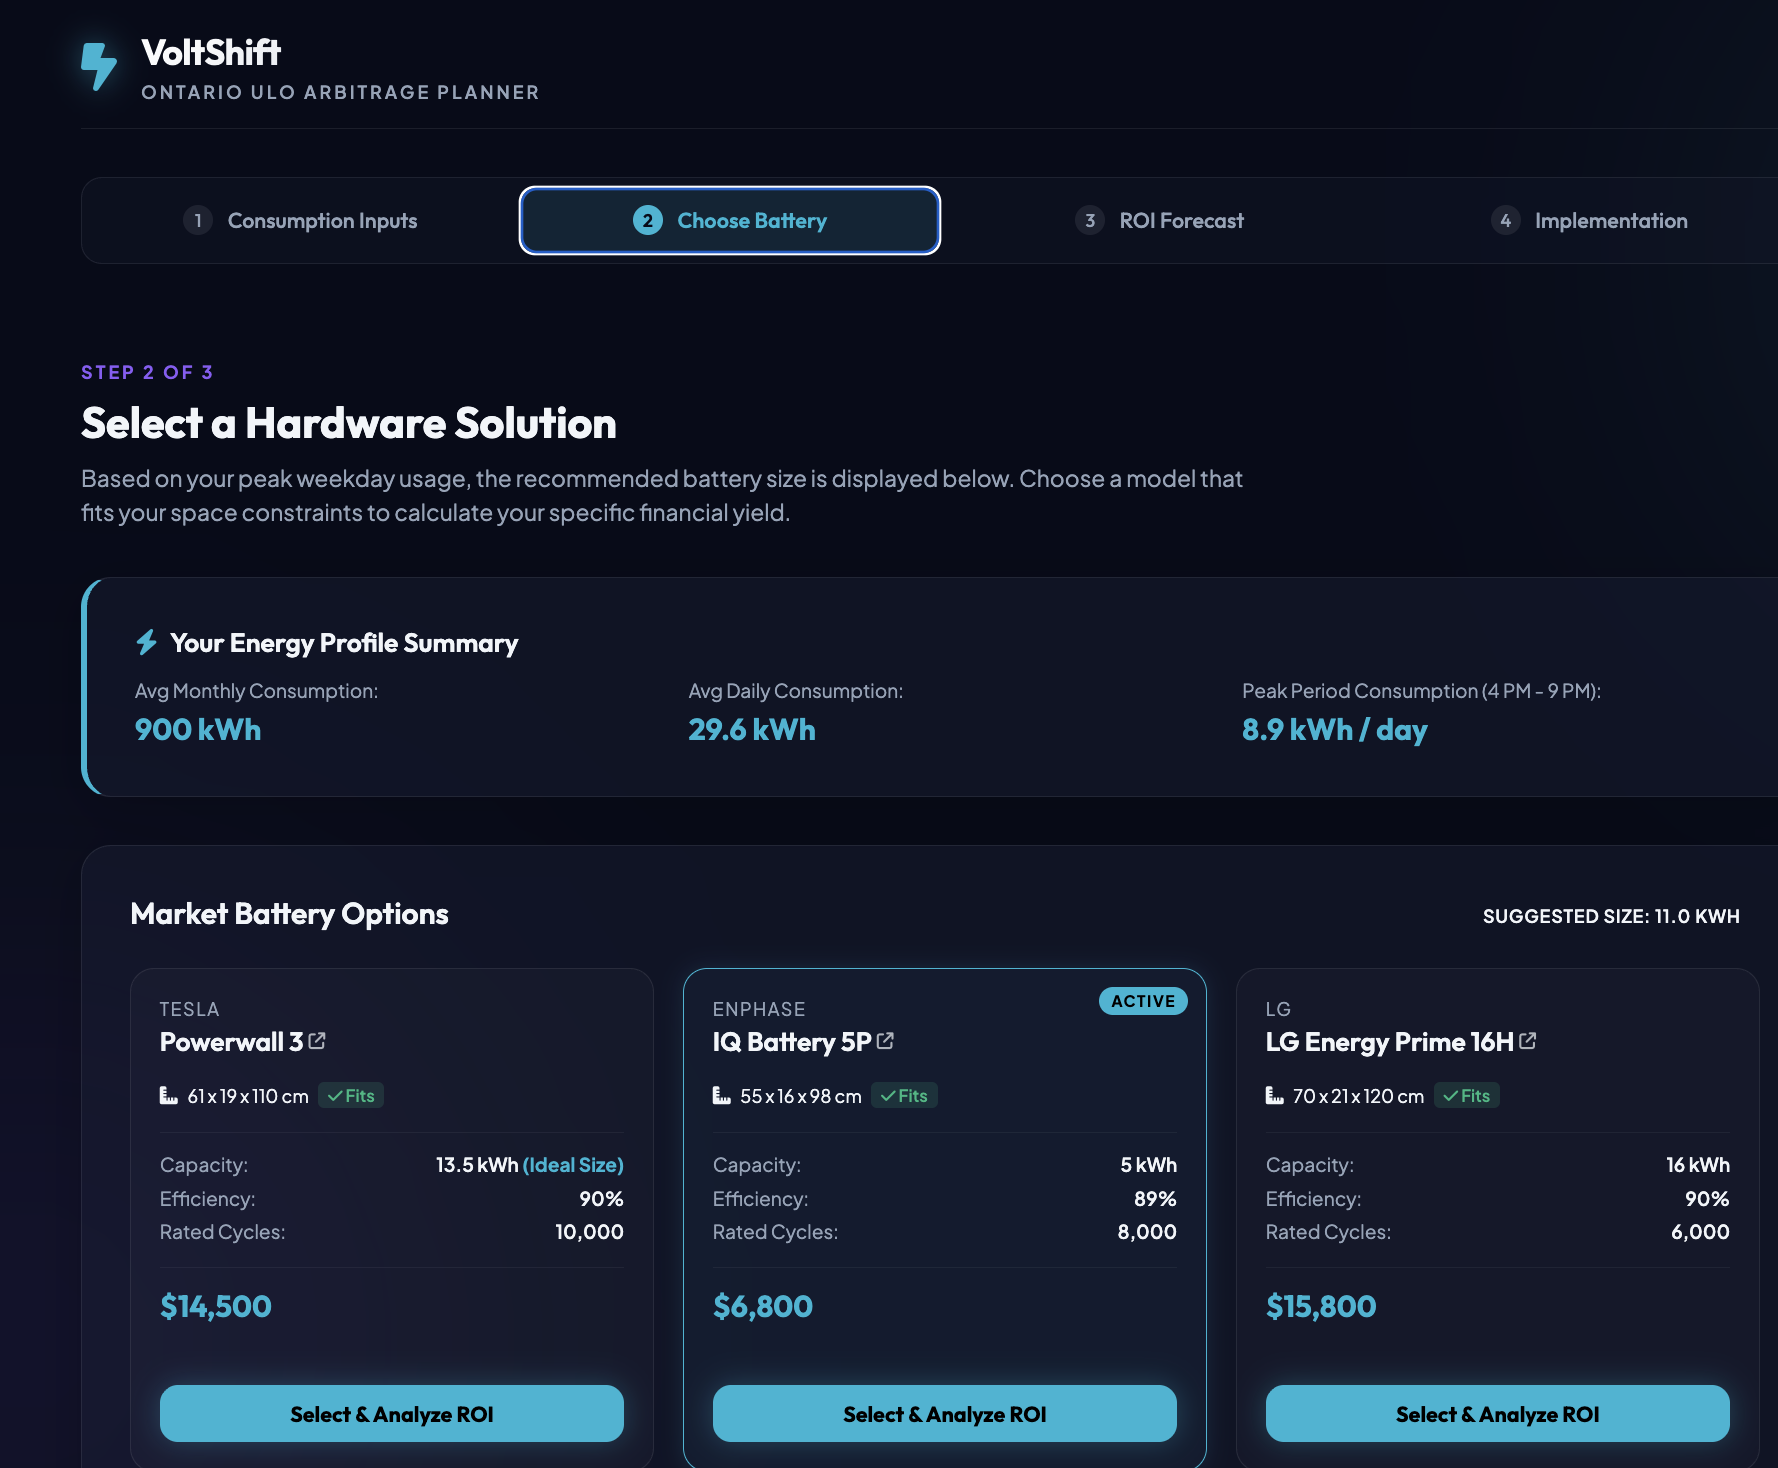
battery recommendation
-
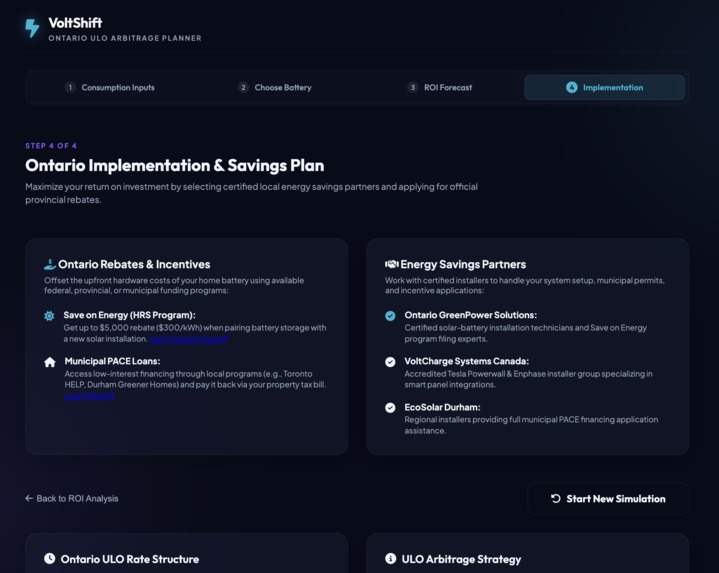
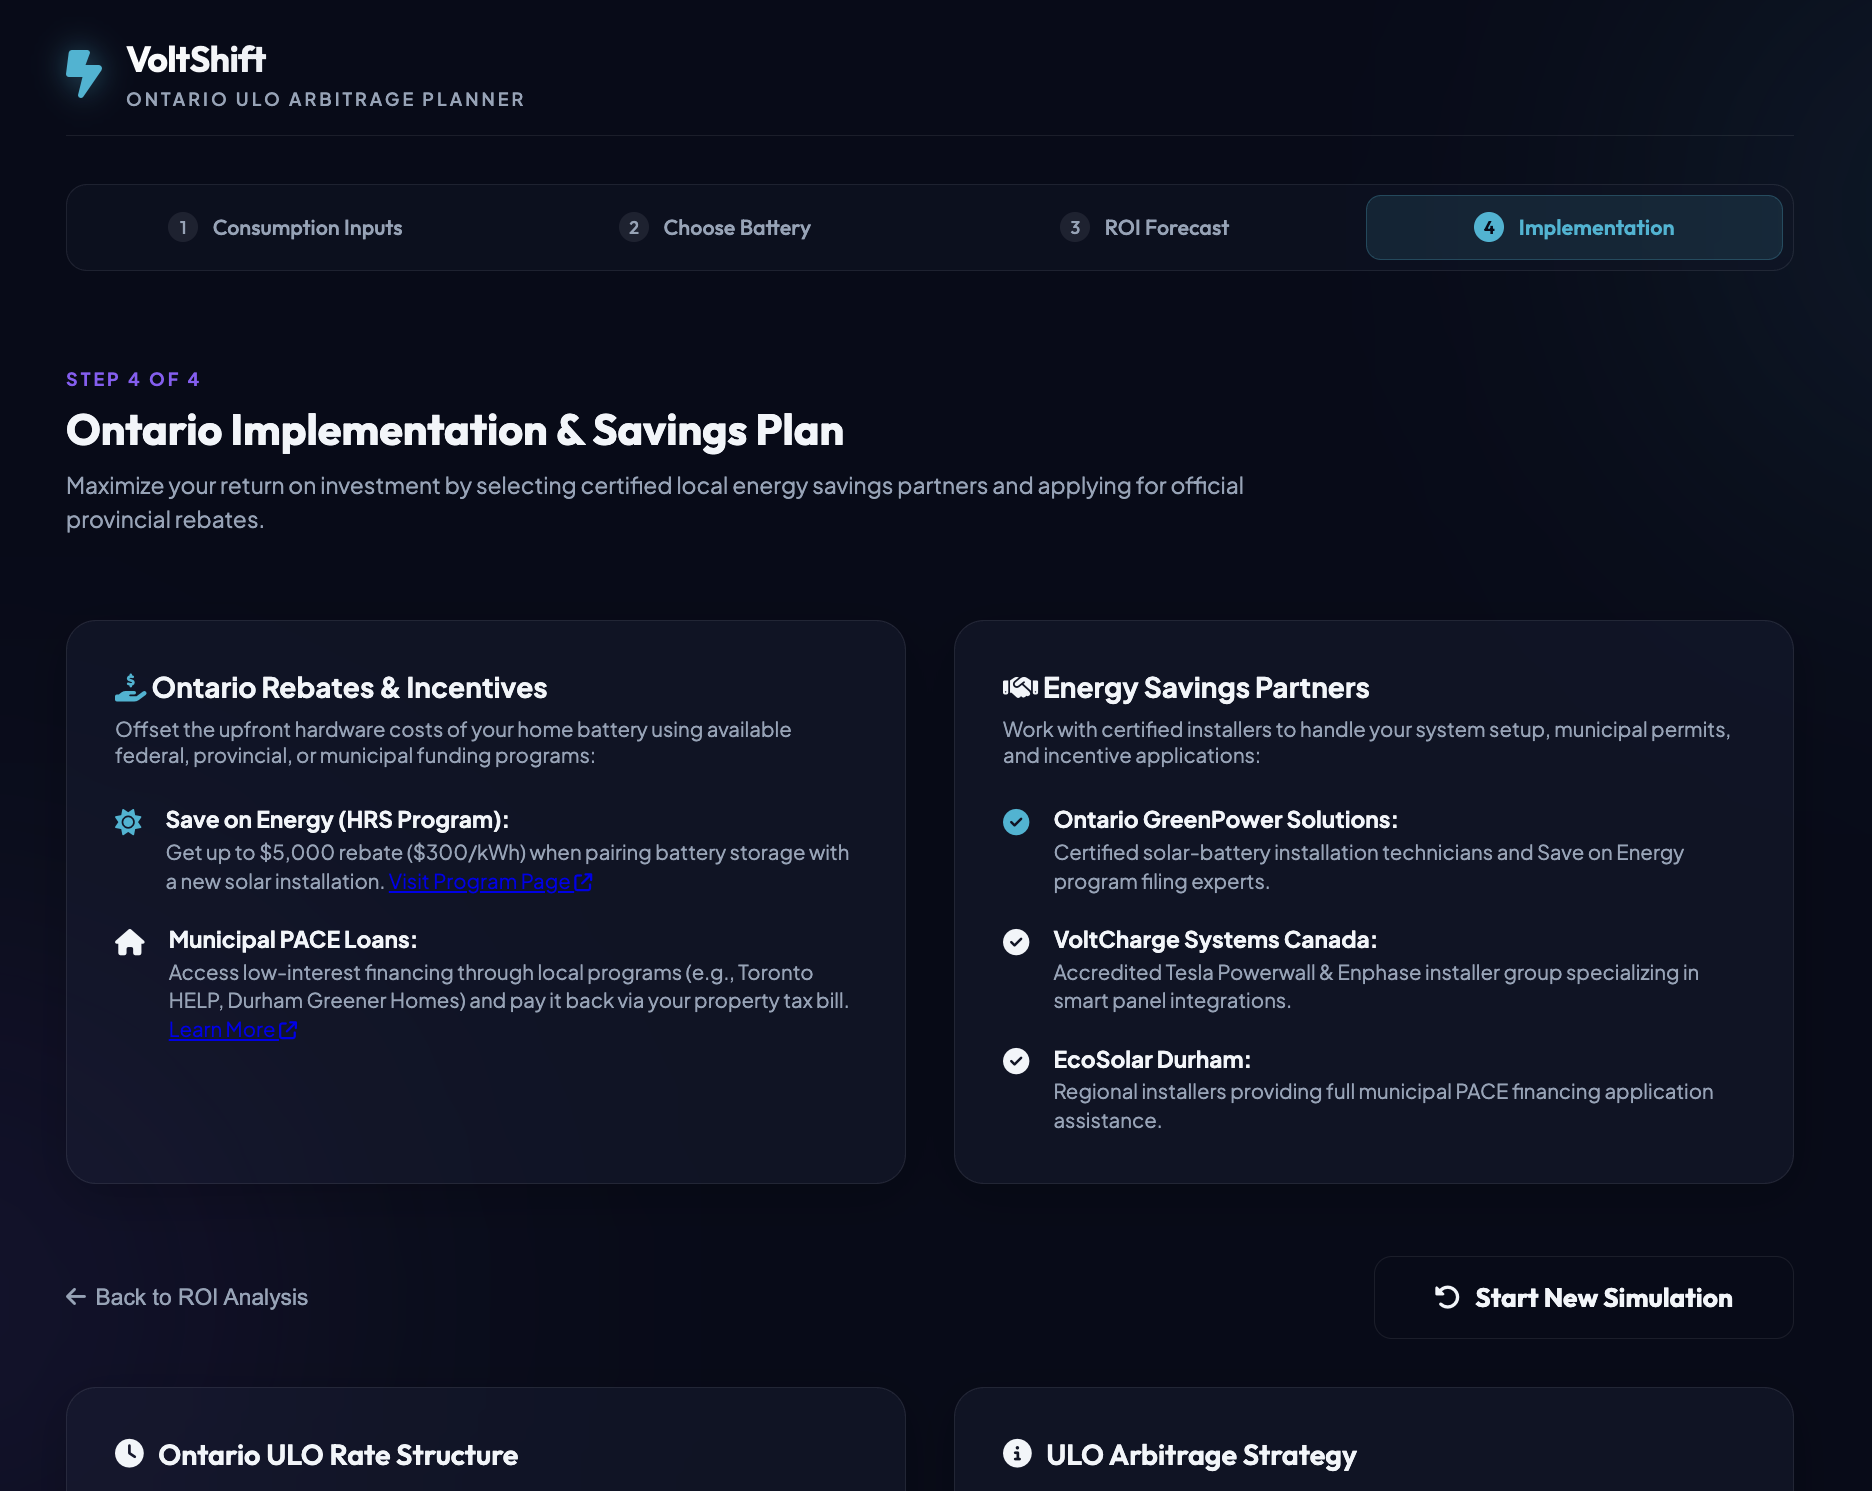
act on implementation
VoltShift Ontario is an interactive, premium web calculator designed to help Ontario homeowners evaluate the financial and physical feasibility of home battery storage systems under the province's Ultra-Low Overnight (ULO) electricity rate plan.
By targeting the $10\times$ price difference between overnight charging rates ($3.9\text{ ¢/kWh}$) and peak weekday rates ($39.1\text{ ¢/kWh}$), the app guides users through a clean, 4-step glassmorphic wizard:
- Consumption Inputs: Analyzes monthly consumption and physical space constraints.
- Battery Sizing: Recommends optimal market battery systems (e.g., Tesla Powerwall, Enphase IQ) based on space limitations and energy needs.
- ROI Projections: Delivers an interactive 30-year cash flow chart incorporating grid inflation, EV charging habits, and battery degradation.
- Implementation: Guides users on available local rebates and certified installation partners to take the project live. ## InspirationHere is a complete, formatted Project Story in Markdown with LaTeX equations that you can copy and paste directly into your project page:
# The VoltShift Ontario Story

## Inspiration
With the introduction of Ontario’s Ultra-Low Overnight (ULO) rate plan, residential electricity pricing became highly polarized. While weekday peak hours cost a steep $39.1\text{ ¢/kWh}$, overnight power drops to a mere $3.9\text{ ¢/kWh}$.

This massive $10\times$ price differential presented a perfect opportunity for home energy arbitrage. However, we noticed that most homeowners had no easy way to figure out if investing in a home battery (like a Tesla Powerwall or Enphase IQ) actually made financial sense for their specific consumption patterns and physical space. We built **VoltShift Ontario** to bridge this gap, offering a transparent, premium planning wizard to guide users from utility bills to a solid ROI forecast.

---

## How We Built It
VoltShift is built as a highly responsive, modern client-side web application leveraging:
- **Vanilla HTML5 & CSS3** with a premium glassmorphic interface, dynamic gradients, and smooth transition steps.
- **Chart.js** to generate interactive 30-year cumulative cash flow projections.
- **Node.js** for a lightweight development server environment.

### The Arbitrage Math
At the heart of the application is our financial modeling engine. For weekday peak periods, the daily net arbitrage savings $S_{\text{daily}}$ is calculated using:

\[
S_{\text{daily}} = E_{\text{discharge}} \cdot R_{\text{on-peak}} - \left( \frac{E_{\text{discharge}}}{\eta} \cdot R_{\text{overnight}} \right)
\]

Where:
- \(E_{\text{discharge}}\) is the usable battery energy discharged daily to offset peak usage (capped at the home's peak window consumption).
- \(R_{\text{on-peak}} = \$0.391/\text{kWh}\) is the weekday on-peak rate.
- \(R_{\text{overnight}} = \$0.039/\text{kWh}\) is the overnight charging rate.
- \(\eta\) is the round-trip efficiency of the battery system (e.g., \(90\%\)).

To model long-term returns, the wizard calculates 30-year projections with a standard $2.5\%$ annual utility inflation rate compounded against a user-defined annual battery capacity degradation rate $d$:

\[
\text{Savings}_{\text{year } t} = S_{\text{annual}} \cdot (1 - d)^{t-1} \cdot (1.025)^{t-1}
\]

---

## Challenges We Faced
1. **Accurate Consumption Modeling:** Homeowners rarely know their exact hourly load distribution. We tackled this by mapping average monthly bills to typical residential load profiles, reconstructing daily peak curves to estimate optimal battery capacity bounds.
2. **Physical Fit Constraints:** A battery might make financial sense but physically not fit in a narrow utility closet or garage. We integrated a hardware database check comparing available space metrics (width, depth, height) against real-world specs of top market models.

---

## What We Learned
We learned how sensitive battery payback periods are to minor efficiency changes and hardware degradation. A small drop in round-trip efficiency (\(\eta\)) or a slightly higher degradation rate (\(d\)) can shift a system’s payback period by several years. Providing homeowners with fine-tuning control over these specific parameters is key to building trust in residential green-energy forecasting.
What's next for VoltShift Ontario
Here is a look at what is next for VoltShift Ontario:
* **Real OCR Bill Scanning:** Upgrade the current simulated bill scanner to use a real computer vision API (like Tesseract.js or Google Cloud Vision) to let users upload photos of their utility bills and instantly extract exact monthly kWh consumption.
* **Green Button API Integration:** Connect directly to Ontario utilities (such as Hydro One, Toronto Hydro, and Alectra) using standard Green Button data portals to pull down real-world, hourly historical consumption data for 100% accurate savings simulations.
* **Solar Panel Pairing Model:** Add support for solar generation inputs, allowing users to calculate optimal hybrid arbitrage systems where the battery is charged via solar energy first, and grid energy second.
* **Smart Home Automation Export:** Generate integration profiles (e.g., YAML configurations) for Home Assistant or other smart home controllers, allowing users to automatically trigger charging/discharging cycles based on real-time ULO rates.

Log in or sign up for Devpost to join the conversation.