Inspiration
We showed up planning to build an ALS pre-screener with an EEG headband and a throat mic. The EEG band stayed at home and the throat sensor never showed up, so we had to ask a simpler question: how much can you learn from a voice recording alone?
That question turned out to matter. Stroke, Parkinson's, cerebral palsy, brain injury and ALS can all change how someone speaks, and speech is often one of the first things to change. In ALS the median wait from first symptom to diagnosis is around a year, and that's in countries with plenty of neurologists. Low-income countries have up to 82 times fewer neurologists per person. Most people who need a specialist won't see one soon, but almost all of them have a phone.
The voice tools we looked at give you one number that says speech changed. A clinician needs to know where. Is it the lips, the tongue, the voice box? And how hard is this person to understand? That's what we set out to build.
Two papers got us going: diffTLM from MIT, a differentiable physics model of the vocal tract, and TRIBE v2 from Meta, a model that predicts how the human brain responds to sights and sounds. Neither was built for clinical speech. We wanted to see if they could work for it.
What it does
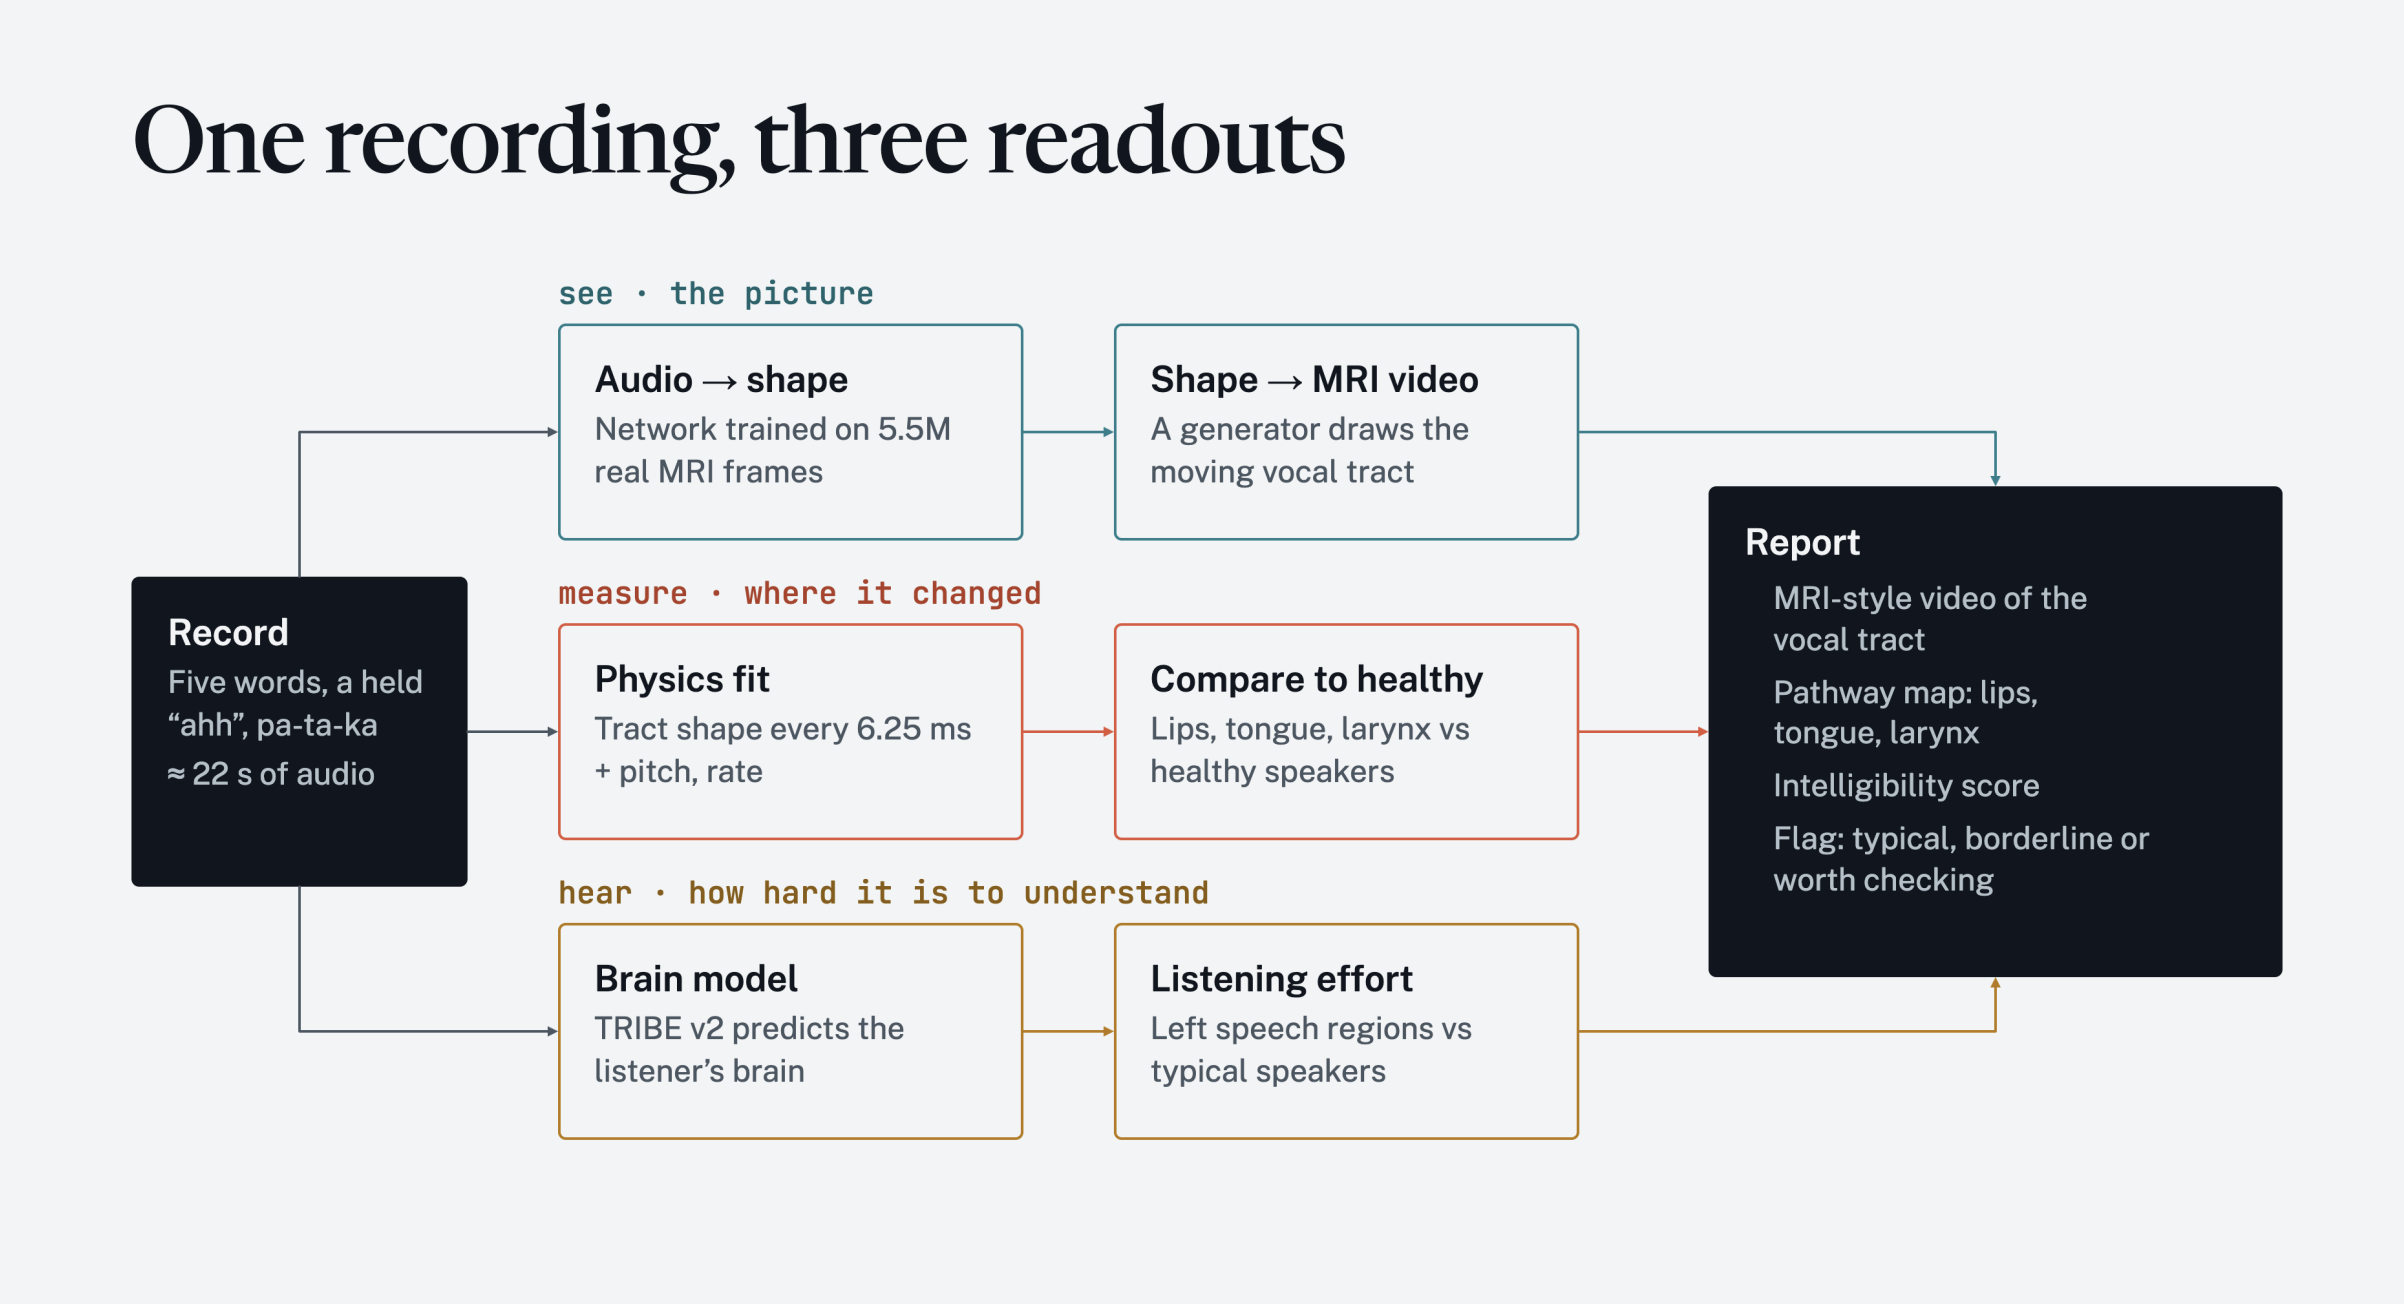
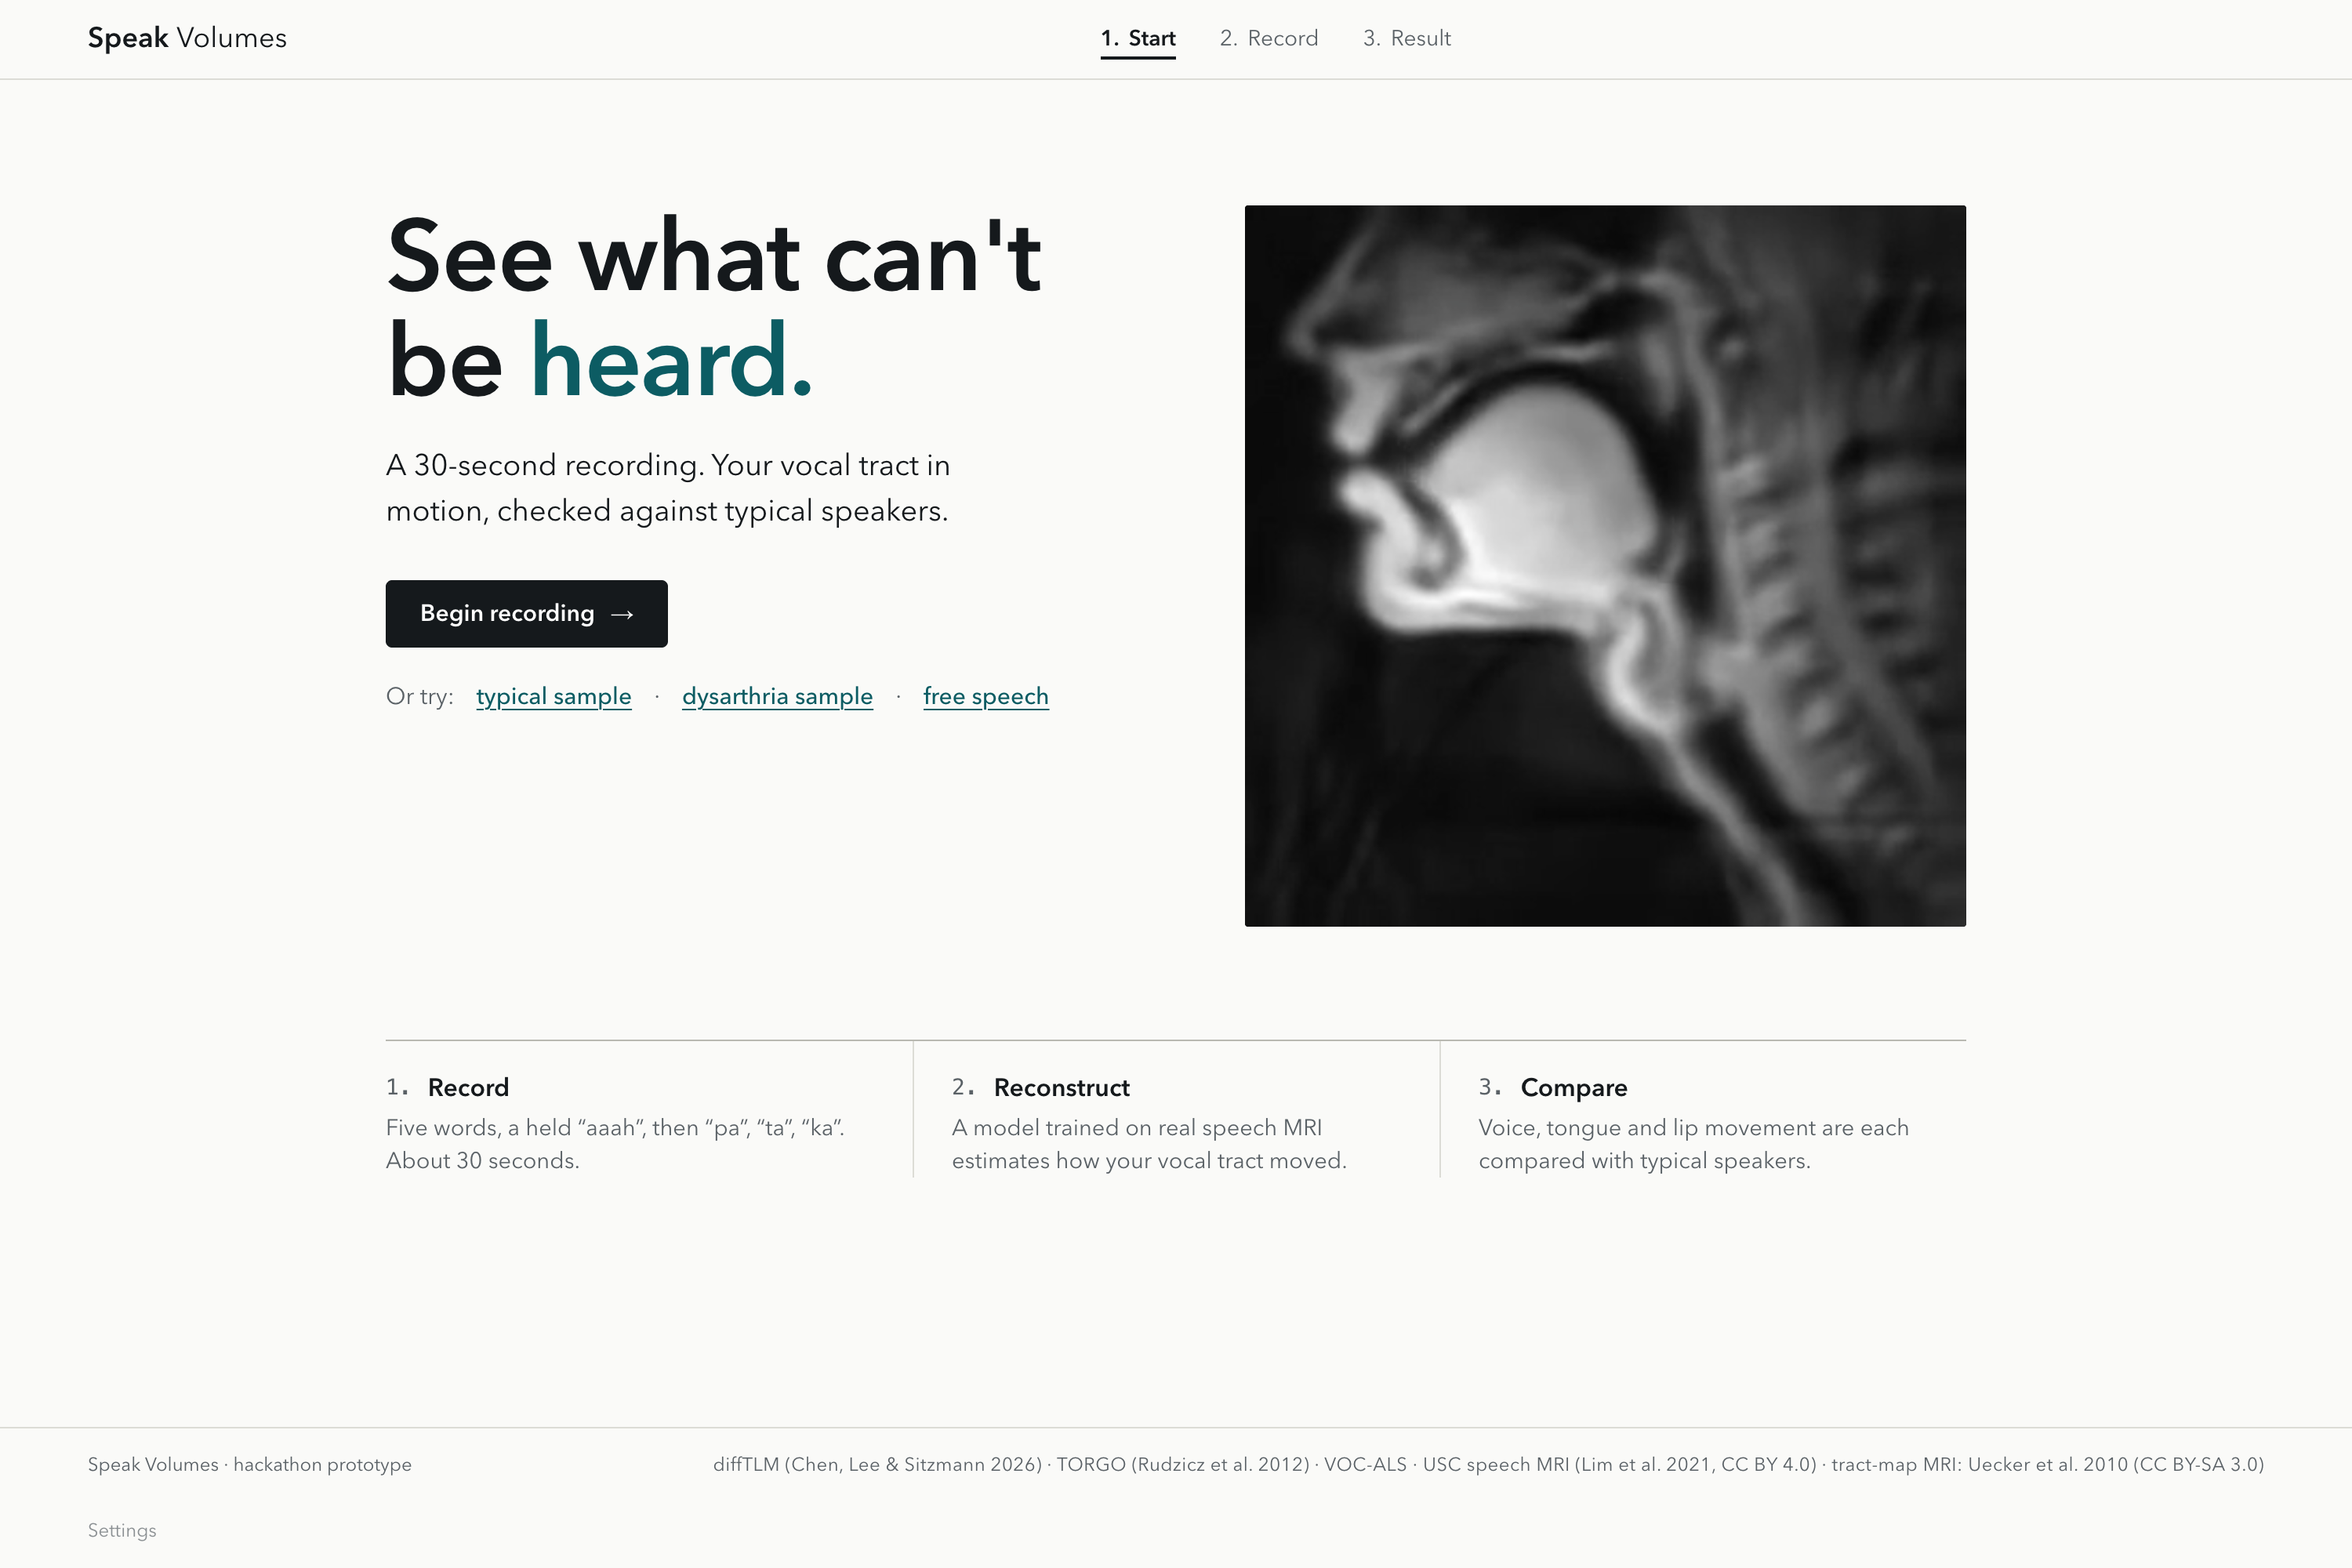
You record about 20 seconds: five short words, a held "ahh", then pa-pa-pa, ta-ta-ta and ka-ka-ka. Speak Volumes gives you three things back.
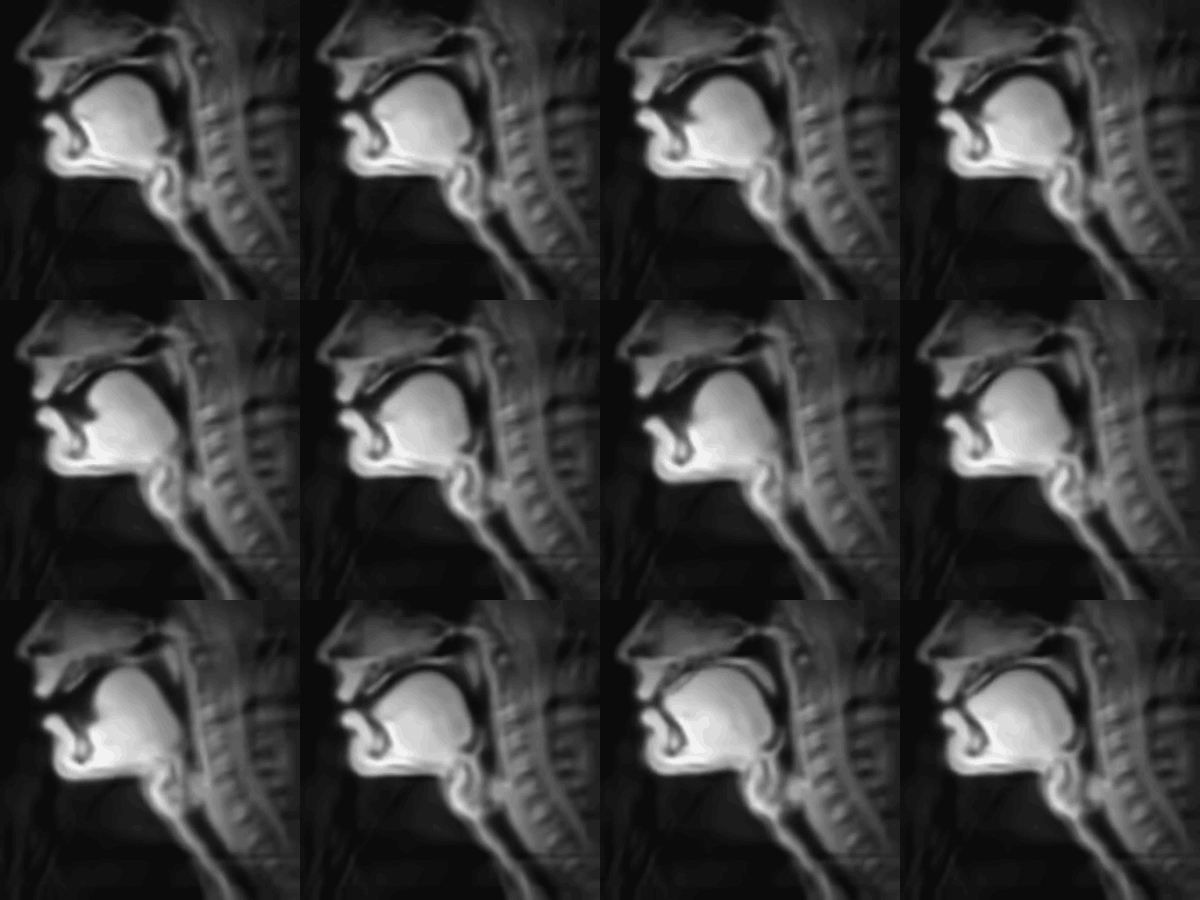
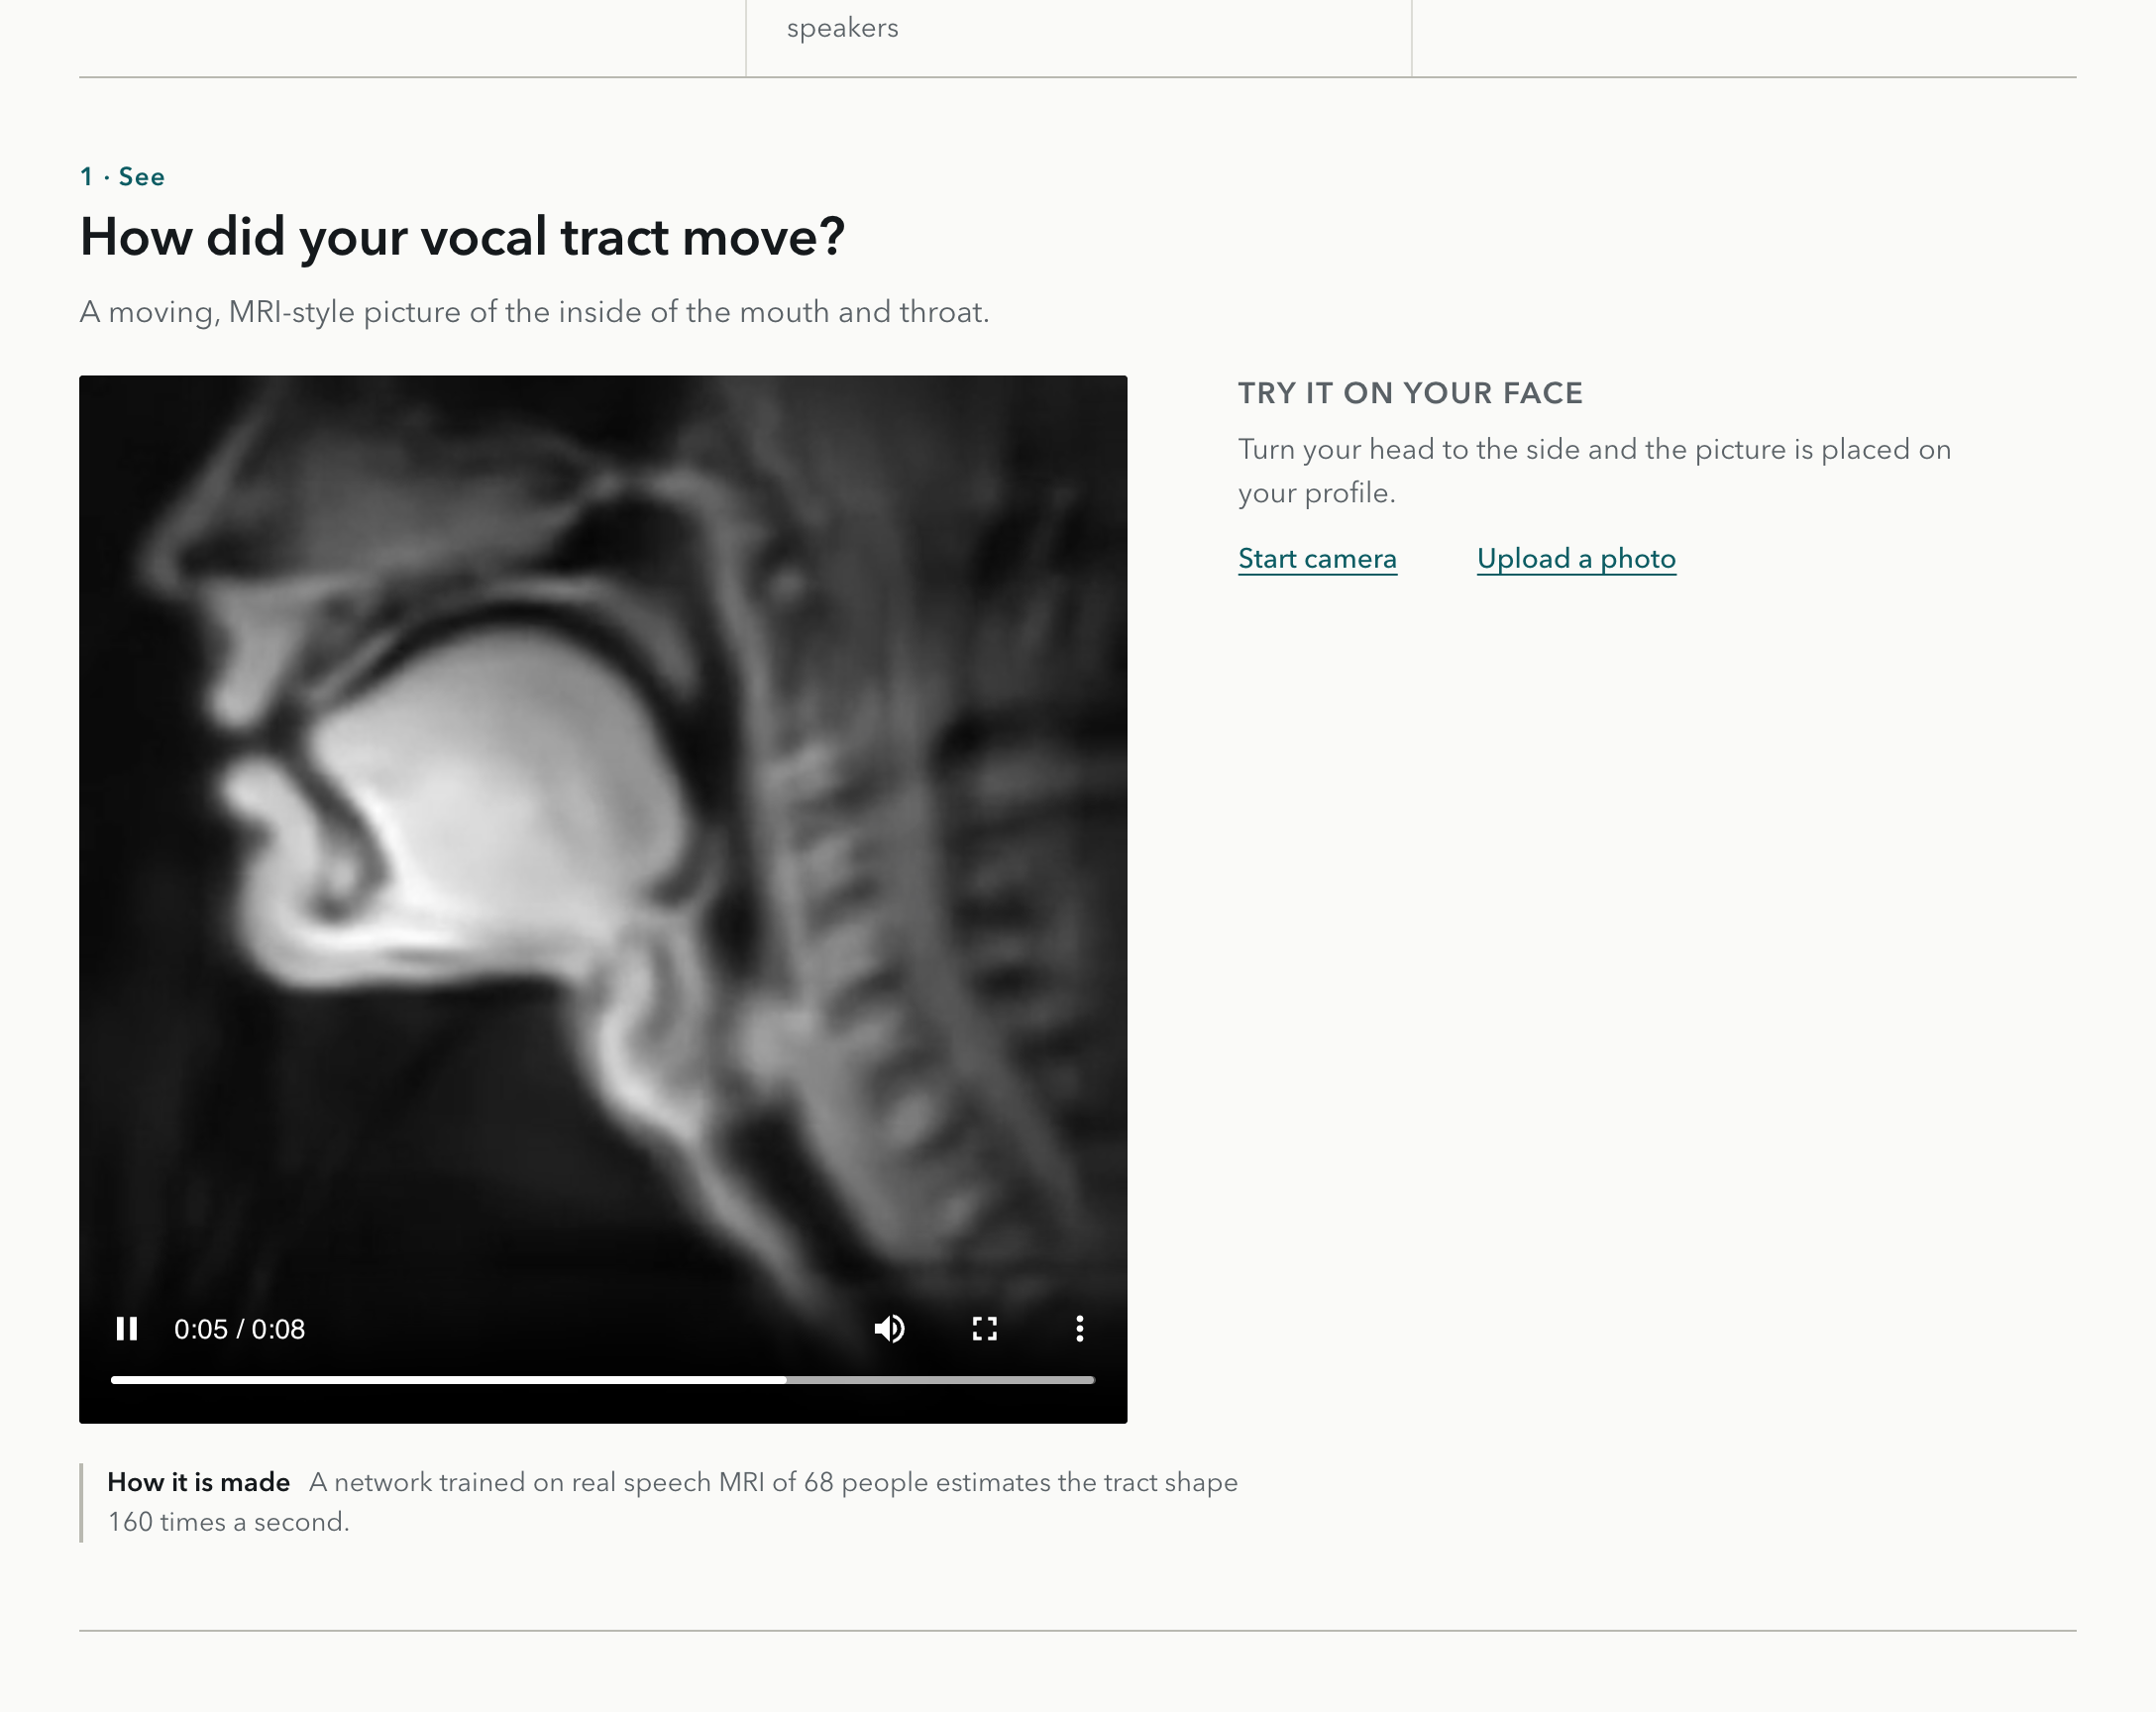
- See. A moving MRI-style video of a vocal tract rebuilt from your audio, with the airway colored green, amber or red by how far each part moved from typical speakers.
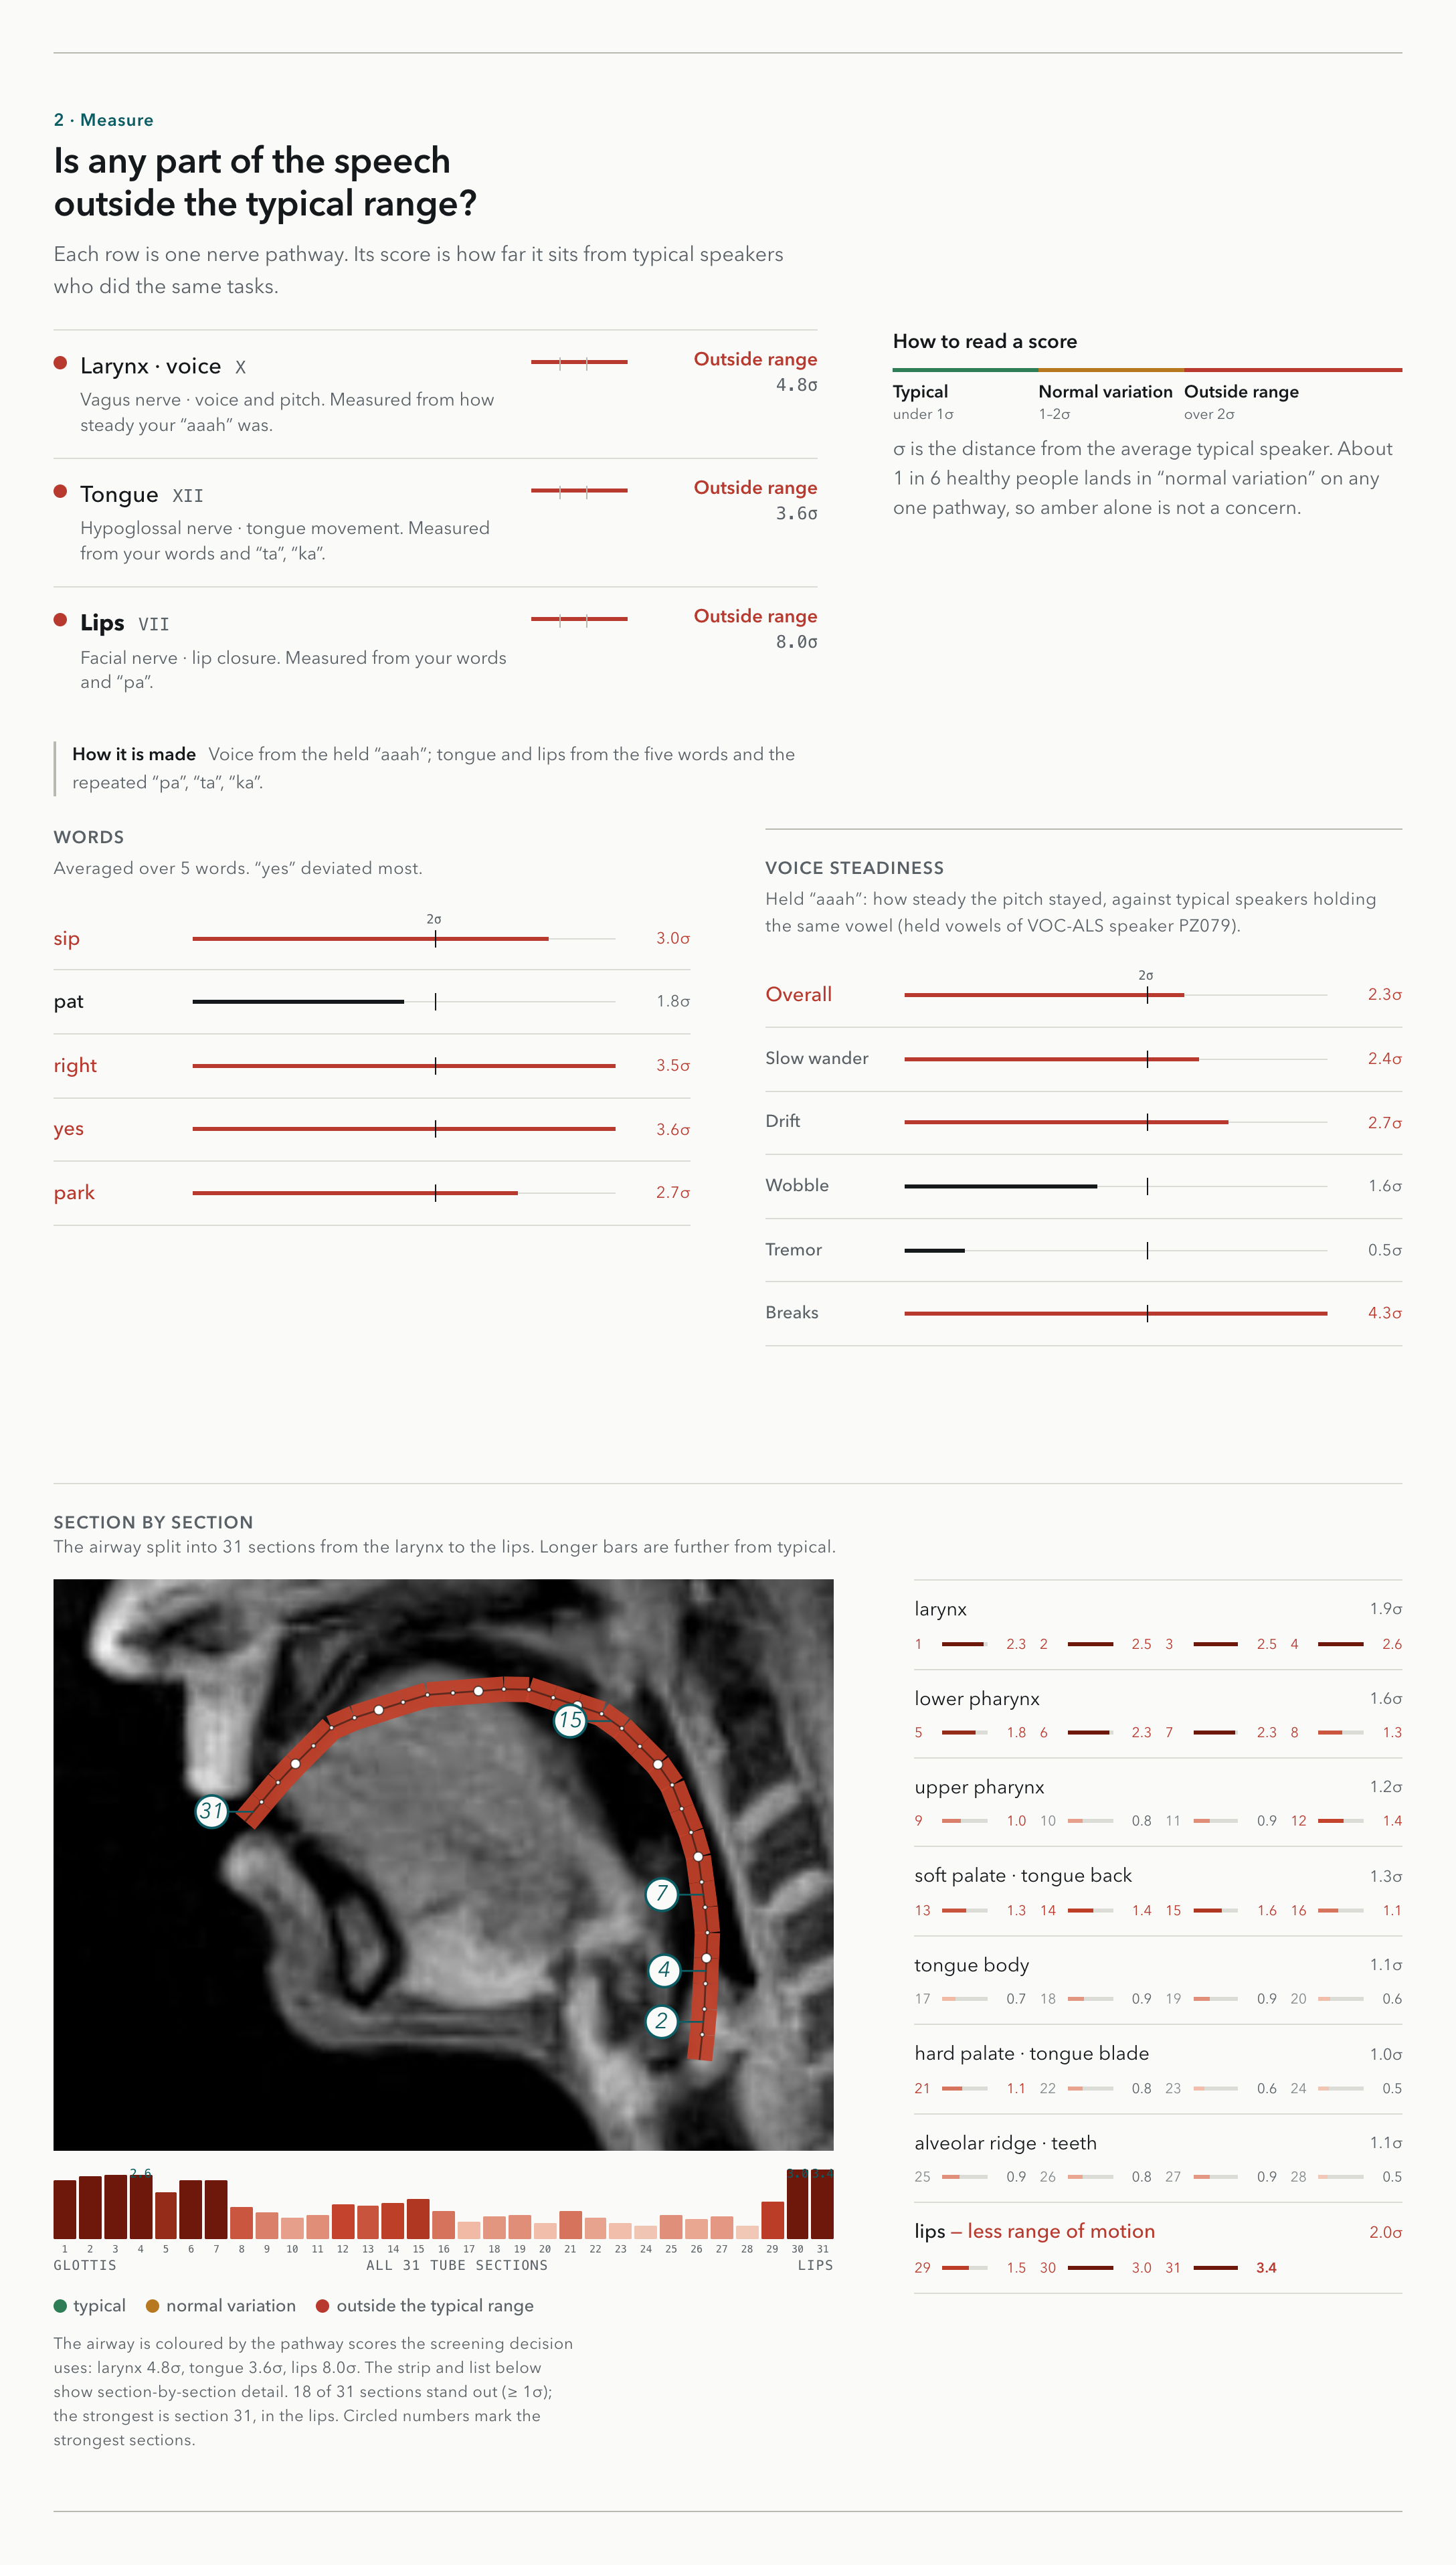
- Measure. A score for each pathway (lips, tongue, larynx), each tied to the cranial nerve that drives it (VII, XII and X), plus a flag: typical, borderline or worth checking.
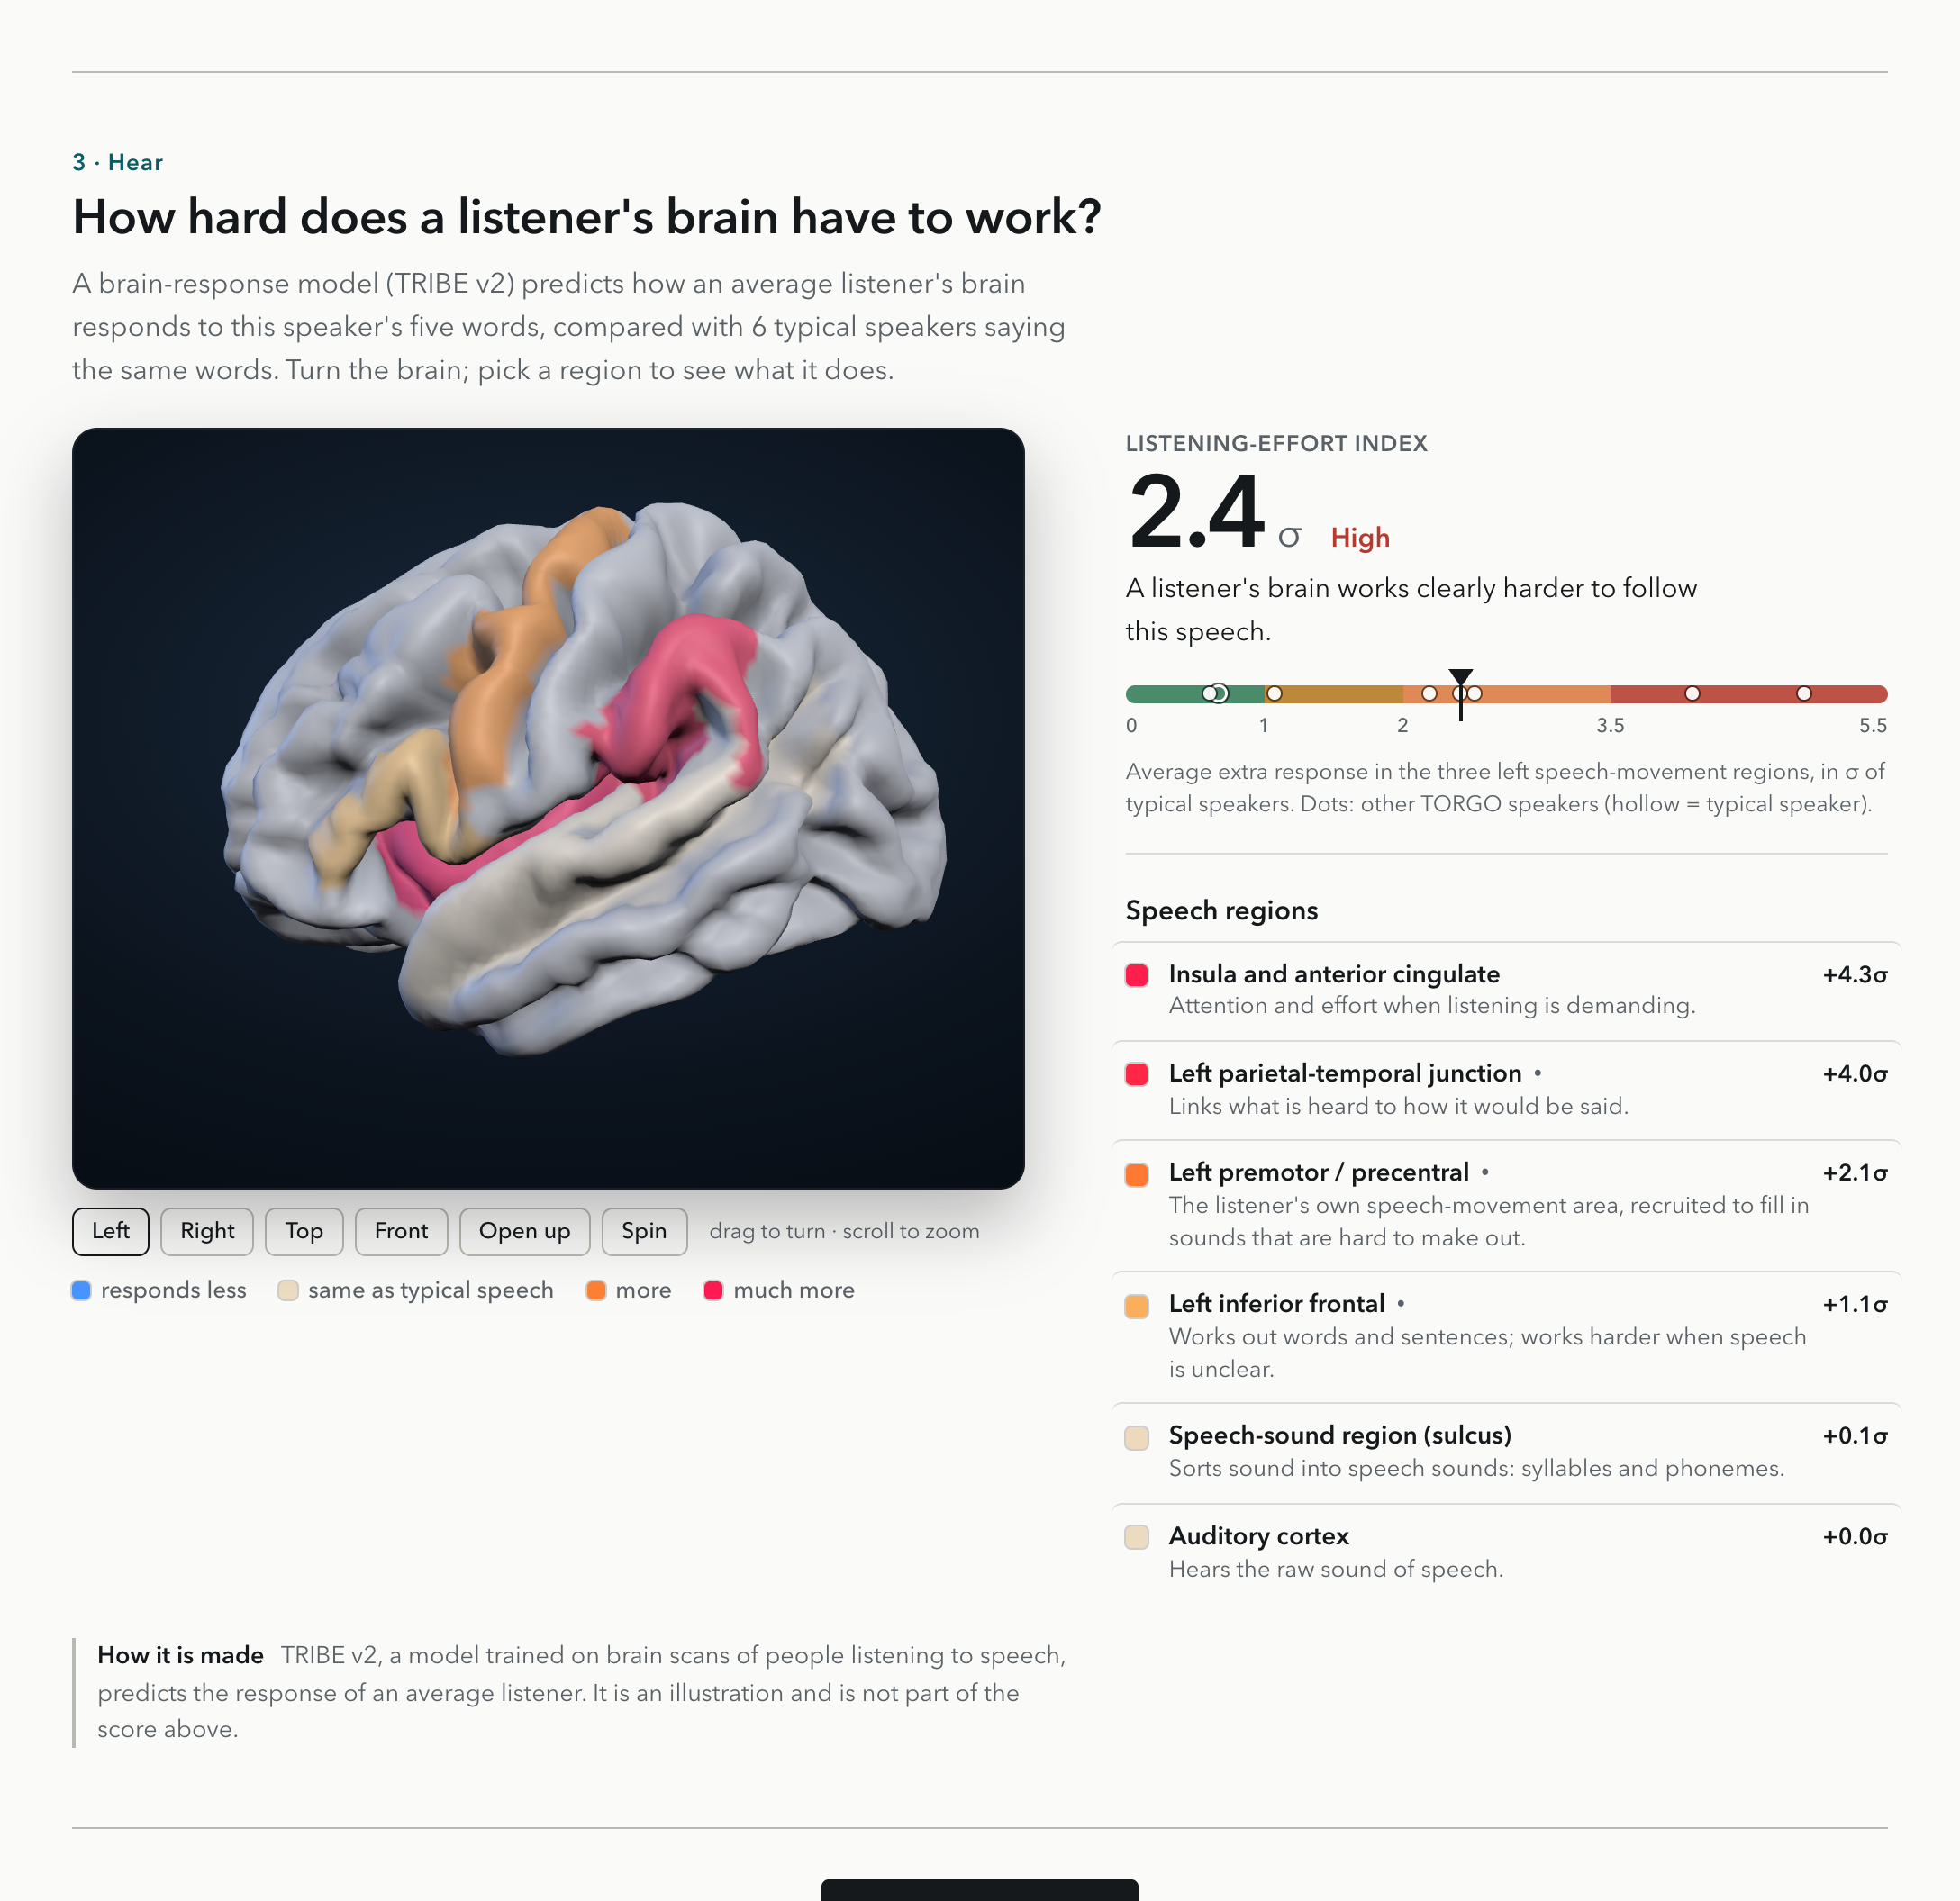
- Hear. An intelligibility score: how hard a listener's brain is predicted to work to understand you.
It's a pre-screen, not a diagnosis. The point is to tell someone whether, and where, to get looked at.
How we built it
The picture. We trained an audio-to-vocal-tract network with a WavLM front end on the USC 75-speaker real-time MRI dataset, which has about 5.5 million MRI frames. We trained on 64 speakers and held out 4. The network predicts the shape of the tract over time, and a CNN generator turns that shape into MRI frames. On a held-out speaker, the generated movement matches the real scan at 0.73.
The measurements. For each recording we fit diffTLM from scratch on Modal GPUs. It models the tract as 32 tube sections and fits them every 6.25 ms. We add pitch features from the held vowel and syllable rate from the pa-ta-ka tasks, aligned with the Montreal Forced Aligner. Each feature is z-scored against healthy speakers saying the same thing, then grouped by pathway. A pathway past $2\sigma$ gets flagged.
We tested on two datasets: TORGO (English speakers with dysarthria) and VOC-ALS (Italian speakers with ALS). Every number comes from leave-one-speaker-out evaluation, so the model never saw the person it was scoring, with bootstrap confidence intervals over speakers.
The intelligibility score. We run TRIBE v2's audio pathway on the recording, average the predicted response in six speech-related brain regions, and z-score each region against typical speakers saying the same five words. The score is the average extra effort in three left-hemisphere speech regions: inferior frontal, premotor, and the temporo-parietal junction.
$$E = \frac{1}{3}\sum_{r \in {\text{IFG},\ \text{PMC},\ \text{TPJ}}} \max(0,\ z_r)$$
To our knowledge, nobody has used a brain model to score intelligibility before.
Results.
- TORGO: 0.96 AUROC separating speakers with dysarthria from typical speakers. At our cut-off it flagged 7 of 8 speakers with dysarthria and 0 of 7 typical speakers. For 6 of 8, the most abnormal part was the tongue's range of motion.
- VOC-ALS: 0.84 AUROC for ALS speech changes, while clearing 96% of healthy speakers.
- Intelligibility: the score rises with clinical severity (Spearman $\rho = 0.72$ across TORGO speakers), and every severe speaker landed in the high-effort range.
The app is a web app with a Python server, the MRI video, the pathway readout, and a 3D brain you can rotate, colored by region.
Challenges we ran into
- No hardware. We lost the EEG and the throat mic on day one and rebuilt the whole plan around a microphone.
- Physics vs. pictures. We tried using diffTLM to refine the network's tract shapes. The audio matched better, but the shapes drifted away from real MRI (the match dropped from 0.76 to 0.41). So we split the jobs: the network draws, the physics measures.
- Held vowels don't move your tongue. VOC-ALS is mostly held vowels, where the tract barely moves, so the tract features had little to work with. That taught us what to record: words for the tract, a held vowel for the voice.
- Slow speech can fool you. Dysarthric speech is slower, and duration alone tracks severity. We kept checking that our features picked up more than speaking rate.
- Two very different datasets. English studio recordings against Italian phone audio at 8 kHz, with different tasks and different labels.
- Clean MRI frames. Raw predictions gave smeared frames, so we smooth the generator input over about 80 ms and soft-cap extreme values.
What we learned
What you ask someone to say matters as much as the model. A held "ahh" tells you about the voice and almost nothing about the tongue. We also learned that a model built for one job can measure something else entirely: a brain model made for neuroscience turned out to track how severe someone's speech is. And we learned to always test on speakers the model has never seen, because anything else looks great and means nothing.
Accomplishments that we're proud of
- It finds dysarthria. 0.96 AUROC separating speakers with dysarthria from typical speakers on TORGO. At our cut-off it flagged 7 of 8 speakers with dysarthria and 0 of 7 typical speakers, and the score rises with clinical severity (Spearman $\rho = 0.83$).
- It shows where. For 6 of 8 speakers with dysarthria, the most abnormal part was the same: the tongue's range of motion.
- It works on ALS too. 0.84 AUROC for ALS speech changes on VOC-ALS, while clearing 96% of healthy speakers.
- A new way to measure intelligibility. We took a brain model built for neuroscience and turned it into an intelligibility score. It rises with clinical severity ($\rho = 0.72$), and every severe speaker landed in the high-effort range. To our knowledge, nobody has used a brain model to score intelligibility before.
- A full pipeline in one weekend. From a phone recording to an MRI video, a nerve pathway map and a brain map, after losing our hardware on day one.
What we learned
What you ask someone to say matters as much as the model. A held "ahh" tells you about the voice and almost nothing about the tongue. We also learned that a model built for one job can measure something else entirely: a brain model made for neuroscience turned out to track how severe someone's speech is. And we learned to always test on speakers the model has never seen, because anything else looks great and means nothing.
What's next for Speak Volumes
- More English speech data, so the healthy reference covers more voices, ages and accents.
- A clinical partner to test it on people who haven't been diagnosed yet, which is where a pre-screen matters.
- The brain score on every live recording, not just on the samples.
- Monthly check-ins, so people and their doctors can see each part of their speech change over time.
- A phone app built for places without specialists, where it could be the first thing that listens.


