-
-
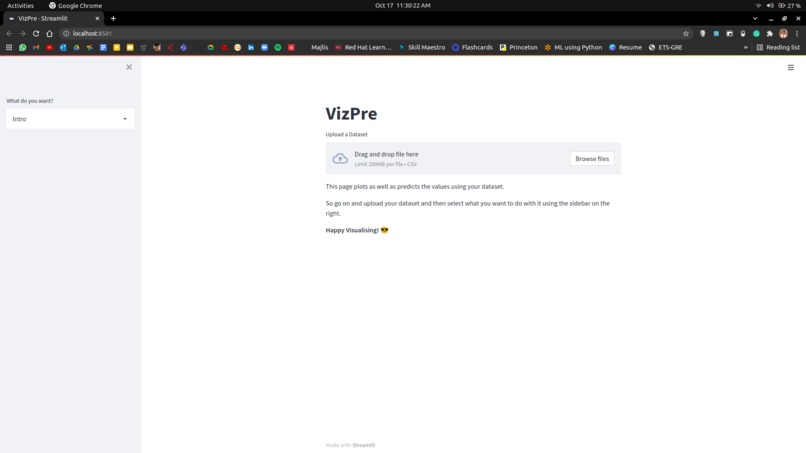
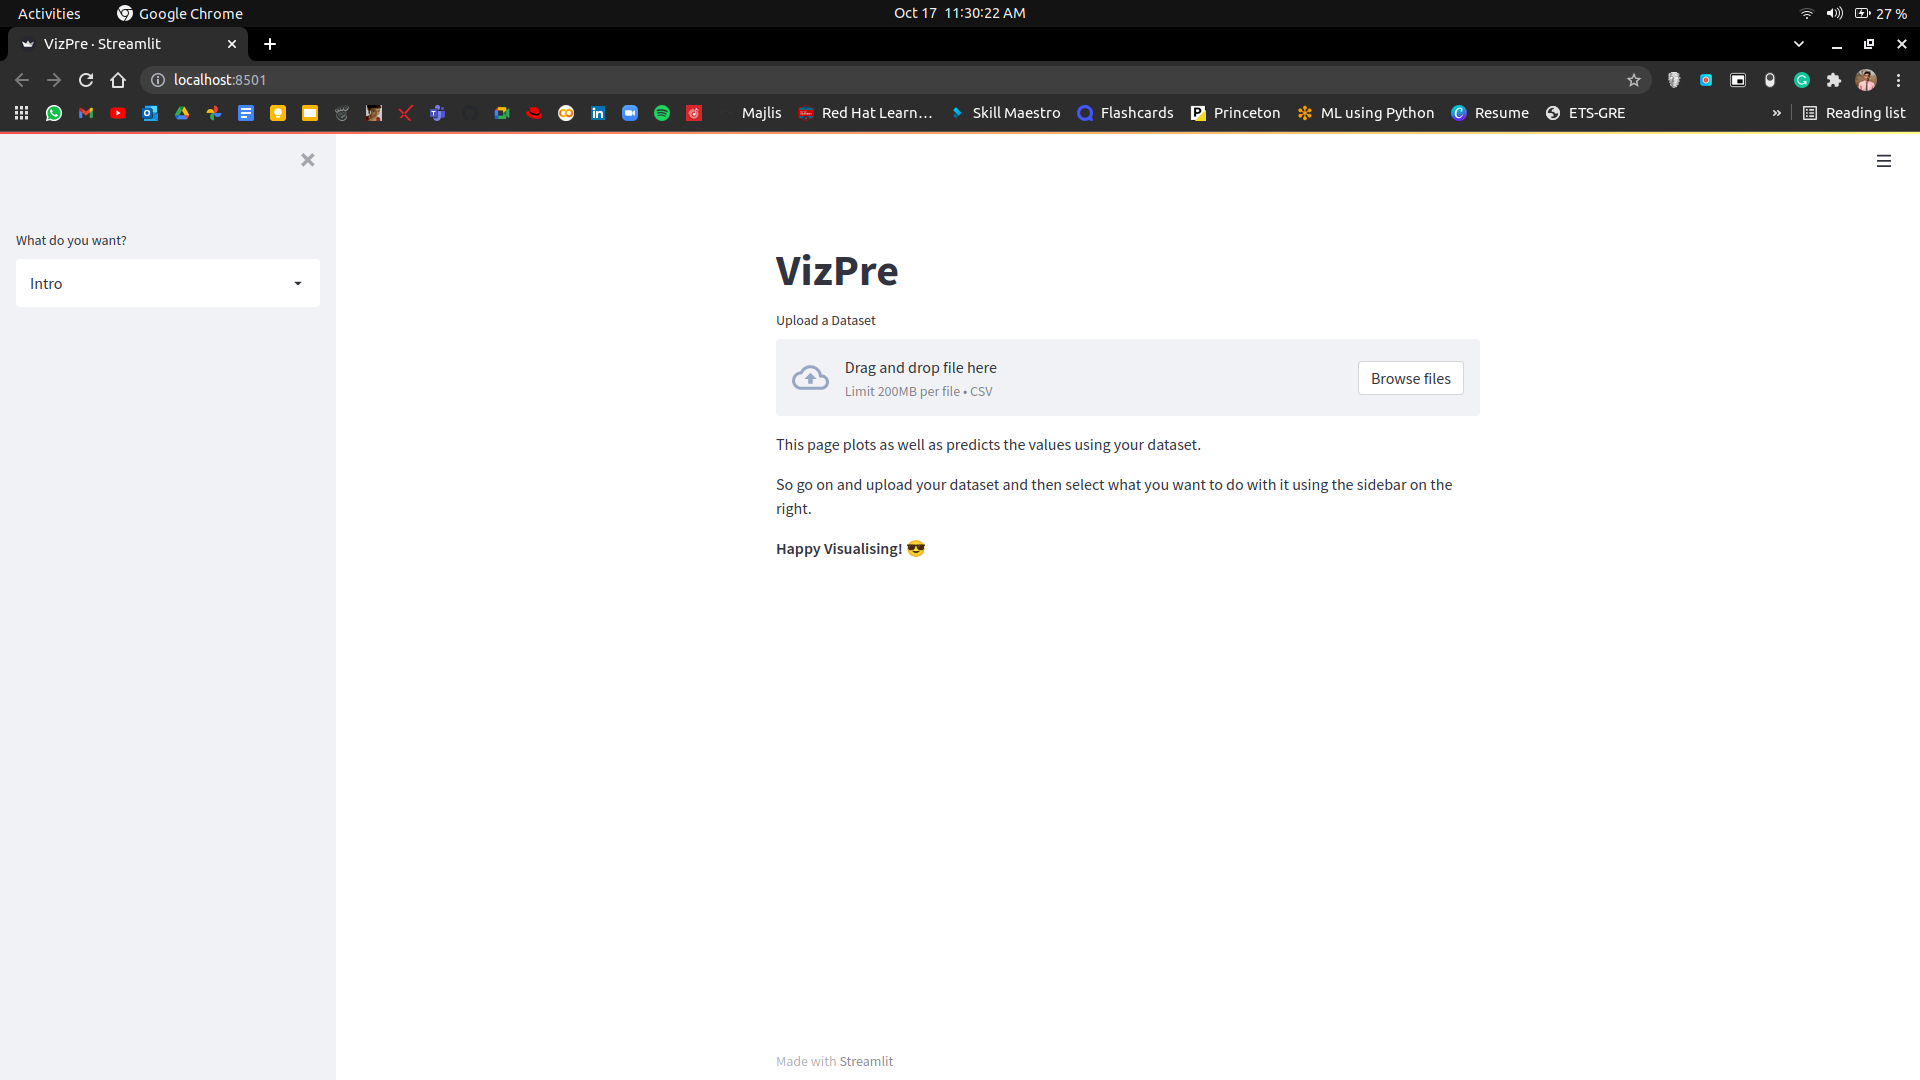
Home Page
-
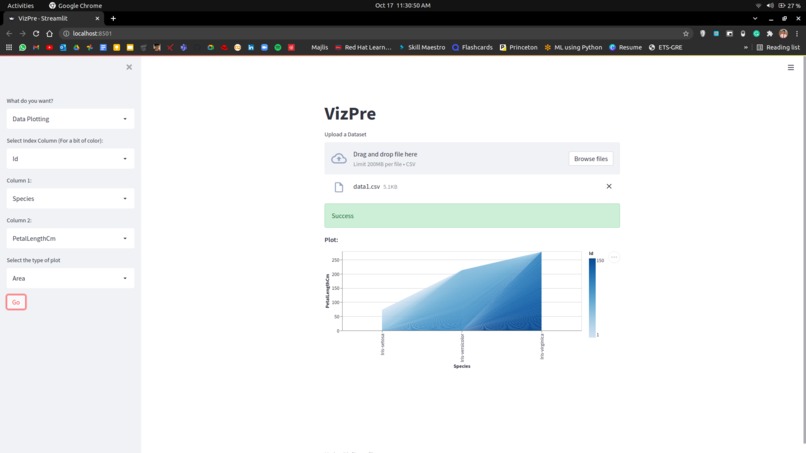
Data Plotting #2
-
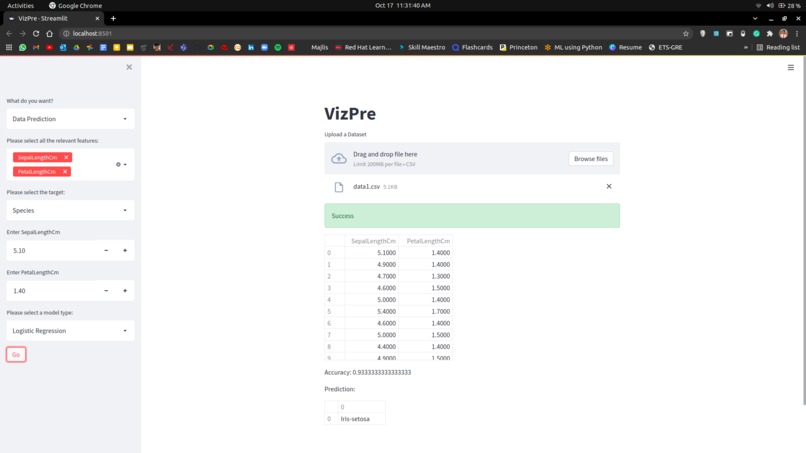
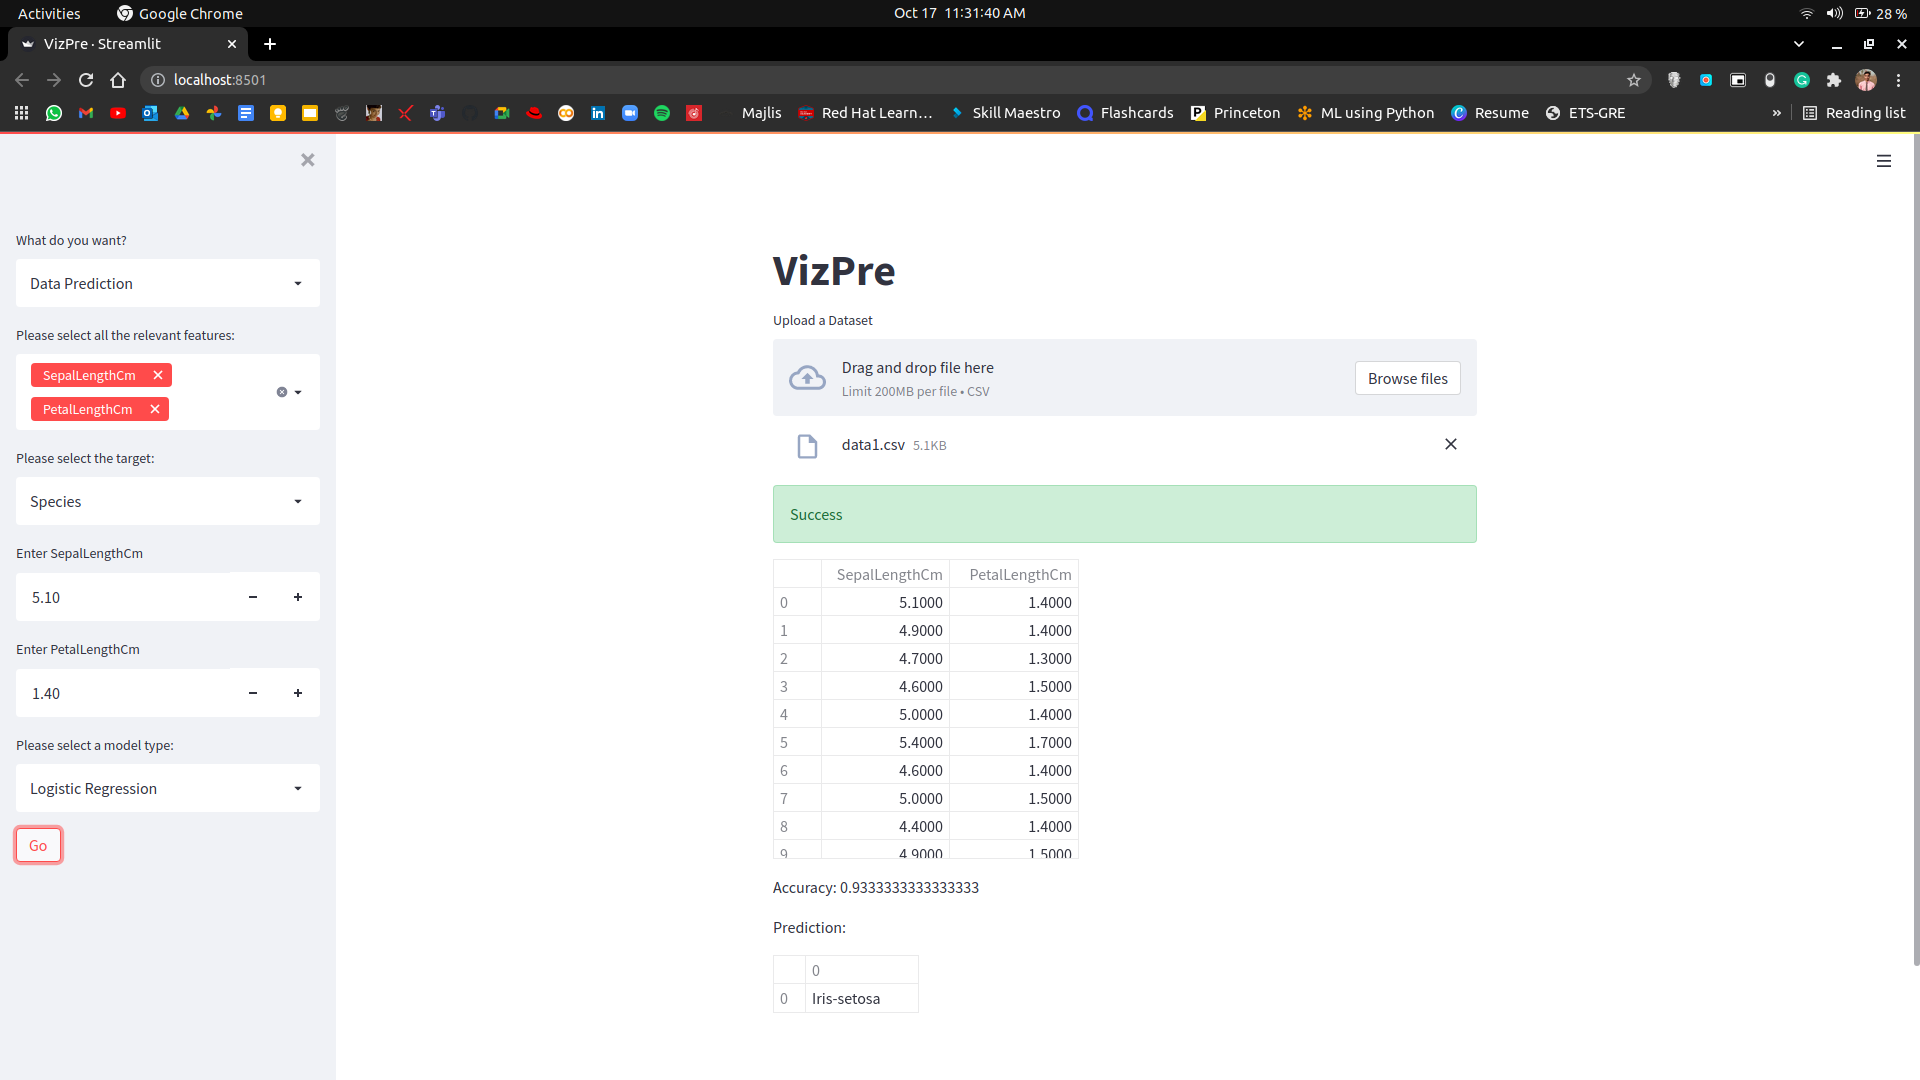
Data Prediction #1
-

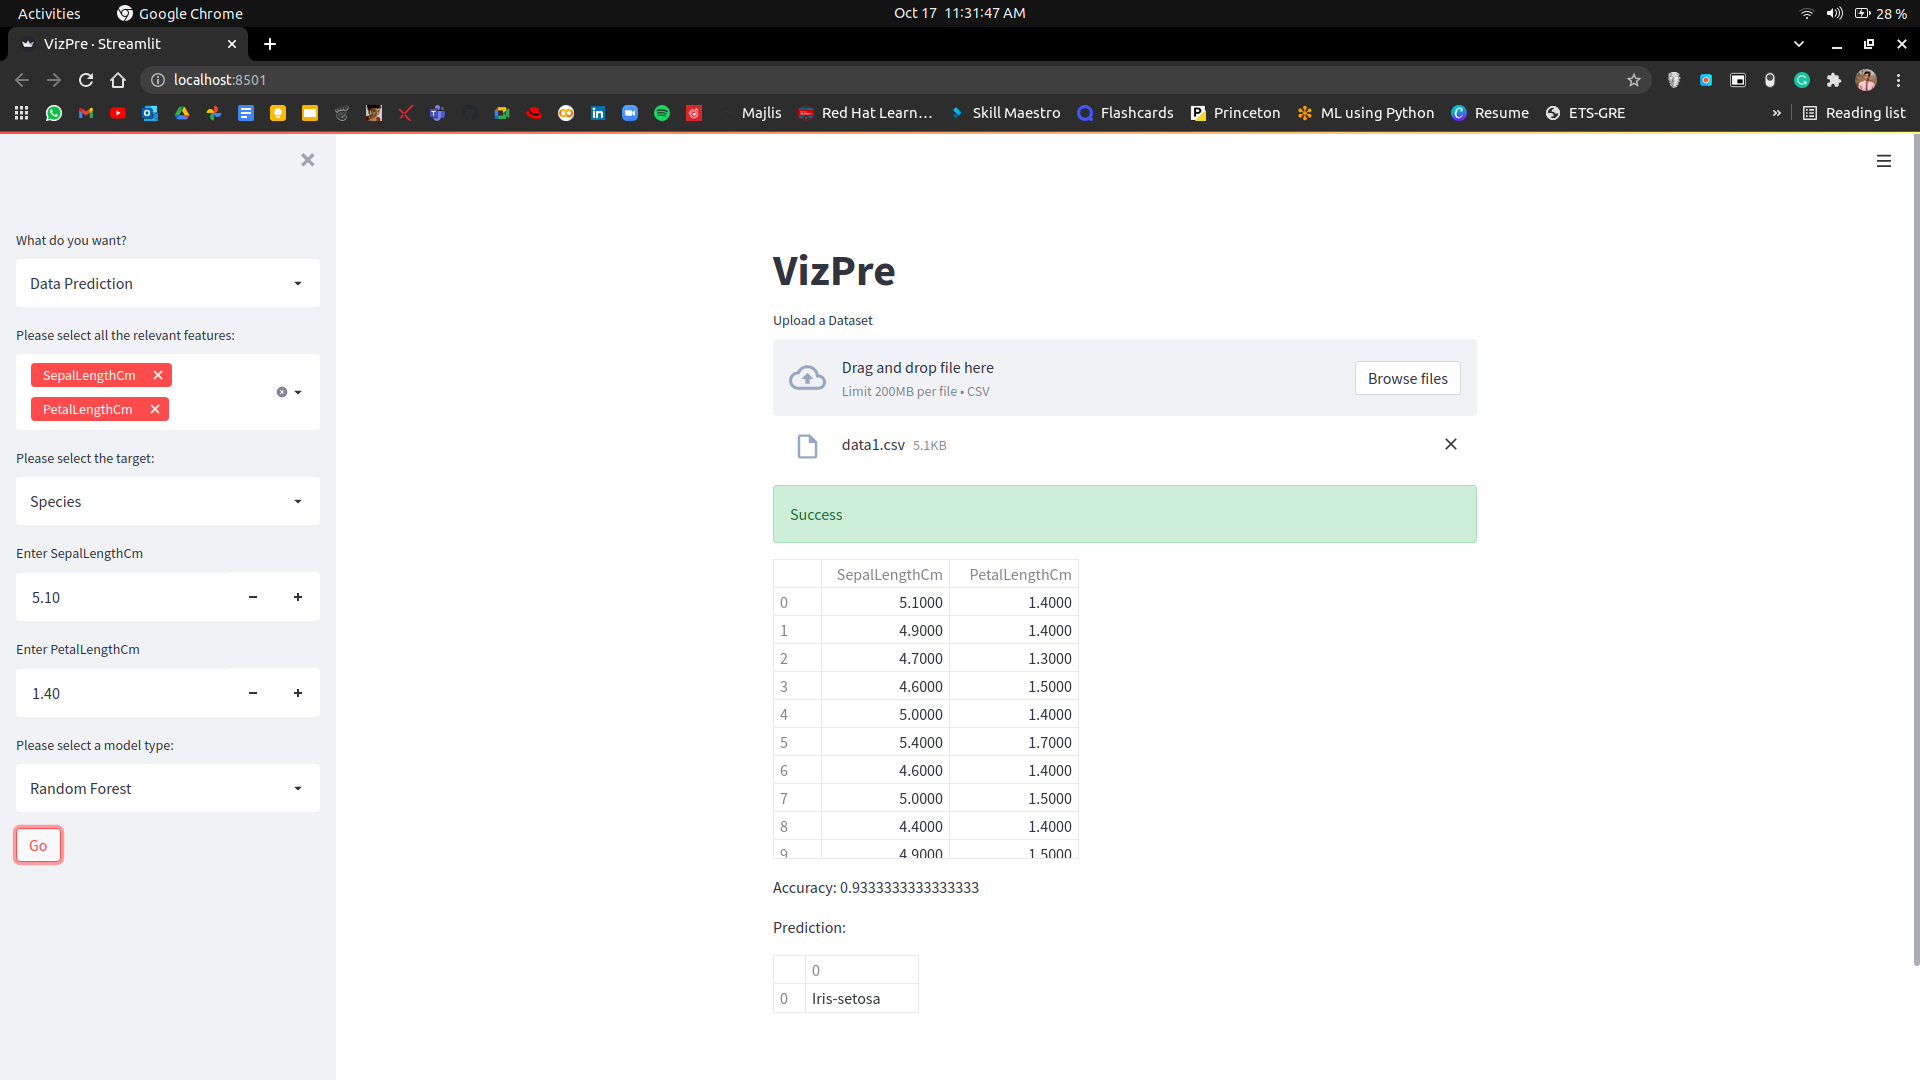
Data Prediction #2
-
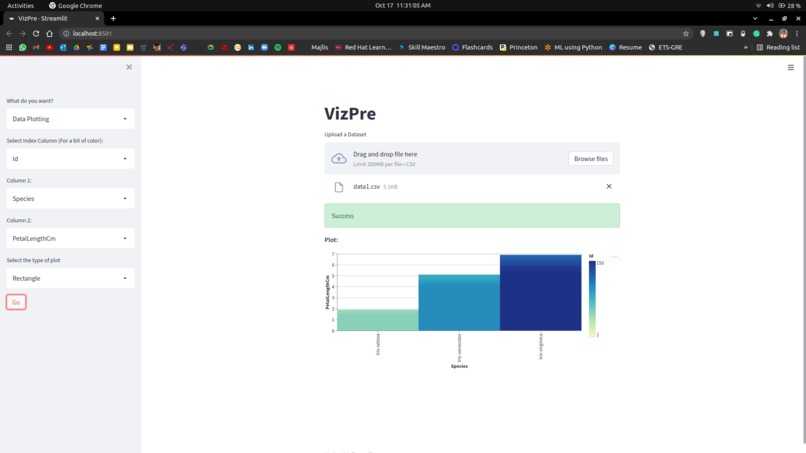
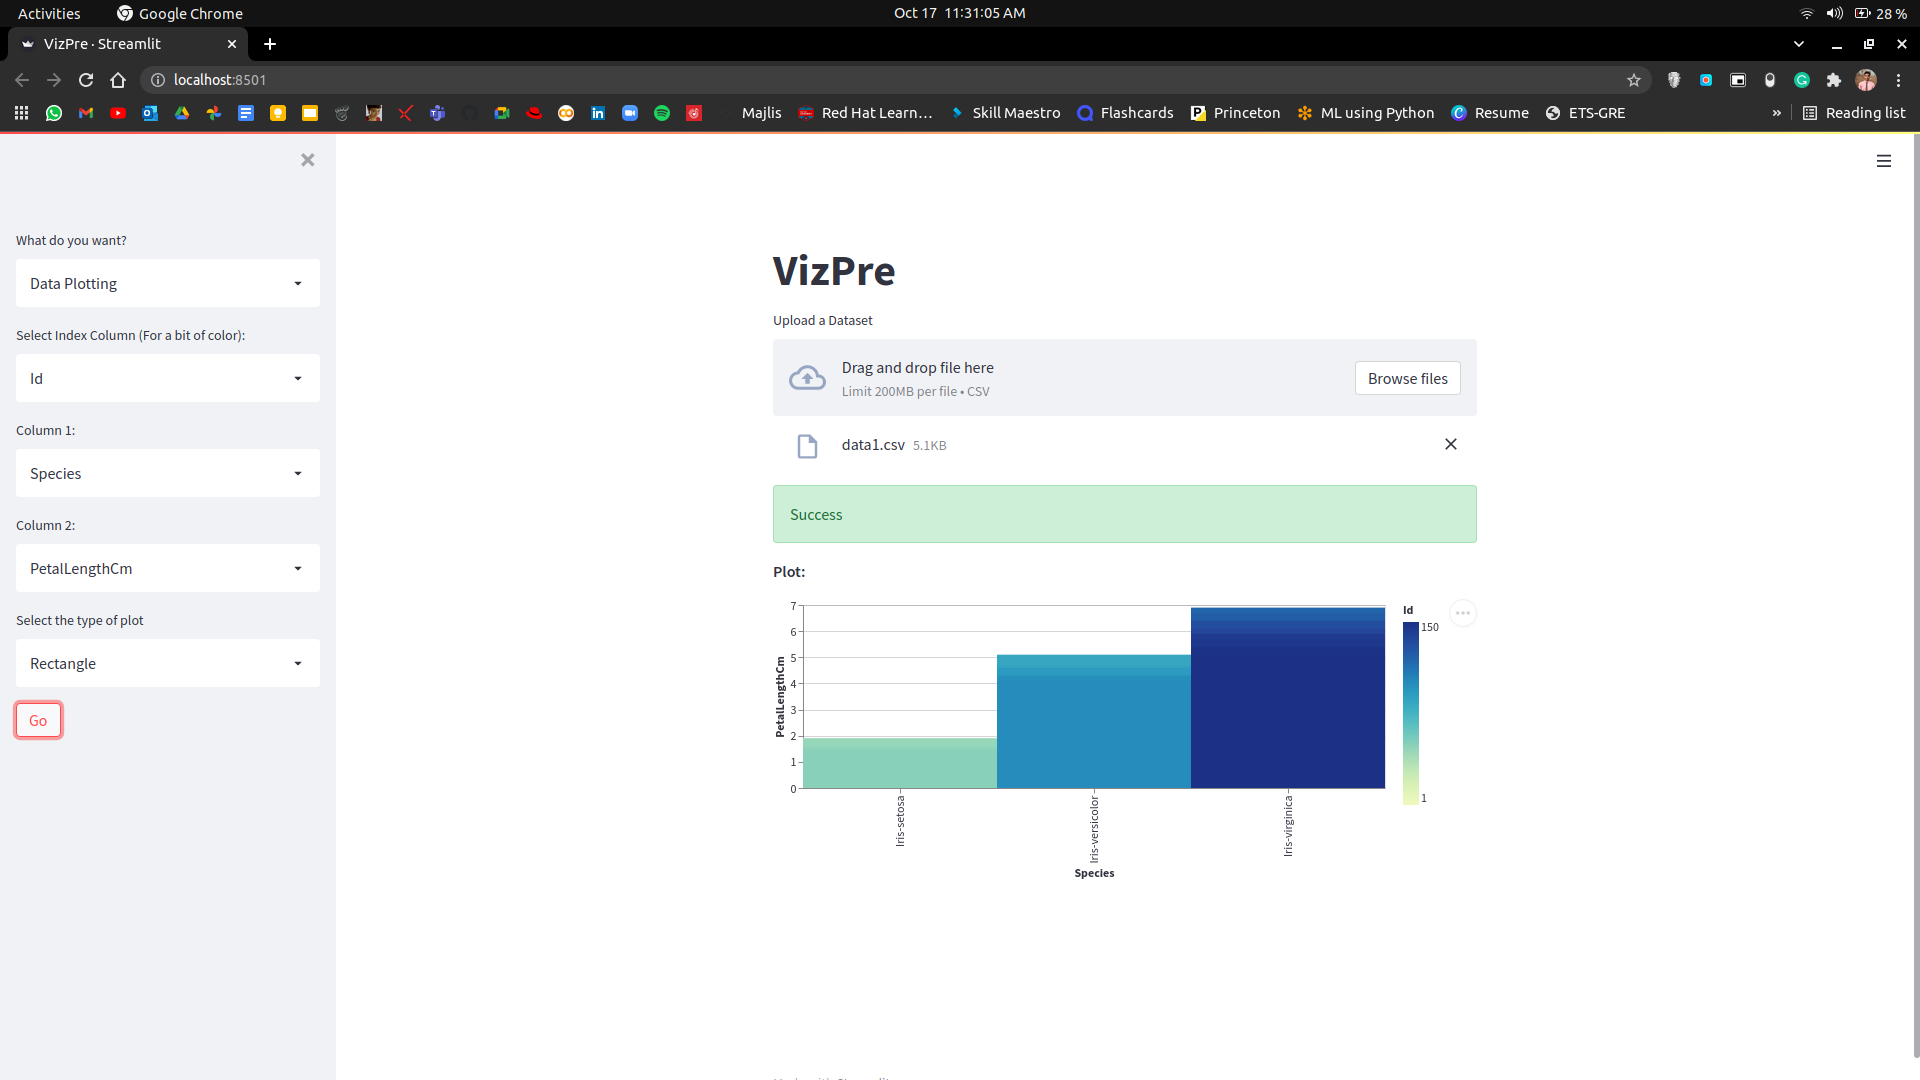
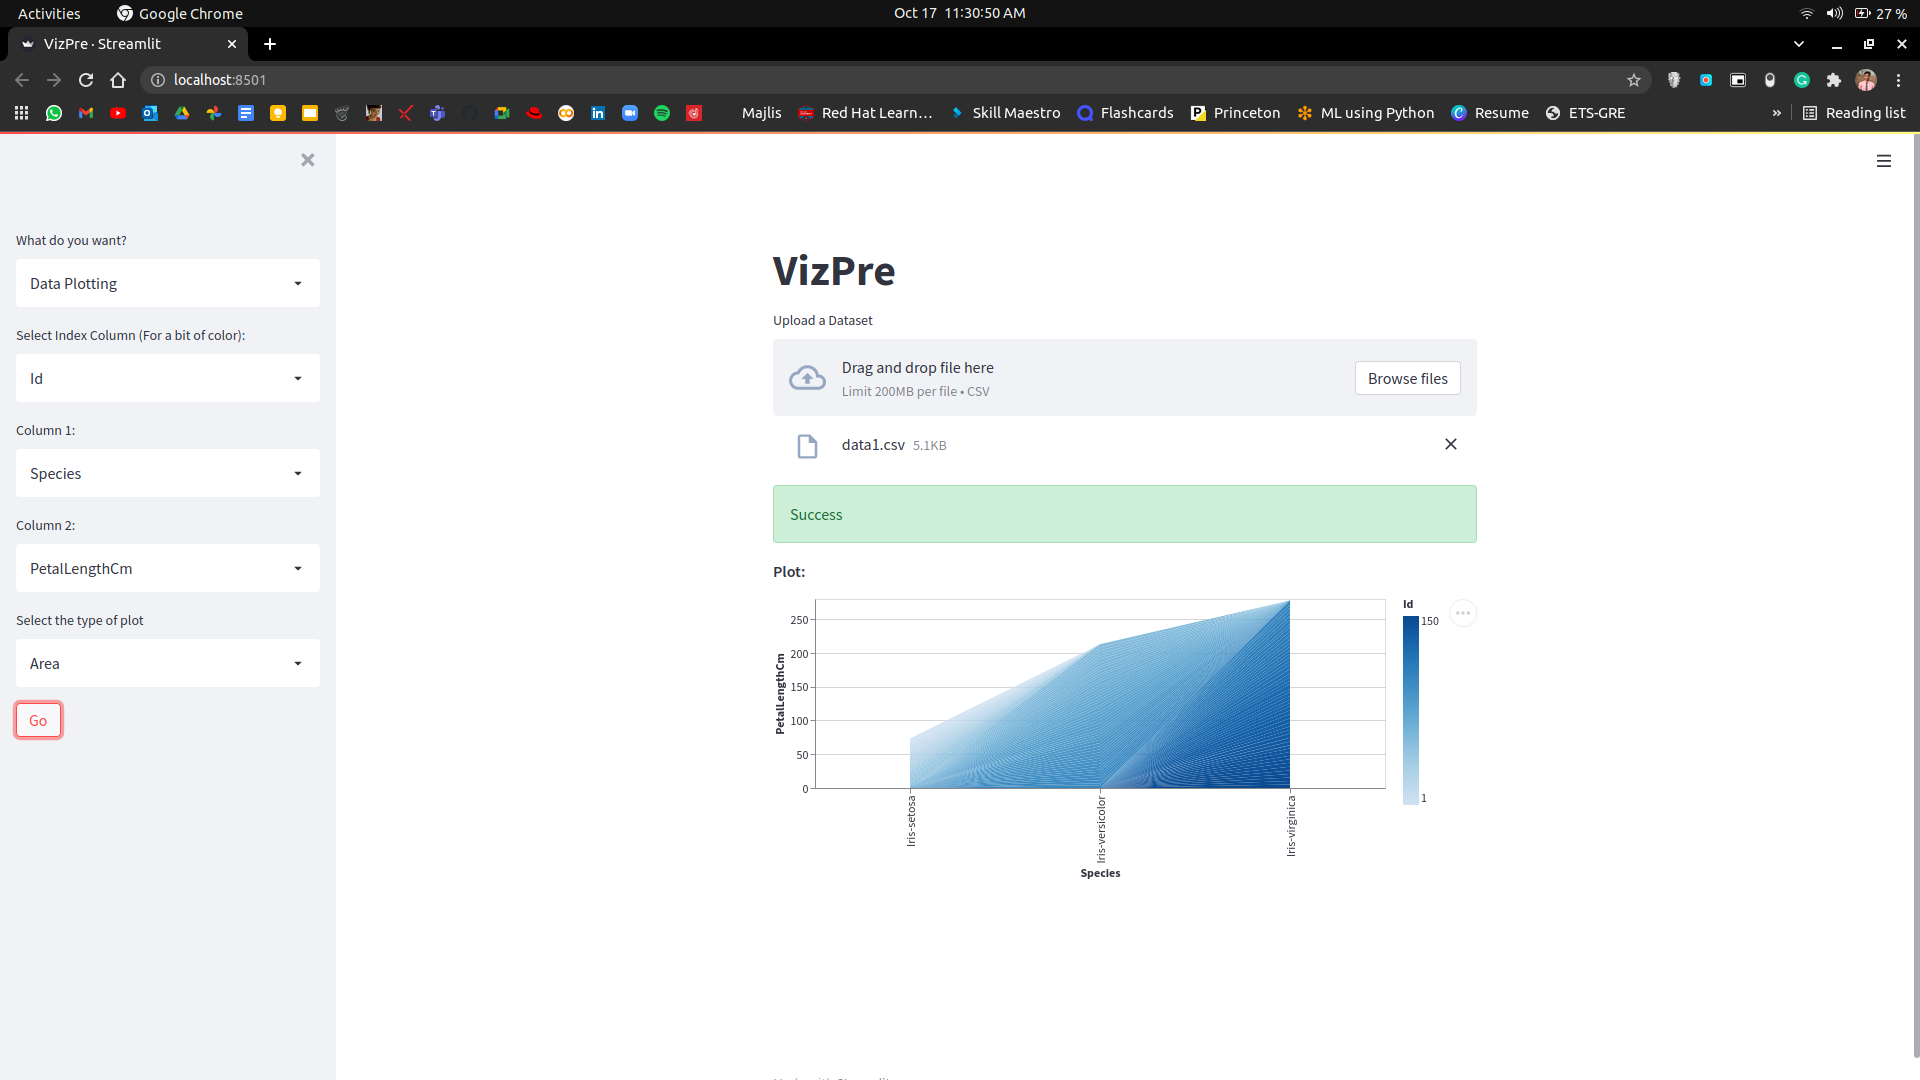
Data Plotting #1
Inspiration
The Data Science field is on boom yet there are tools needed to streamline the analytics part. This is where we got the inspiration to build a project that can make it easy to analyze data and make predictions from it.
What it does
VizPre takes a CSV file as user input, then it plots the data between the user-selected fields. In the next part, it implements common prediction algorithms and predicts data based on the user-selected features.
How we built it
The project is built on Python and uses Altair for plotting. VizPre uses sklearn to implement algorithms for data prediction.
Challenges we ran into
The main challenge was to implement the prediction part. We first had to figure out a way to give the user freedom of selecting the features. Then a drop-down list containing all prediction algorithms was made.
Accomplishments that we're proud of
We not only successfully plotted the data but also predicted it. We think this is the uniqueness of our project that no other can do.
What we learned
We learned a lot during this journey. We came across new tools that made our life easier and learned how data analytics can change the way we perceive data.
What's next for VizPre
VizPre can be fitted with new prediction algorithms and also can be scaled up for Big Data. We also are planning to implement Interactive Graphs, that make the user experience even more compelling.
Built With
- altair
- python
- sklearn
- streamlit

Log in or sign up for Devpost to join the conversation.