Inspiration
Big chains have a risk desk. The taqueria down the street has a shoebox of receipts.
Independent restaurant owners make real bets every week: raise a price, order more stock, add a shift for a busy weekend. The tools they already have, like their POS dashboard, only show what happened yesterday. None of them say what to do next, and none of them come back later to check whether a decision actually worked. We wanted to give a one-location owner what a chain gets from its analyst team: a recommendation, the risk that comes with it, and an honest follow-up.
What it does
Vizor is a decision analyst for independent restaurants and shops. Our demo runs on Lone Star Taqueria, a fictional Austin restaurant with three years of synthetic records.
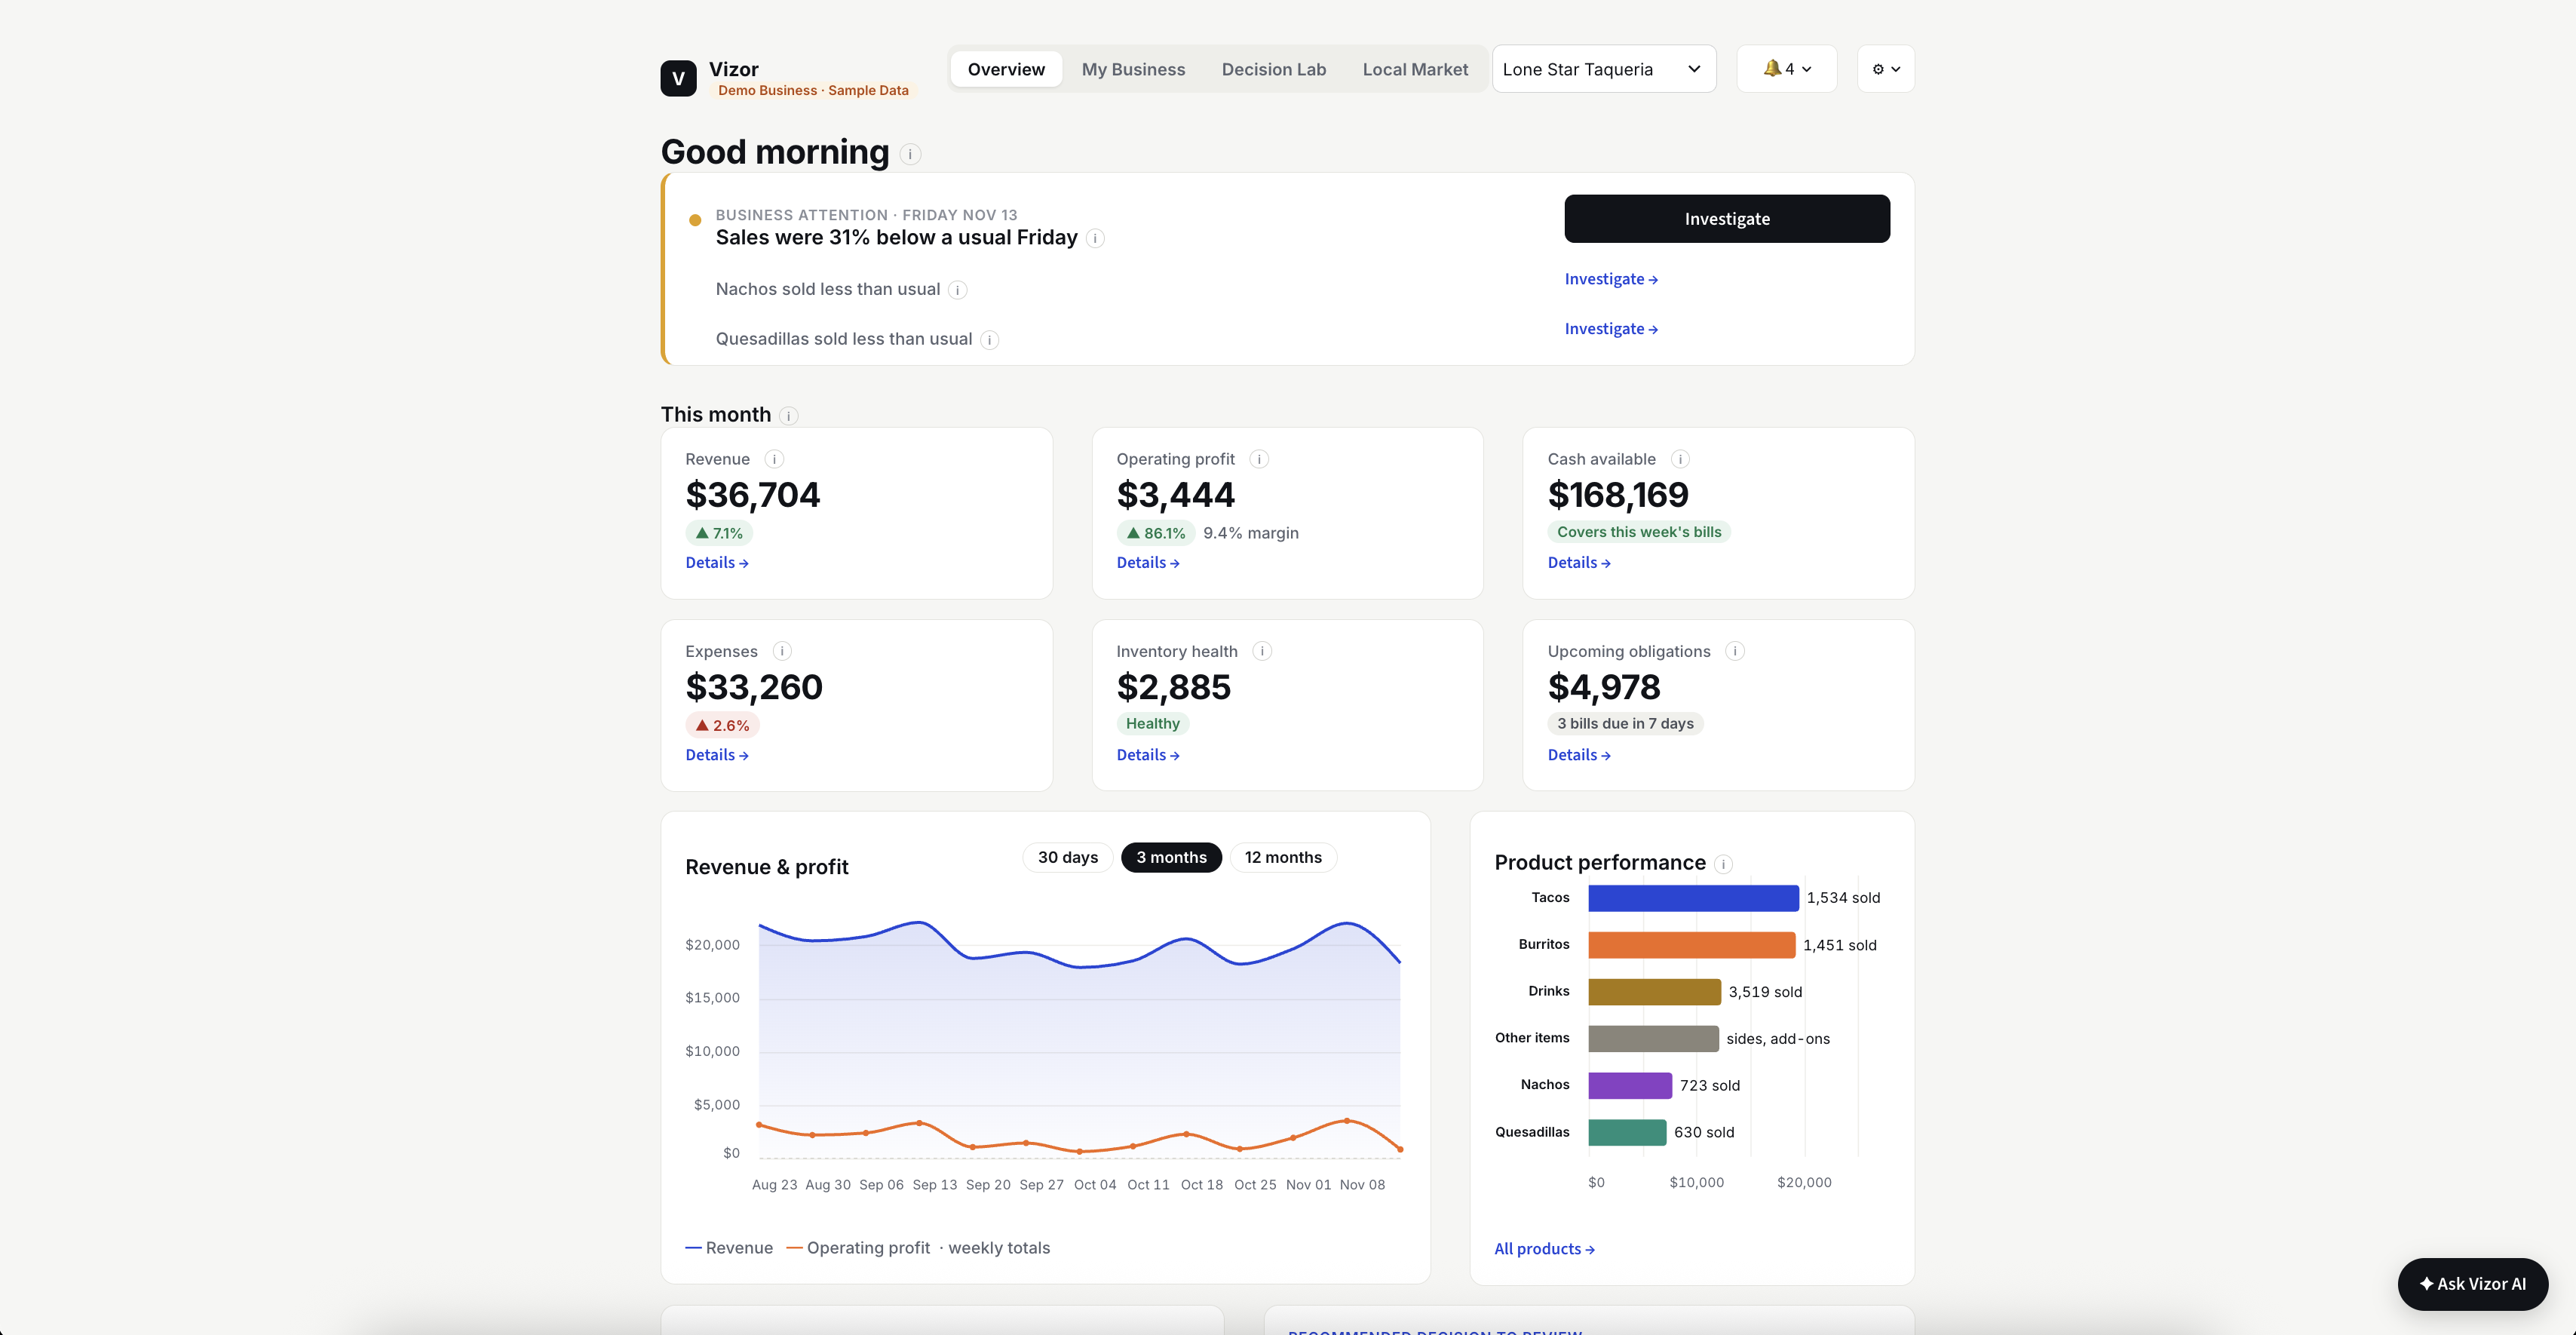
- Morning brief: flags what changed and what needs attention, like "Sales were 31% below a usual Friday," and which items drove it.
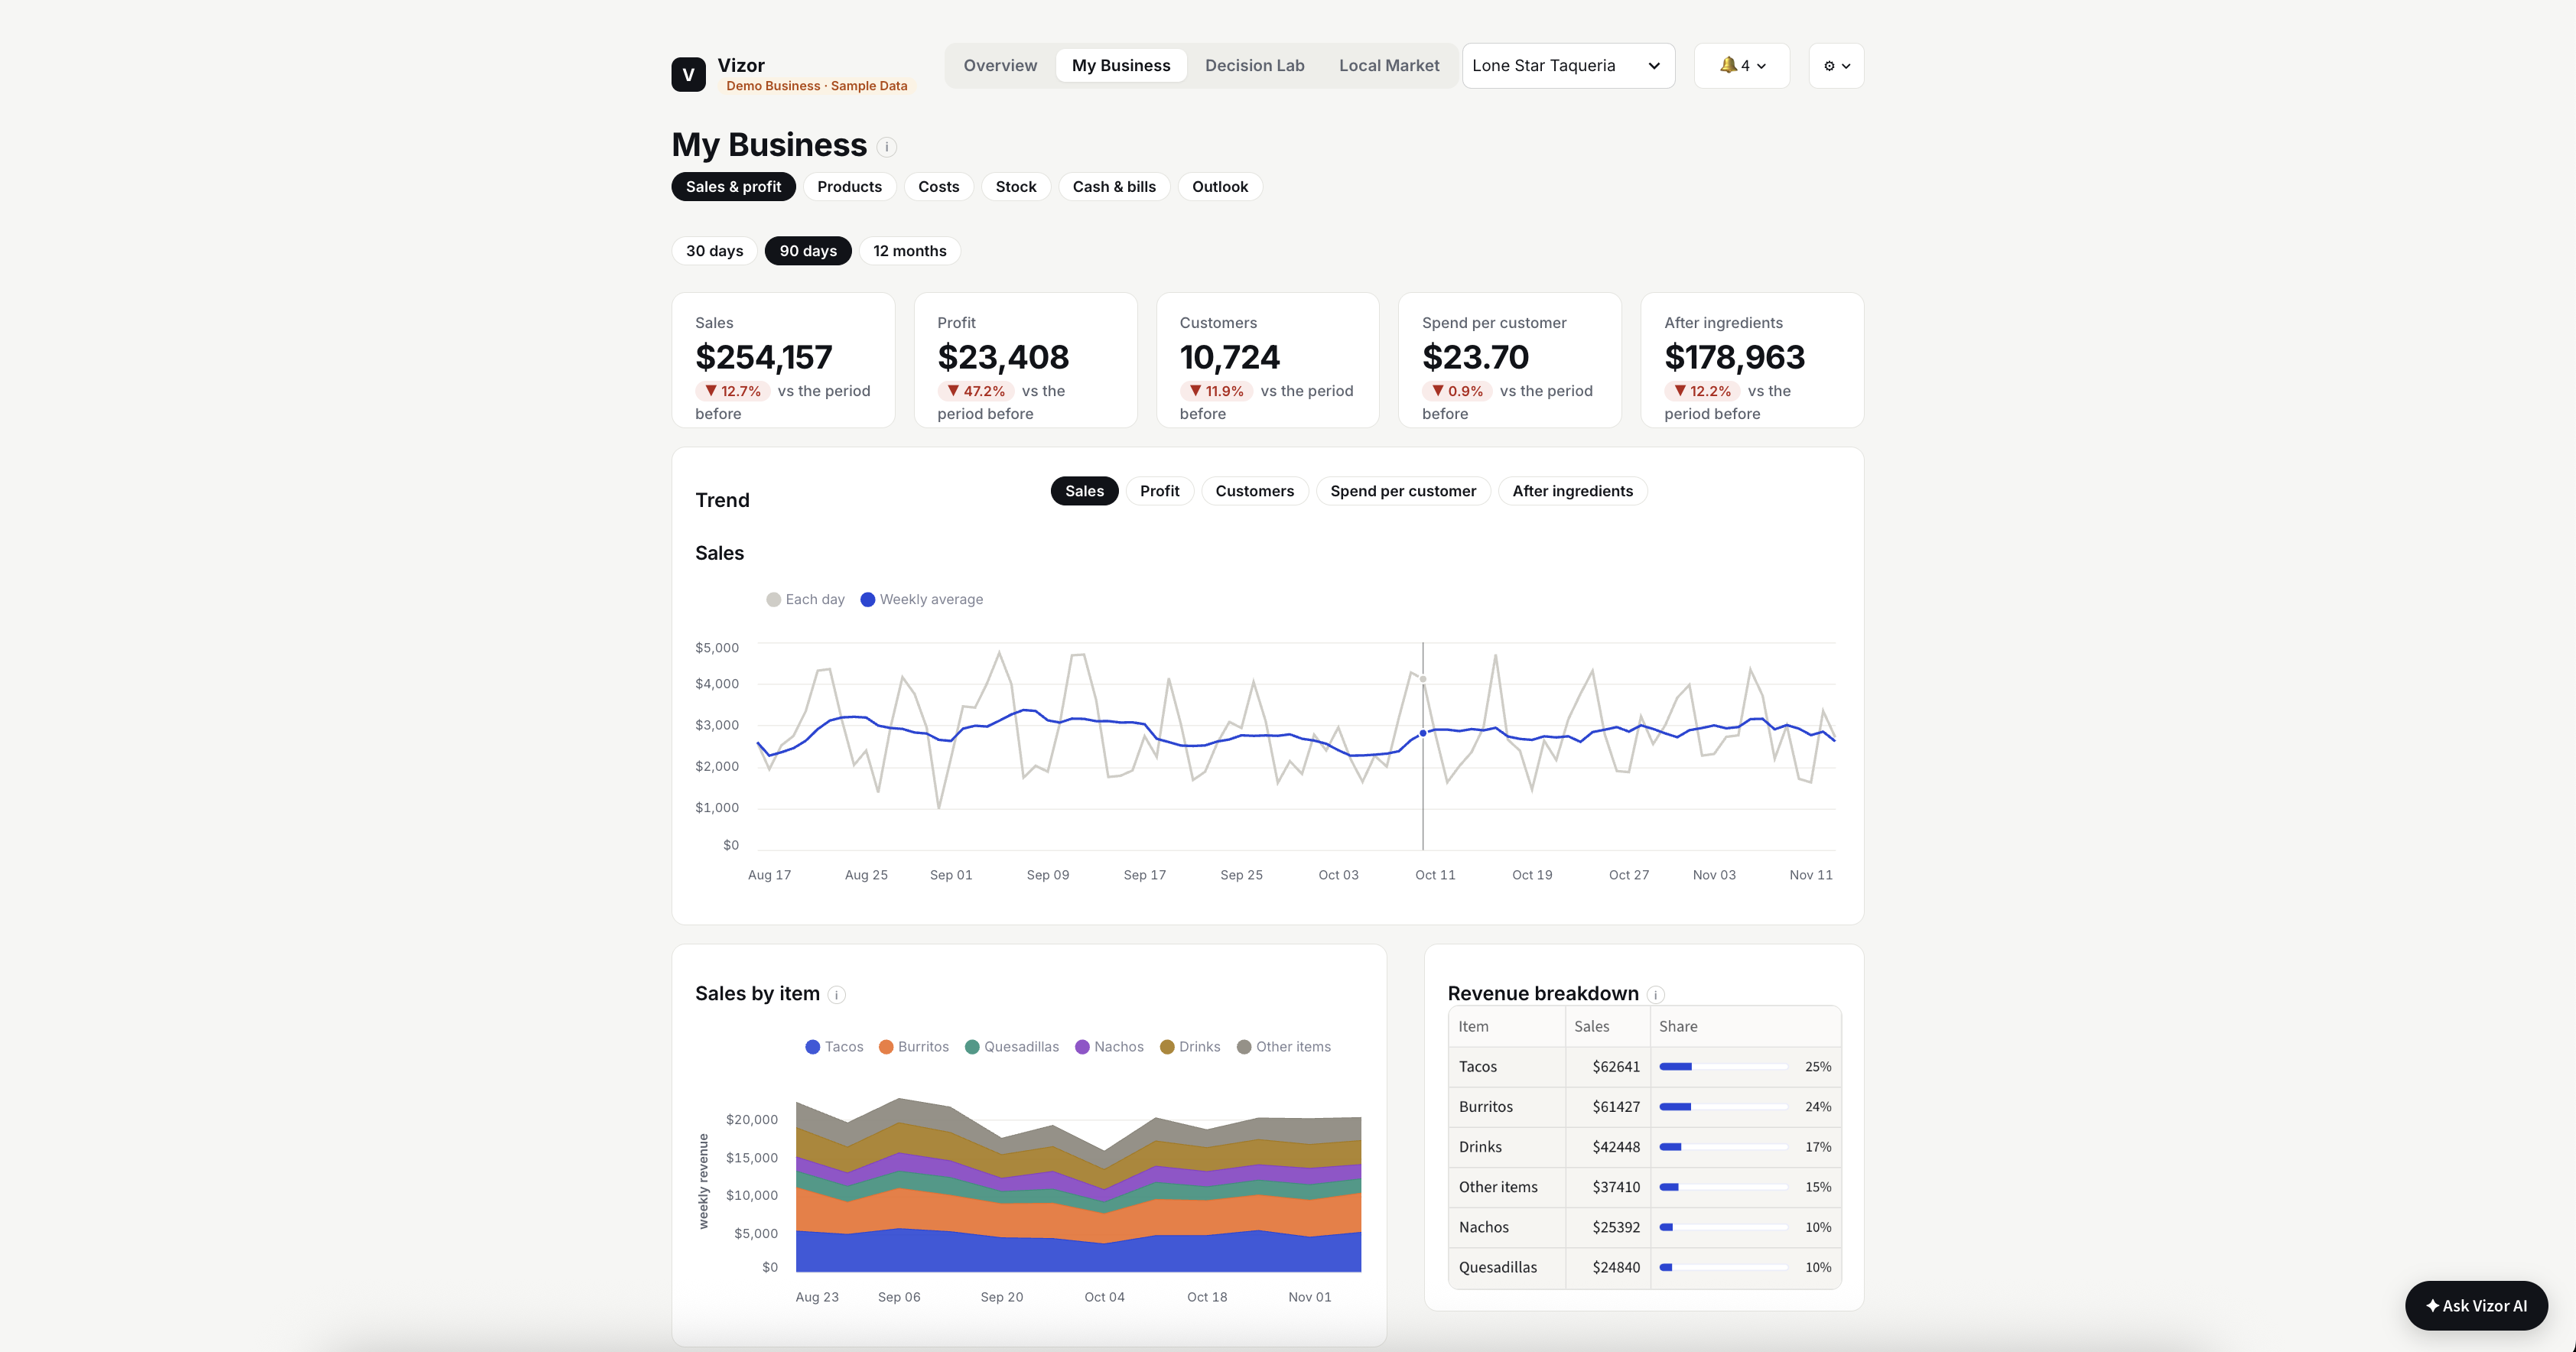
- My Business: sales, profit, cash, bills and stock. Vizor knows each recipe's ingredients, so it can warn when an item may sell out before the next delivery.
- Forecast: a 4-week outlook, tested on past weeks it never saw.
- Decision Lab: ask "What if I raise taco prices 5%?" and get the likely gain, a realistic range, the chance it beats doing nothing, and the point where the answer flips.
- Approval: Vizor never changes a price or places an order by itself.
- Follow-up: the prediction is saved the moment you approve, and Vizor comes back to check it against what actually happened.
- Vizor AI: ask in plain English and get the same checked numbers. Morning briefs and alerts can also go to iMessage (opt-in).
- Local Market: your prices next to nearby restaurants, read from official menus, with every price dated and sourced.
How we built it
Synthetic data. We generated three years of daily records for the taqueria: orders by item and weekday, recipes, ingredient stock, deliveries, bills and cash. That gave every feature something realistic to run on.
Forecasts have to earn their place. Six models are tested on past weeks they never saw, and the simple baseline is kept unless another model beats it on that held-out data:
$$ $$
Decision Lab is a Monte Carlo simulation. For a proposed change, we simulate \(N = 1{,}000\) possible next months drawn from the restaurant's own history. Each run \(i\) gives the profit difference \(\Delta_i\) between making the change and doing nothing. Then:
$$ \text{expected gain} = \frac{1}{N}\sum_{i=1}^{N} \Delta_i \qquad P(\text{beats doing nothing}) = \frac{1}{N}\sum_{i=1}^{N} \mathbf{1}[\Delta_i > 0] $$
The realistic range is a percentile band of the \(\Delta_i\). For a 5% taco price increase ($12.75 to $13.39), Vizor expects +$286 over four weeks, with a range of −$5 to +$557.
Finding where the answer flips. A price increase only pays off if customers don't react too strongly. With price elasticity \(\varepsilon\), price \(p\), unit cost \(c\), baseline quantity \(q\) and price change \(\delta\):
$$ \Delta\pi(\varepsilon) = \big(p(1+\delta) - c\big)\, q\,(1+\delta)^{\varepsilon} - (p - c)\, q $$
Vizor finds the \(\varepsilon^*\) where \(\Delta\pi = 0\) and tells the owner plainly: if customers are more price-sensitive than that, this change becomes a loss.
The follow-up ledger. Vizor keeps two predicted ranges: one with the change and one without it. Afterwards it compares the actual result to both. If the result lands only in the "with change" range, the change most likely made the difference. If it lands in both, Vizor says normal variation is too big to call. In our demo replay, taco orders came in at 1,372, inside the predicted 1,245 to 1,533, but also inside the no-change range, so Vizor says exactly that.
AI that can't make up numbers. The language model writes the wording, but every number comes from the calculation engine. Before a reply reaches the owner, each number in it is checked against the calculation.
Challenges we ran into
- You can't wait four weeks during a hackathon. The follow-up check is the heart of Vizor, so we built a clearly labeled synthetic replay of the next four weeks to show the full loop.
- Language models state made-up numbers with confidence. A wrong number in a money decision is worse than no answer, so we kept the math out of the model and added the number check.
- A single number hides the risk. "+$286" on its own looks certain. We had to show the range, the chance of a loss and the flip point, then turn percentiles into plain language like "Very likely to help, though a loss is possible."
- Local prices are messy. We only use official menus, and we date and source every price. When there aren't enough comparable menus, Vizor says so instead of guessing.
What we learned
- A forecast is only worth trusting if it beats a simple baseline on data it hasn't seen, and often it doesn't.
- "Too close to call" is a useful answer. A tool that admits uncertainty is easier to trust than one that never does.
- Language models are great at explaining and bad at arithmetic, so the math belongs outside the model.
- The most valuable part isn't any single chart. It's the loop: predict → approve → check.
What's next
All demo data is synthetic, and accuracy hasn't been measured on a real business yet. Next we want to connect real POS data, run a pilot with a few local restaurants, and publish how often Vizor's ranges actually contain what happened.
Built With
- anthropic-claude
- backtesting
- capital-one-nessie
- catboost
- fred-api
- github-actions
- google-gemini
- imessage
- monte-carlo-simulation
- numpy
- pandas
- photon
- pytest
- python
- quickbooks-online-api
- ruff
- scikit-learn
- square
- streamlit
- telegram-bot-api
- time-series-forecasting
- xgboost

