Inspiration
Learning algorithms, scientific concepts, and data analysis often happens through static explanations—text, formulas, or code snippets. While these explain what something is, they rarely show how it evolves.
Students end up memorizing instead of understanding, and analysts stare at raw CSV files without quickly grasping patterns.
VizLens was inspired by the idea that understanding emerges from seeing processes unfold. We wanted a tool that transforms abstract inputs into dynamic visual intuition.
What it does
VizLens converts concepts, algorithms, code, and datasets into interactive visualizations that help users intuitively understand how systems behave.
It has two main modes:
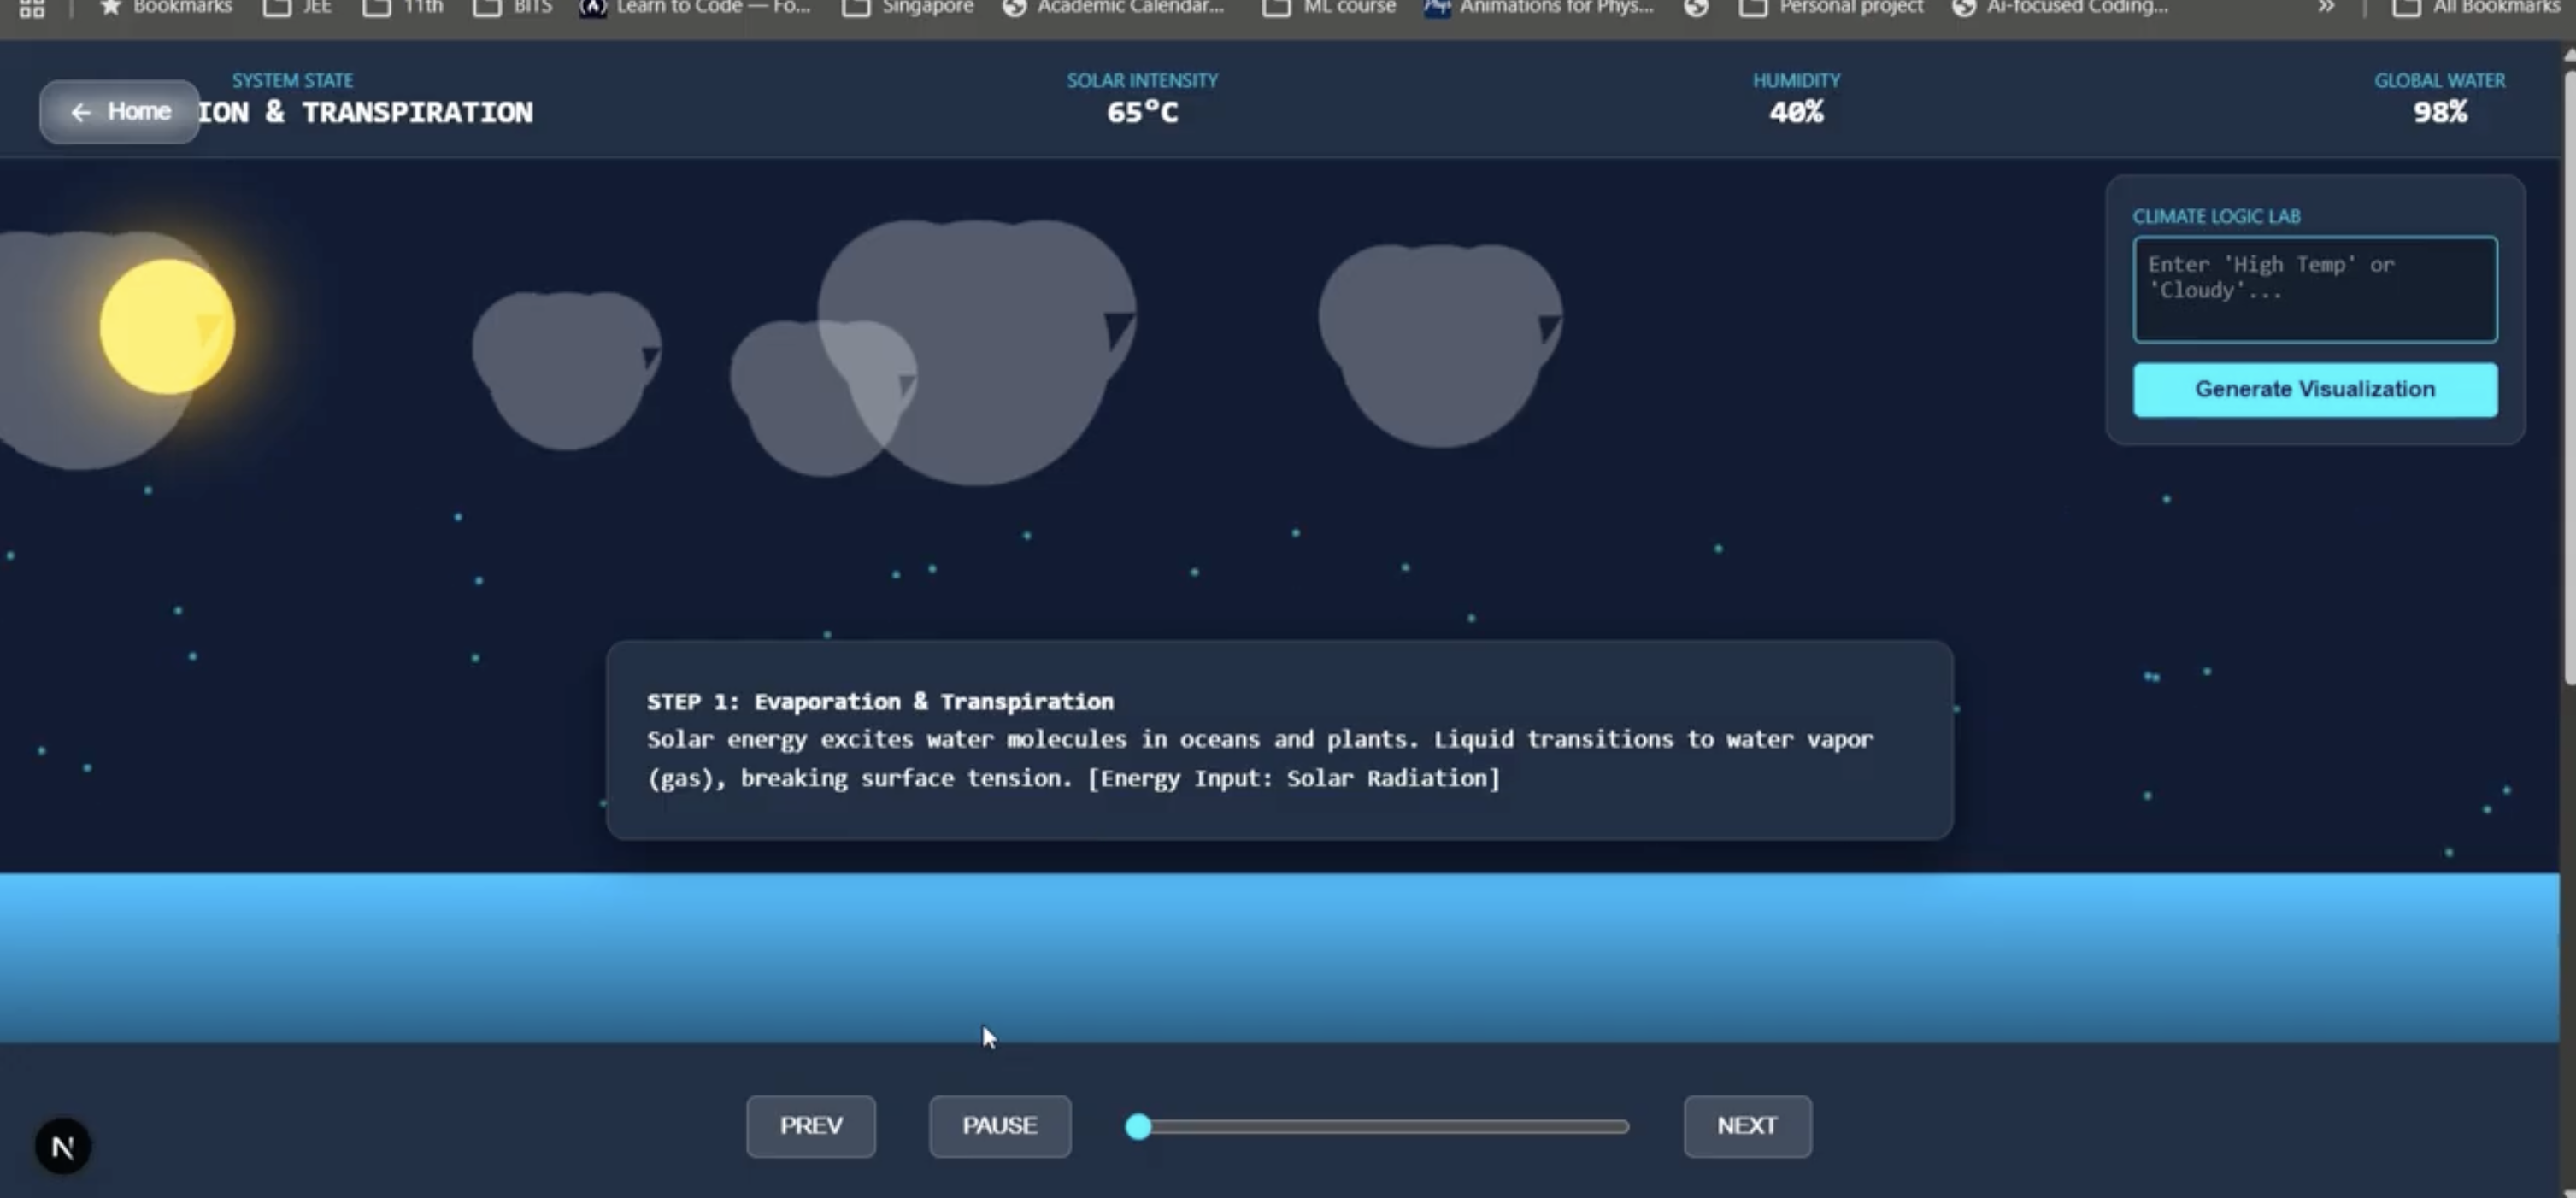
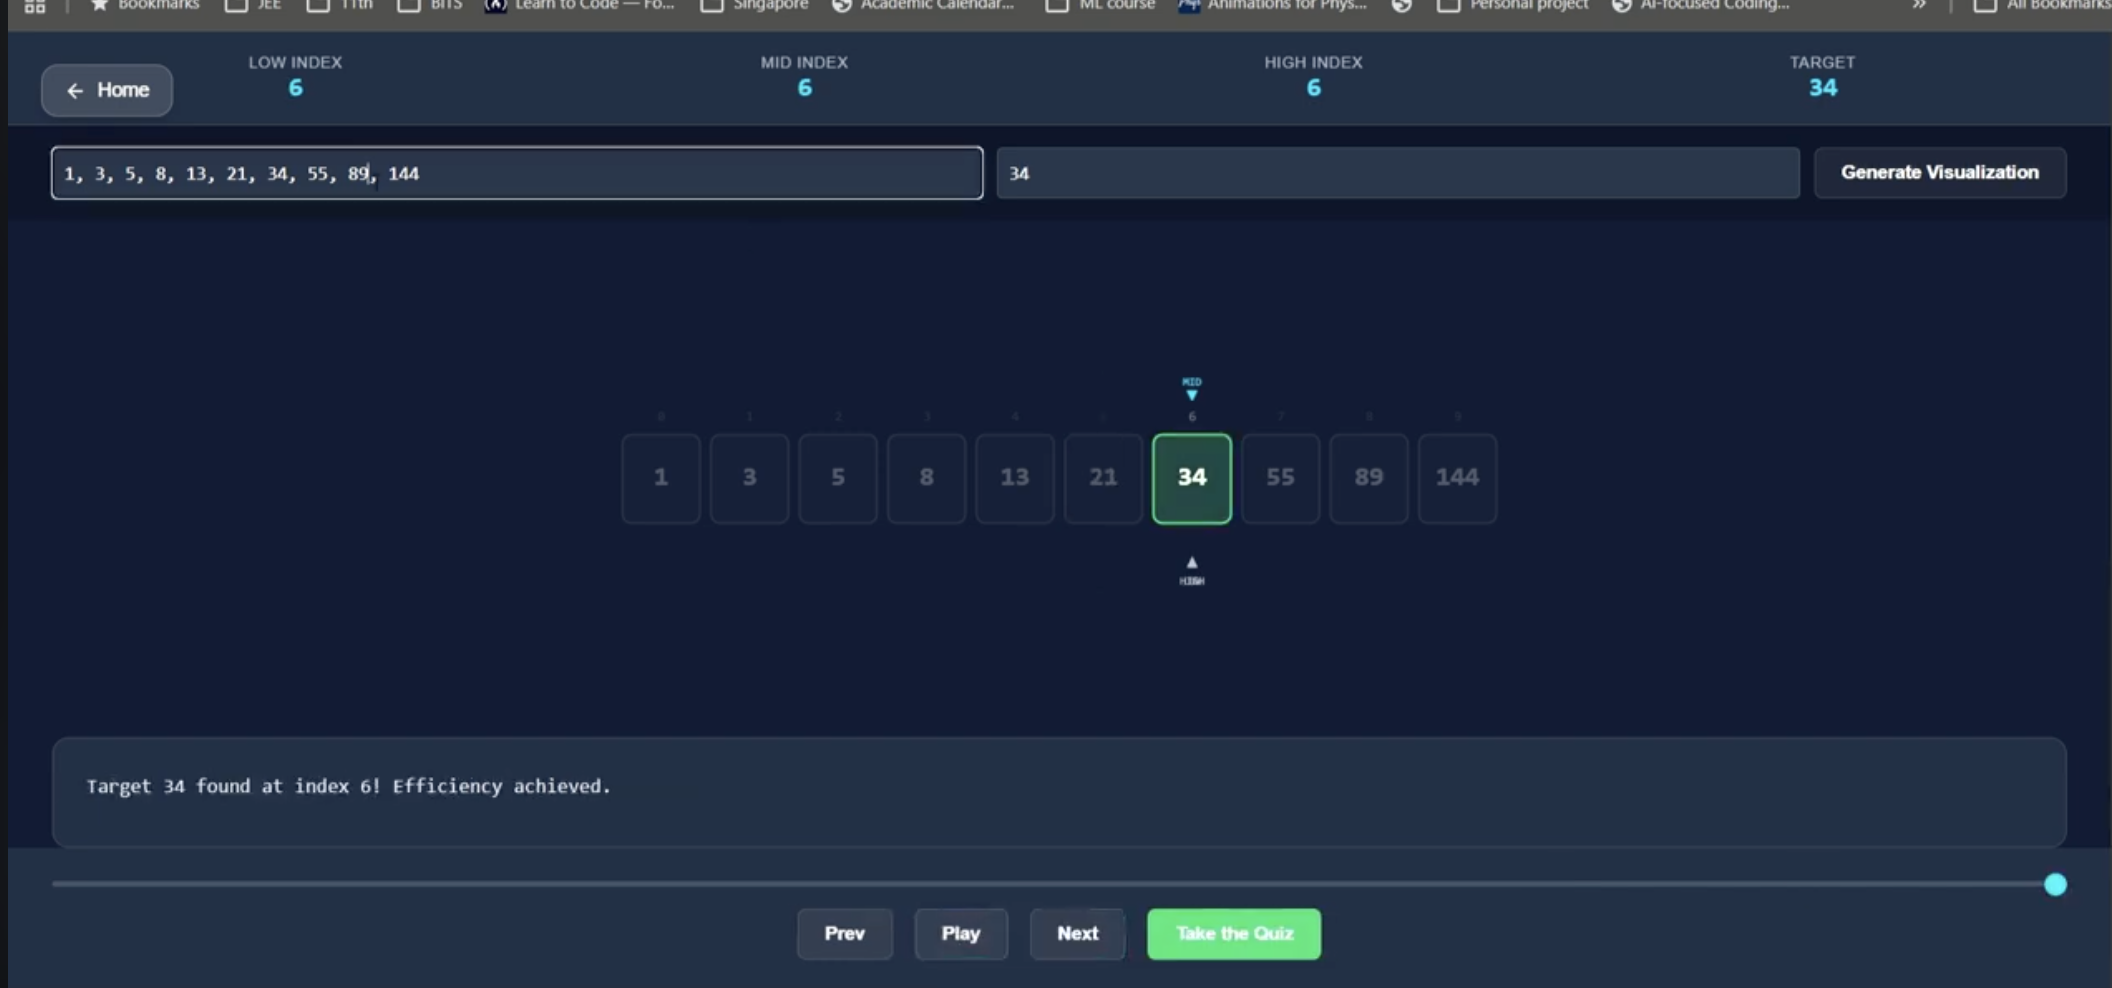
Concept Lens
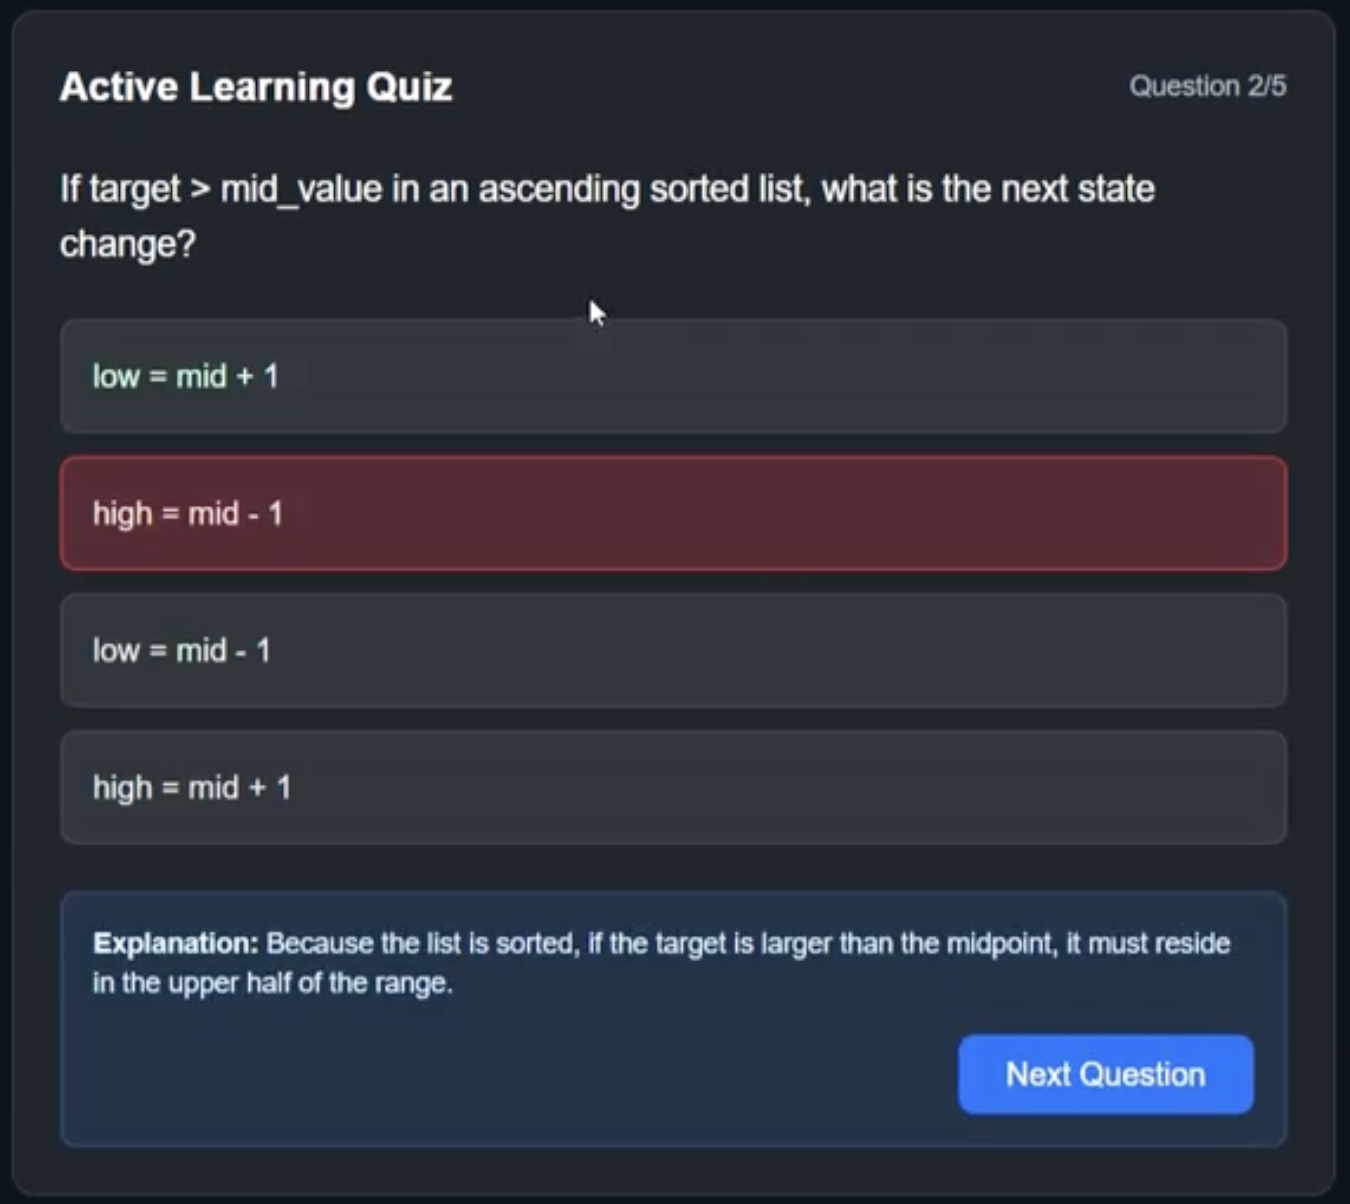
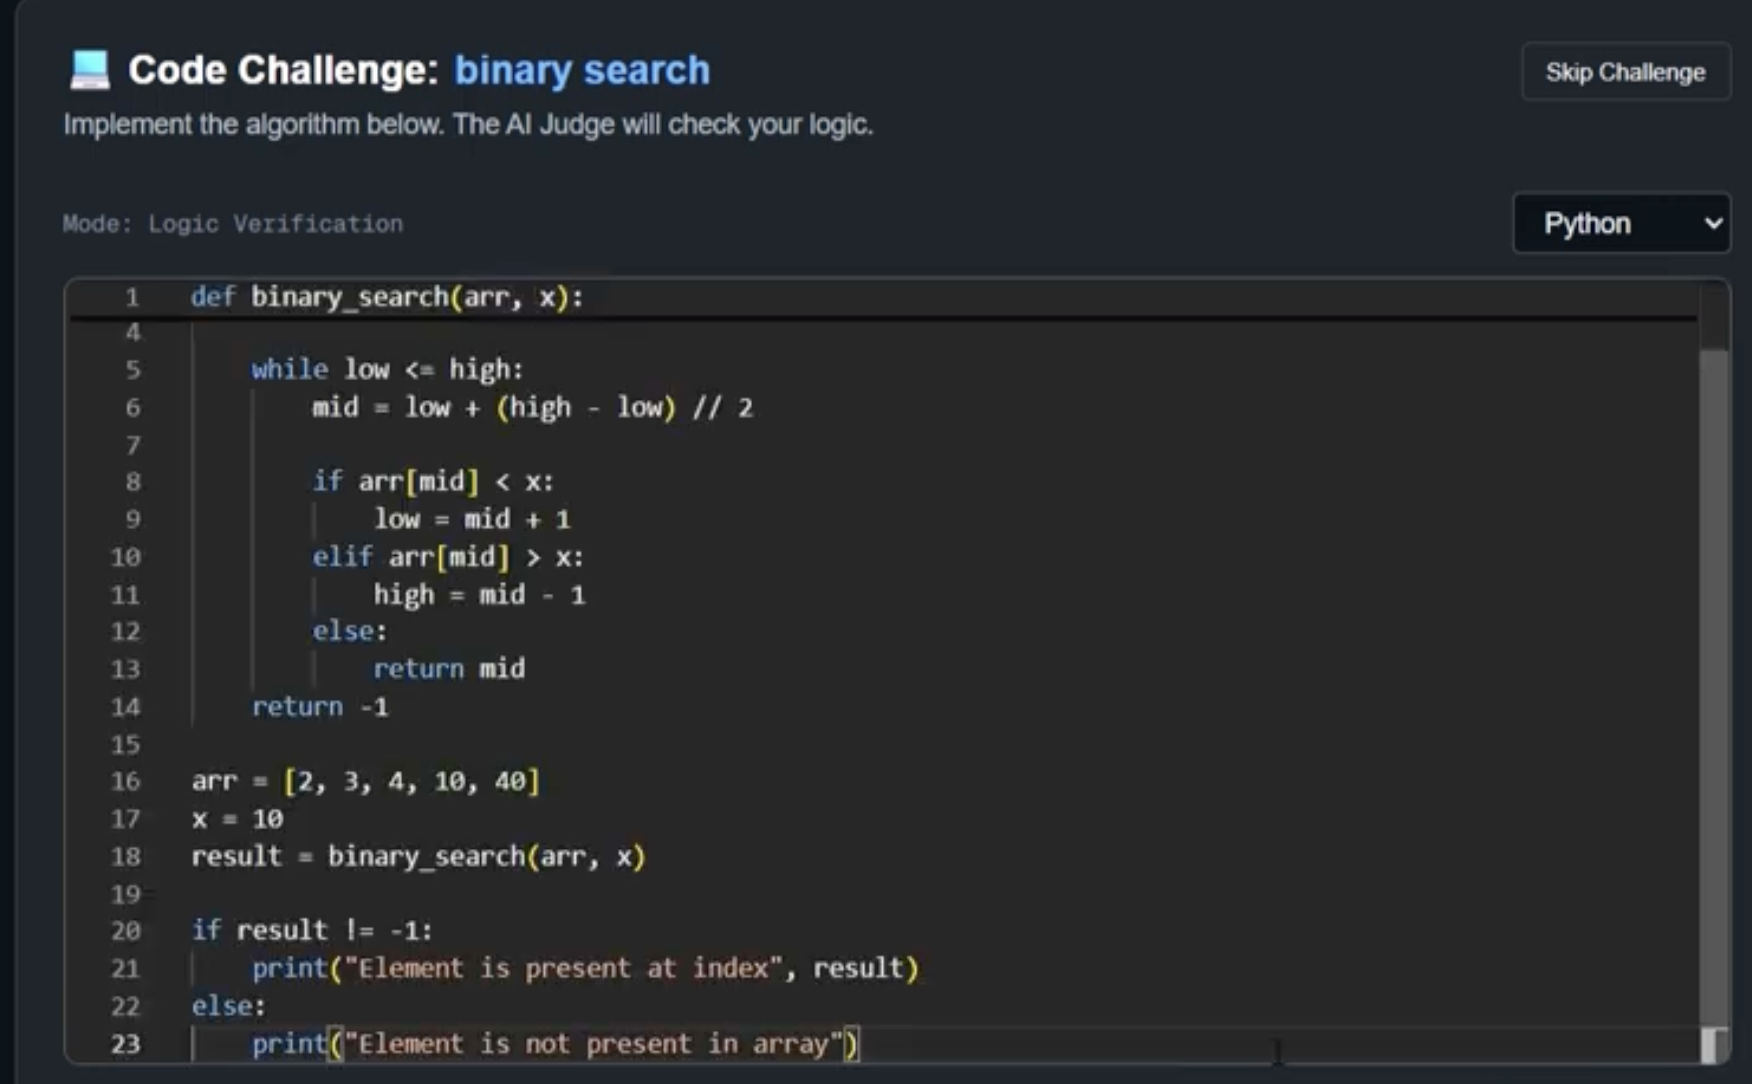
Visualizes algorithms or scientific processes step-by-step Shows execution flow rather than static explanations Includes quizzes and coding challenges to reinforce learning
Data Lens
Converts uploaded CSV files into intelligent visual dashboards Automatically generates charts and highlights patterns or anomalies The result is a system where users can watch ideas evolve instead of just reading about them.
How we built it
VizLens combines AI-driven interpretation with interactive web visualization.
Gemini models via Google AI Studio interpret user prompts, code, or datasets.
The AI generates a structured visualization plan describing what should be visualized and how.
The front end renders the output using HTML5 Canvas and Chart.js dashboards.
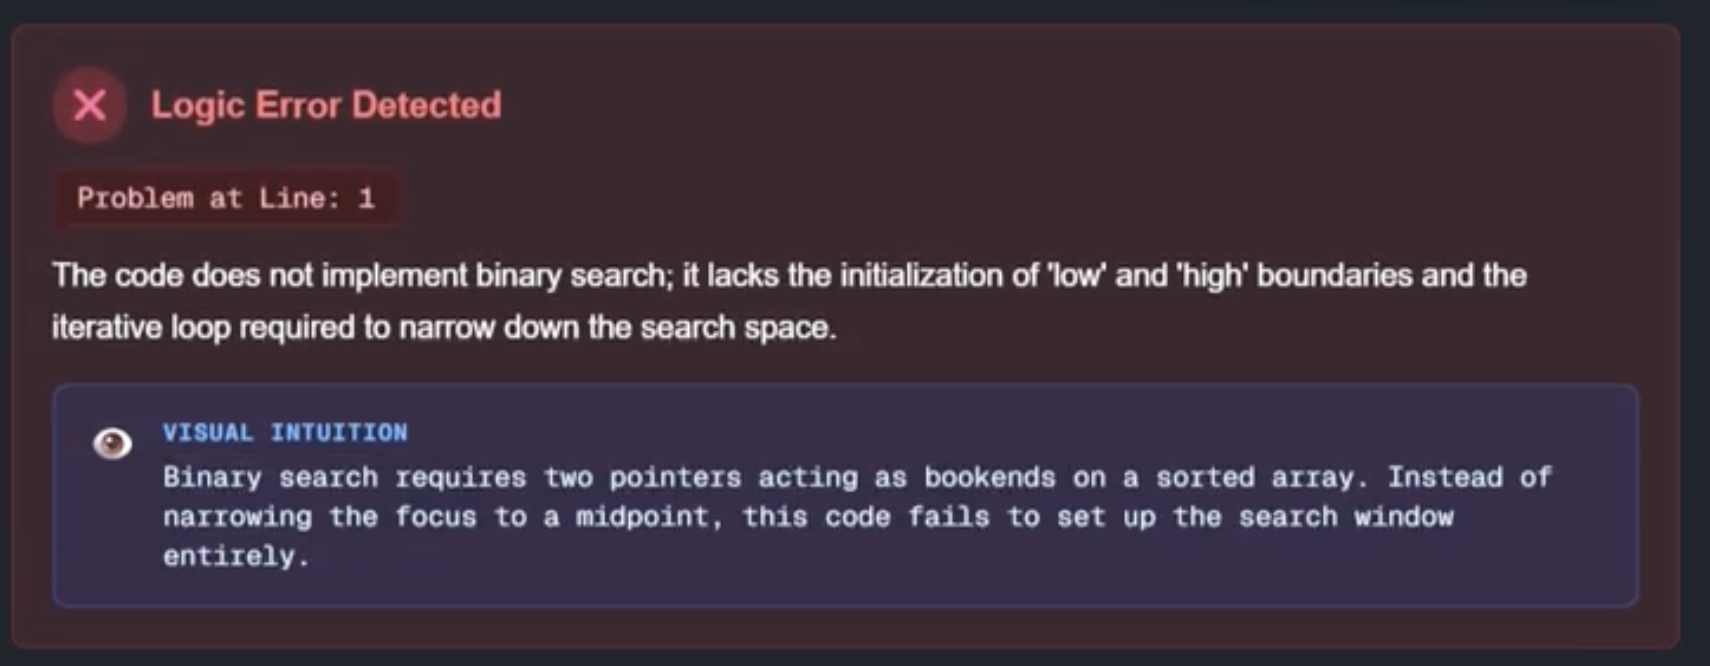
An embedded coding editor allows users to solve generated challenges.
A secondary AI loop creates concept-check quizzes to reinforce learning.
This pipeline converts text → structured representation → dynamic visualization → interactive learning feedback.
Challenges we ran into
One challenge was translating abstract concepts into meaningful visual structures. Not every algorithm or dataset maps neatly to a visualization, so designing a reliable interpretation pipeline required experimentation.
Another challenge was ensuring the AI-generated visualizations stayed accurate and educational, especially when explaining algorithm steps.
Handling diverse CSV datasets was also tricky because data structures vary widely, so the system had to intelligently choose appropriate chart types.
Accomplishments that we're proud of
We successfully built a working system that can transform plain text prompts or datasets into interactive visual learning tools.
The dual-lens approach (Concept Lens + Data Lens) creates a unified platform for both learning and data exploration.
We’re particularly proud of integrating visualization, quizzes, and coding challenges into a single active-learning loop, turning passive explanations into interactive understanding.
What we learned
Building VizLens taught us that visual intuition dramatically improves comprehension. Concepts that seem complex in text often become obvious once visualized step-by-step.
We also learned that combining AI reasoning with deterministic visualization tools creates powerful educational interfaces.
Finally, we realized how important active learning is—quizzes and coding challenges force users to engage with the concept rather than just observing it.
What's next for VizLens
Future versions of VizLens could expand into additional domains like finance, biology, and physics simulations.
We also want to add:
3D visualizations for complex systems
collaborative classrooms where teachers guide live visualizations
integration with coding platforms and learning management systems
The long-term goal is to build a platform where any concept, dataset, or algorithm can instantly become an interactive visual experience.

Log in or sign up for Devpost to join the conversation.