Inspiration
Most chart tools force users into one of two extremes: rigid templates that are easy to use but hard to customize, or code-heavy libraries that offer flexibility but require engineering skills. AI chart generators introduced a third option, but their output is often a one-off image or a block of generated code that becomes difficult to edit, reuse, or trust.
We built Vizkit around a different idea: a chart should not be a disposable visual. It should be a reusable business communication asset—one that combines data structure, visual design, business context, and analytical insight.
Our goal was to let anyone go from “I need a McKinsey-style chart comparing quarterly revenue” to a polished, editable visualization, while still giving AI agents and advanced users a reliable, programmable workflow.
What it does
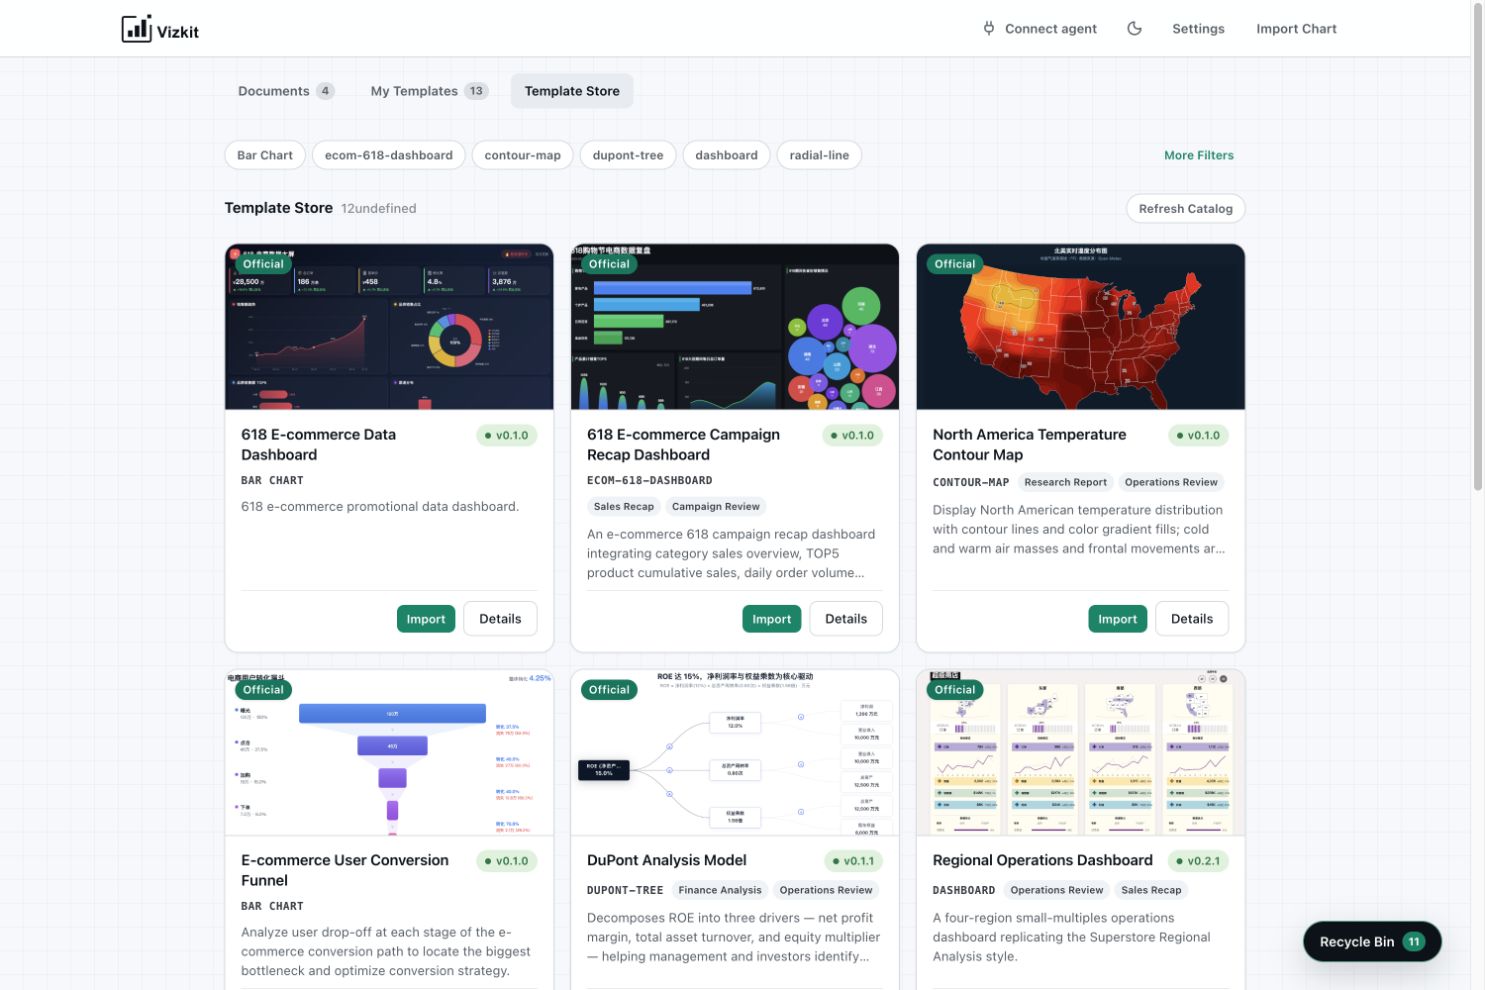
Vizkit is an AI-powered workspace for creating, refining, and applying professional chart templates.
Users can describe a visualization in natural language or start from an existing template. Vizkit generates a complete chart workspace with sample data, configurable properties, rendering logic, and business context. From there, users can:
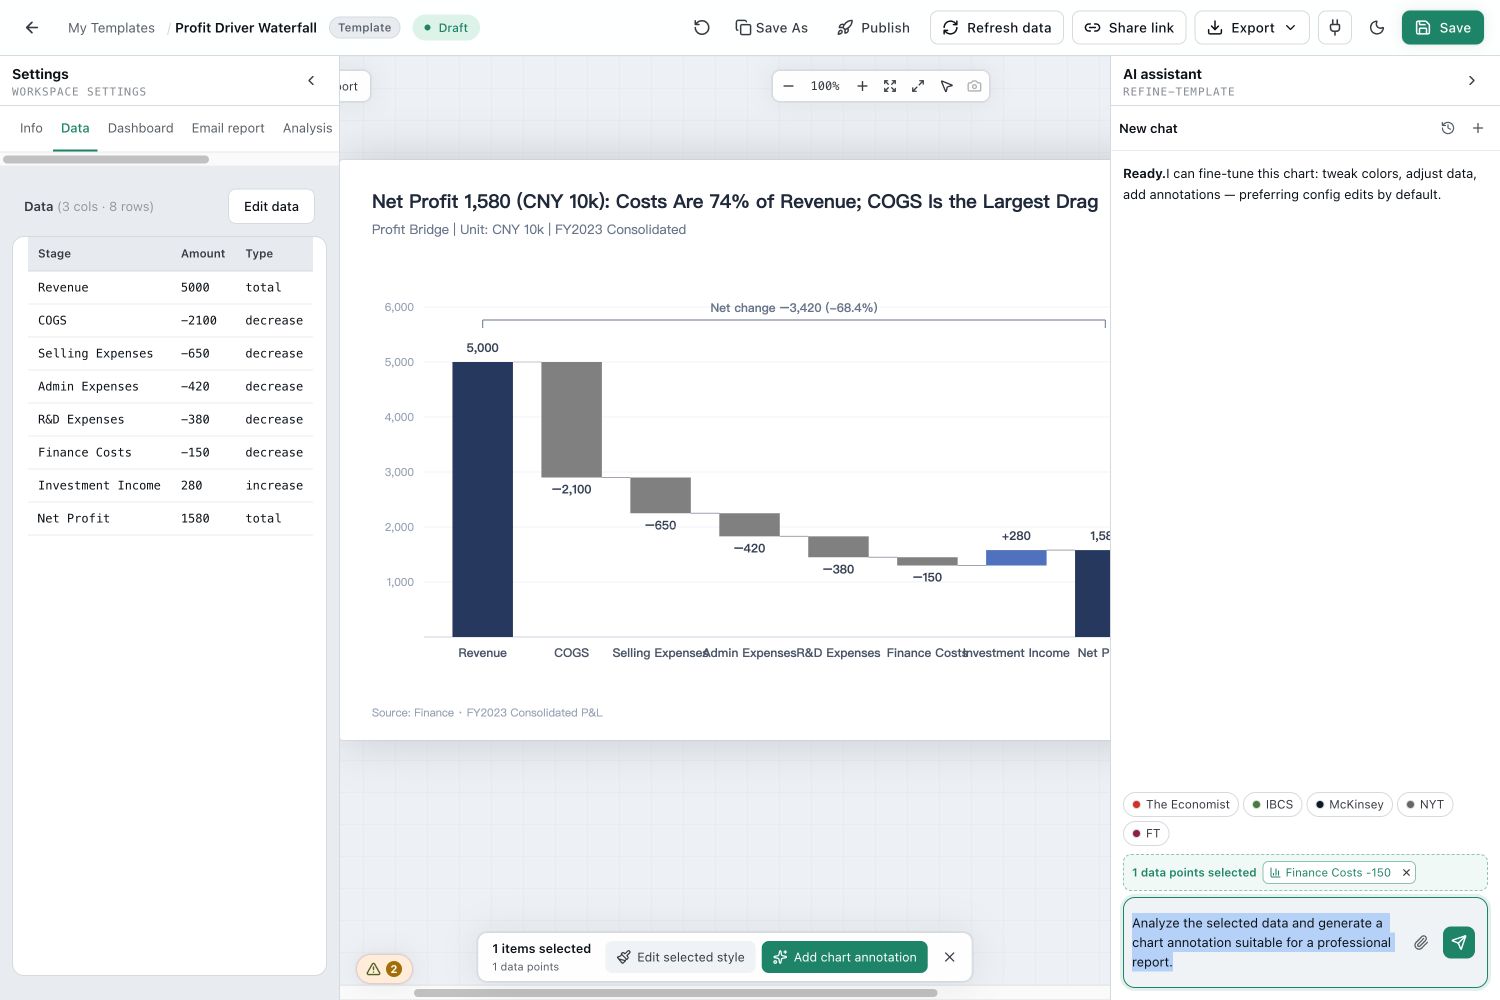
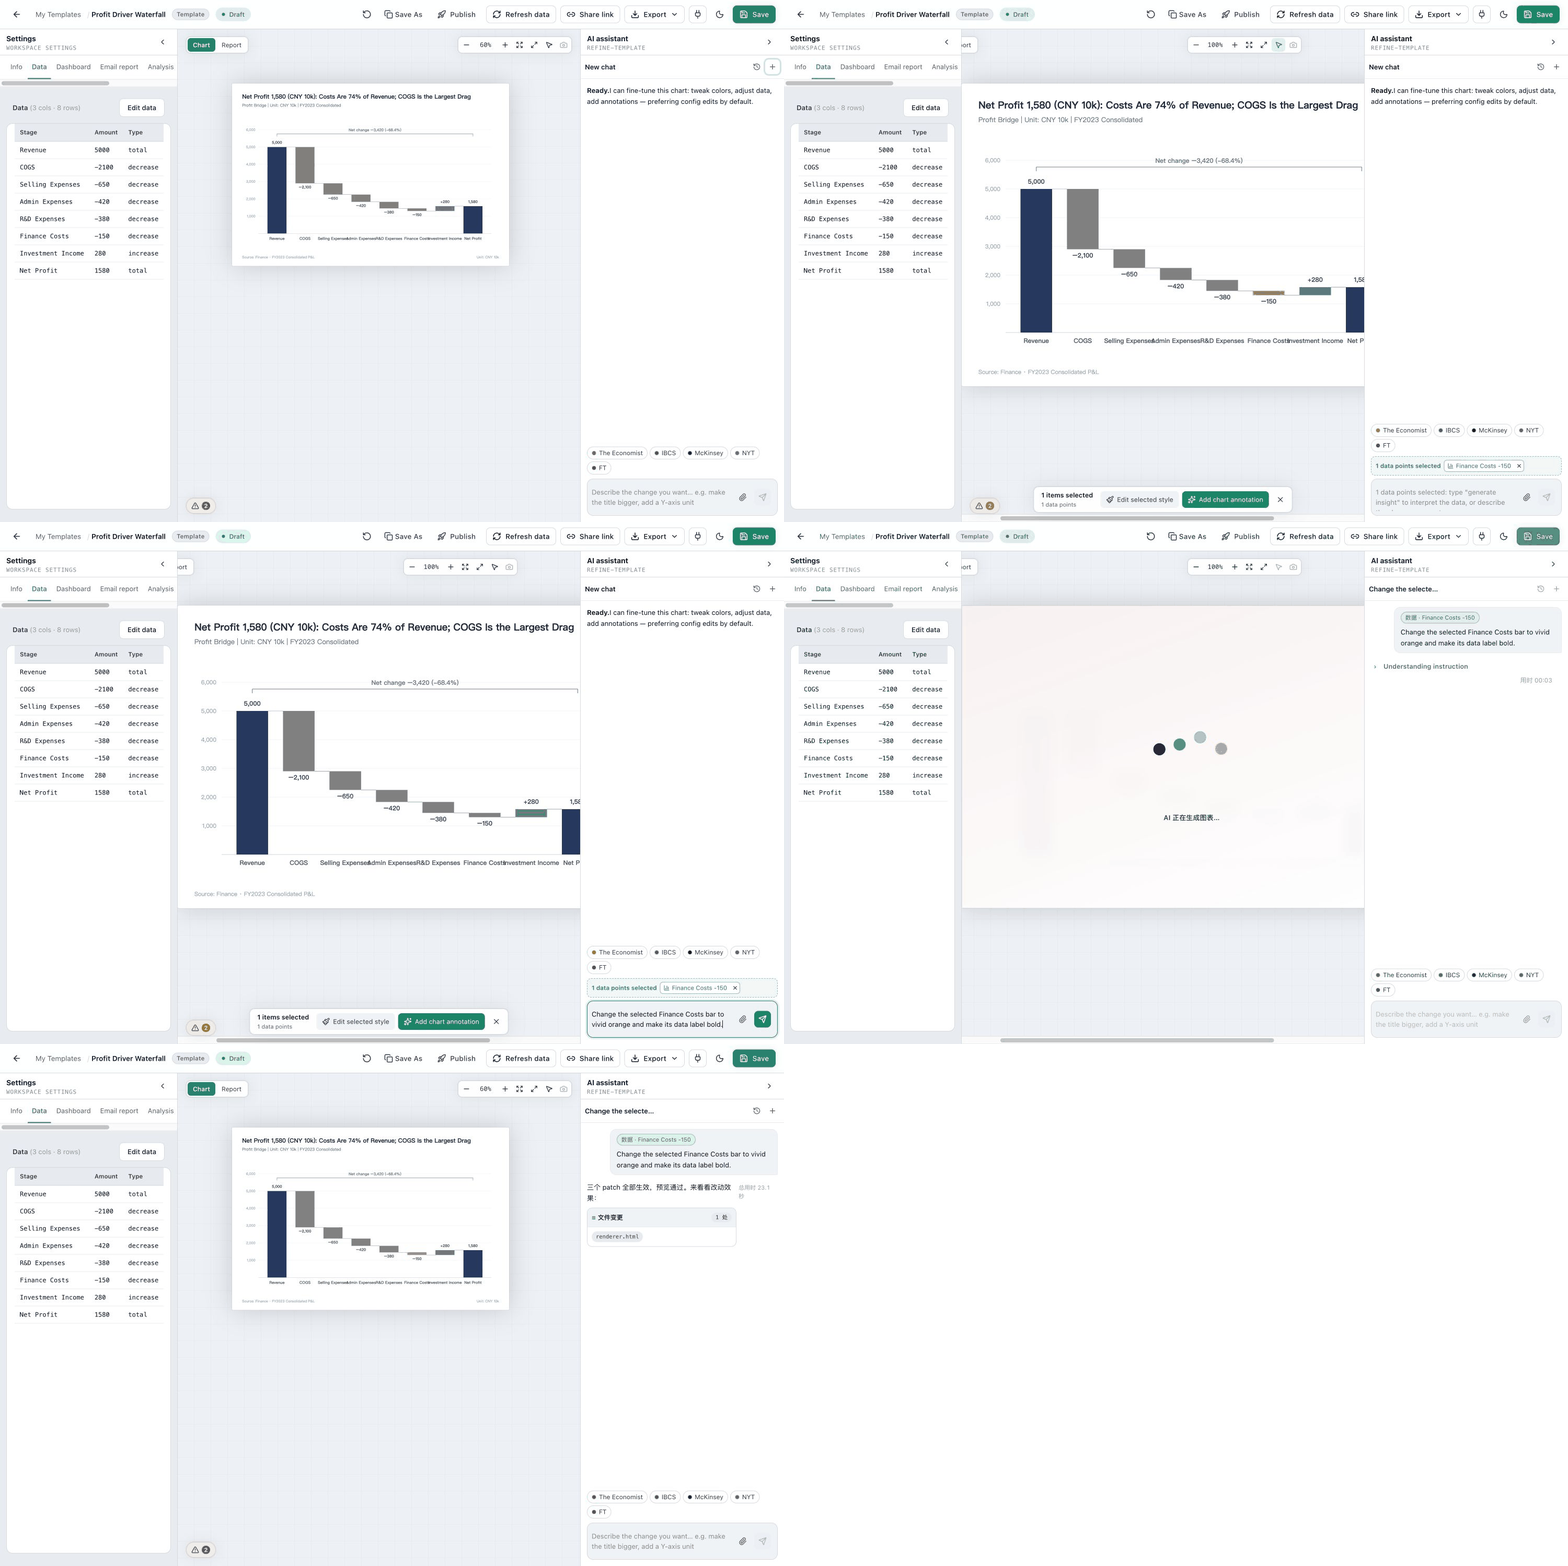
- Refine the chart through natural-language instructions such as “use a technology-blue palette,” “hide the legend,” or “highlight the East China region.”
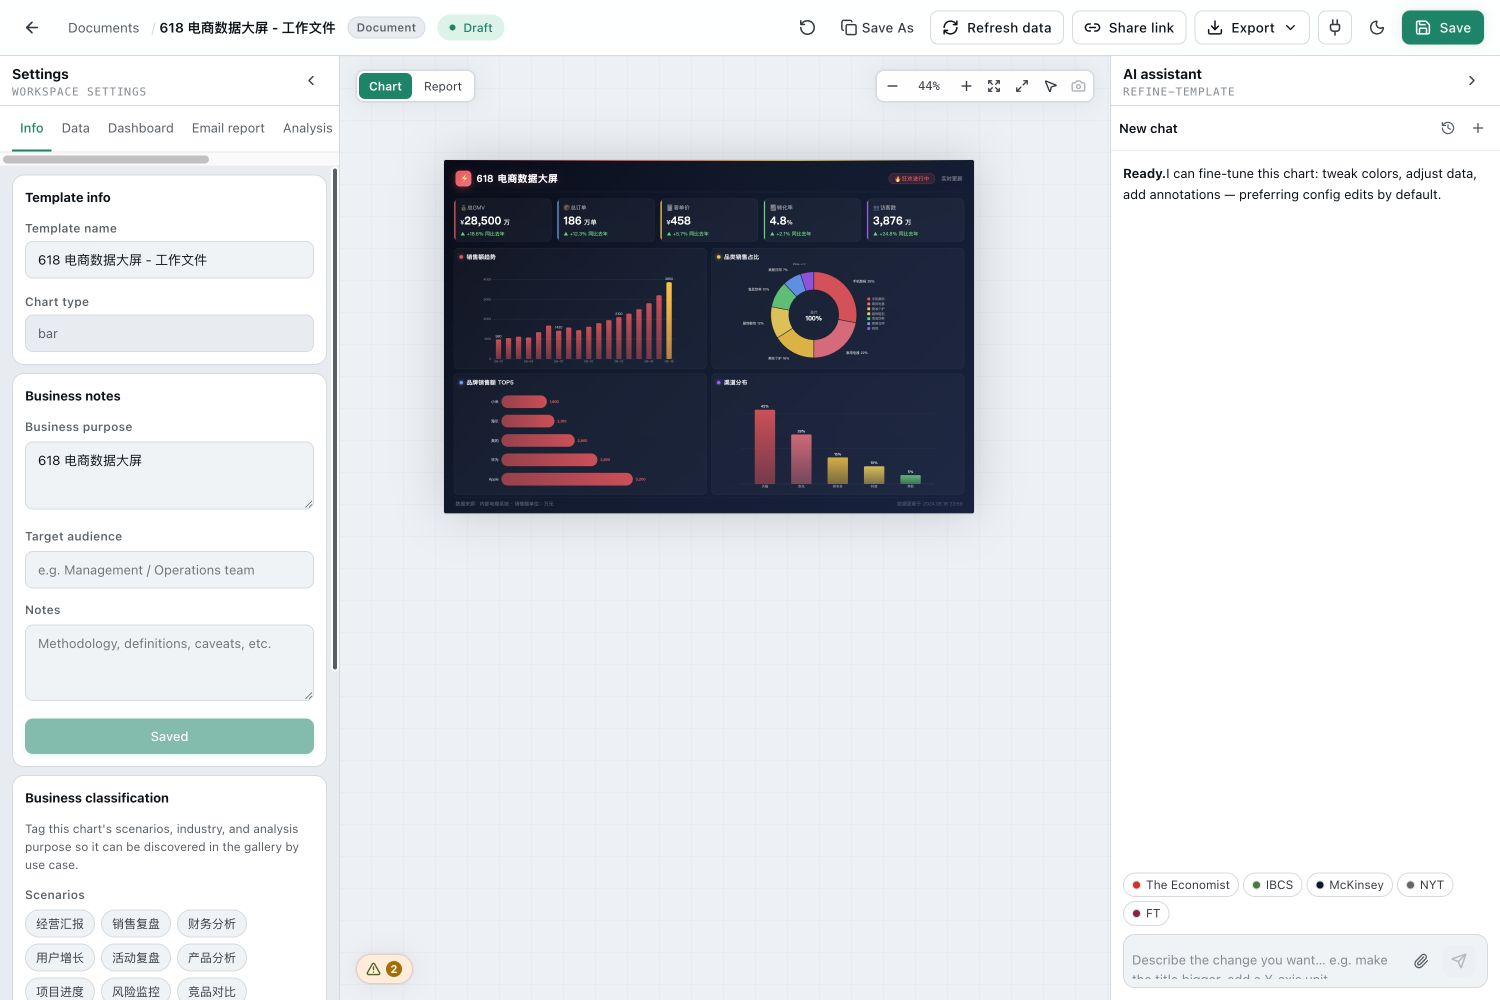
- Adjust titles, colors, labels, spacing, and other properties through a dynamically generated configuration panel.
- Paste tabular data or import Excel and CSV files and see the visualization update immediately.
- Create advanced visualizations beyond standard bar and line charts, including Sankey diagrams, gauges, heatmaps, decomposition trees, and custom D3 graphics.
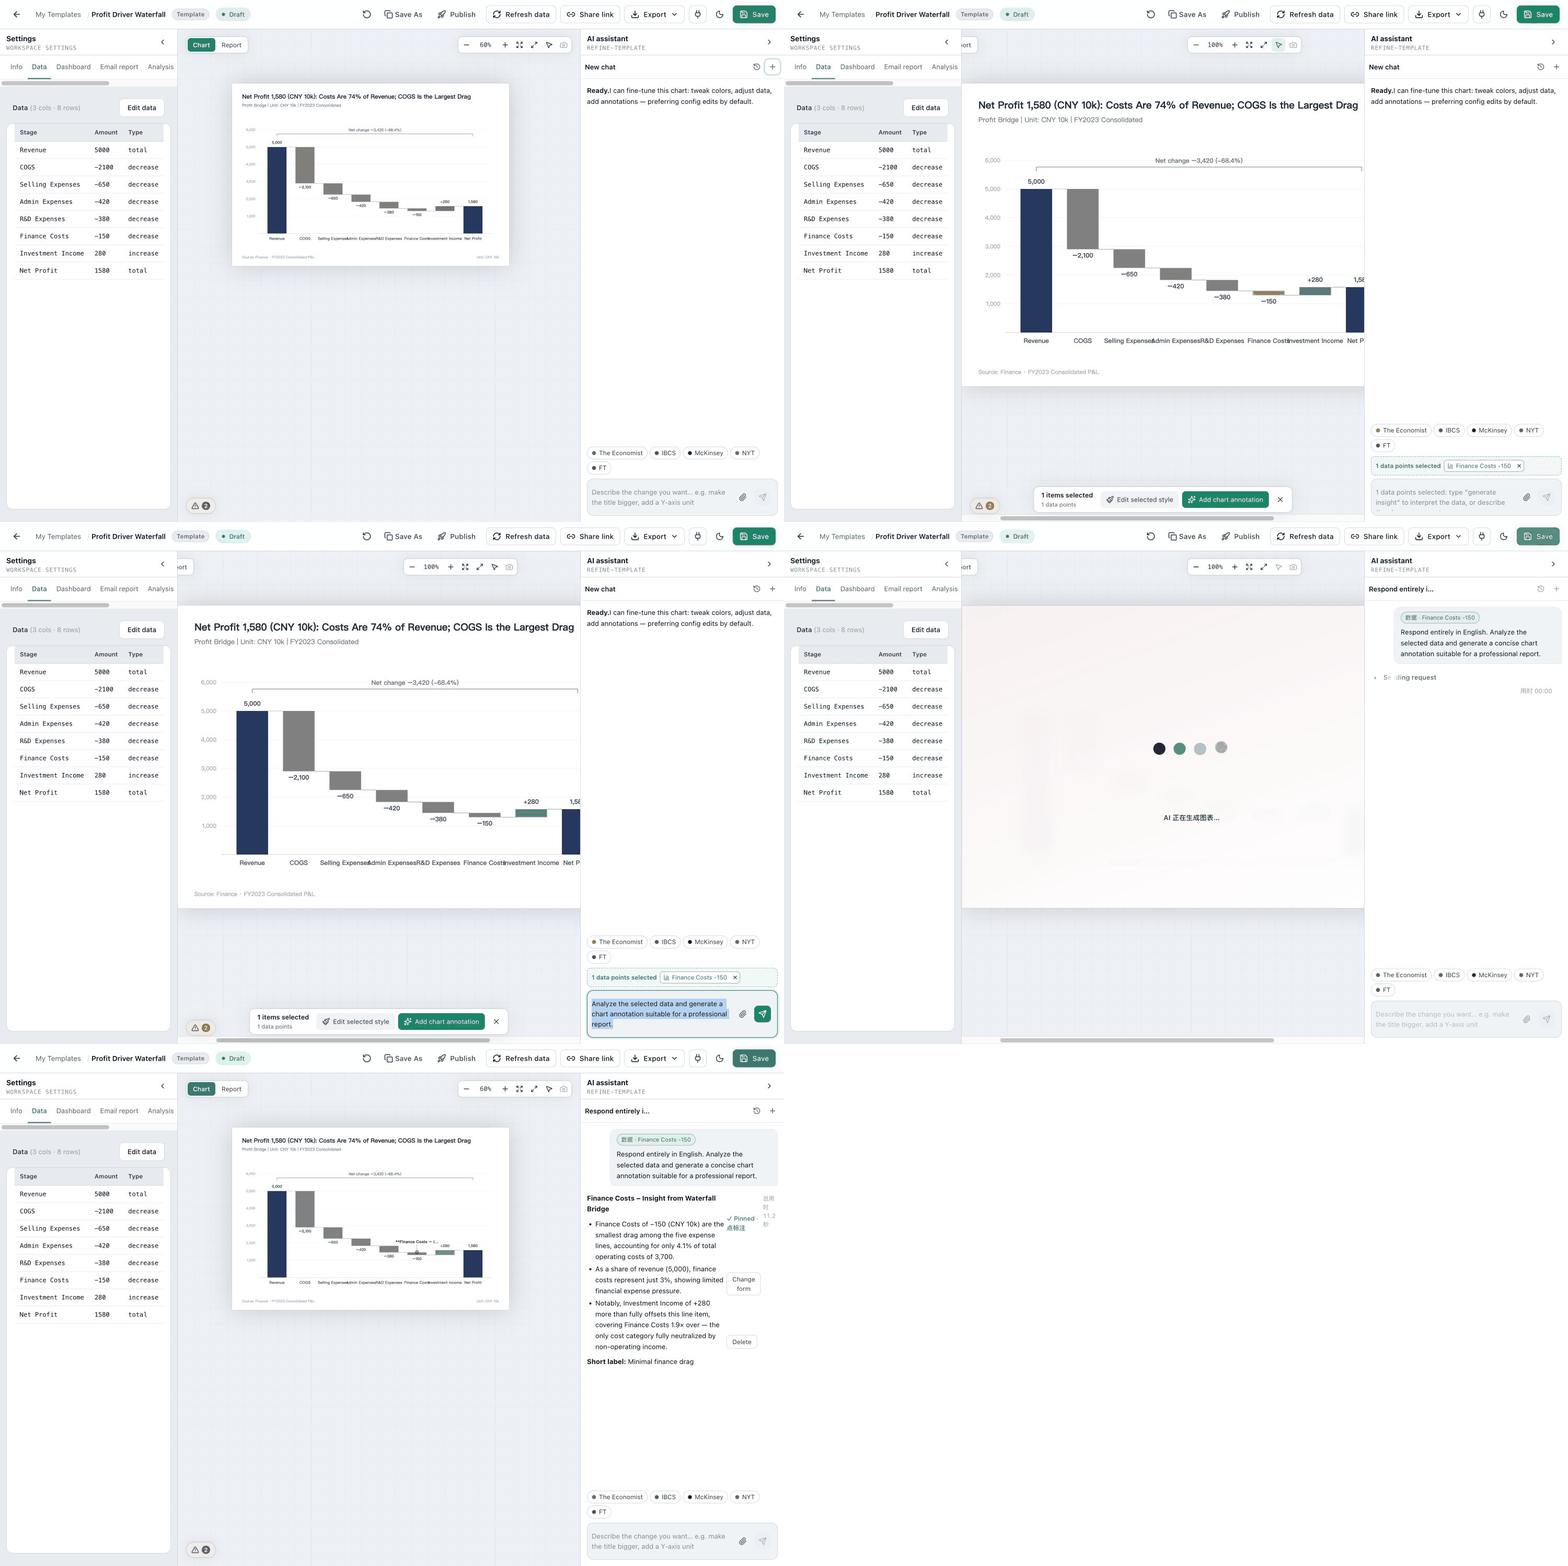
- Generate business insights, risks, recommendations, and illustrated analytical reports.
- Export charts as PNG or SVG and reports as PNG, PDF, or self-contained HTML.
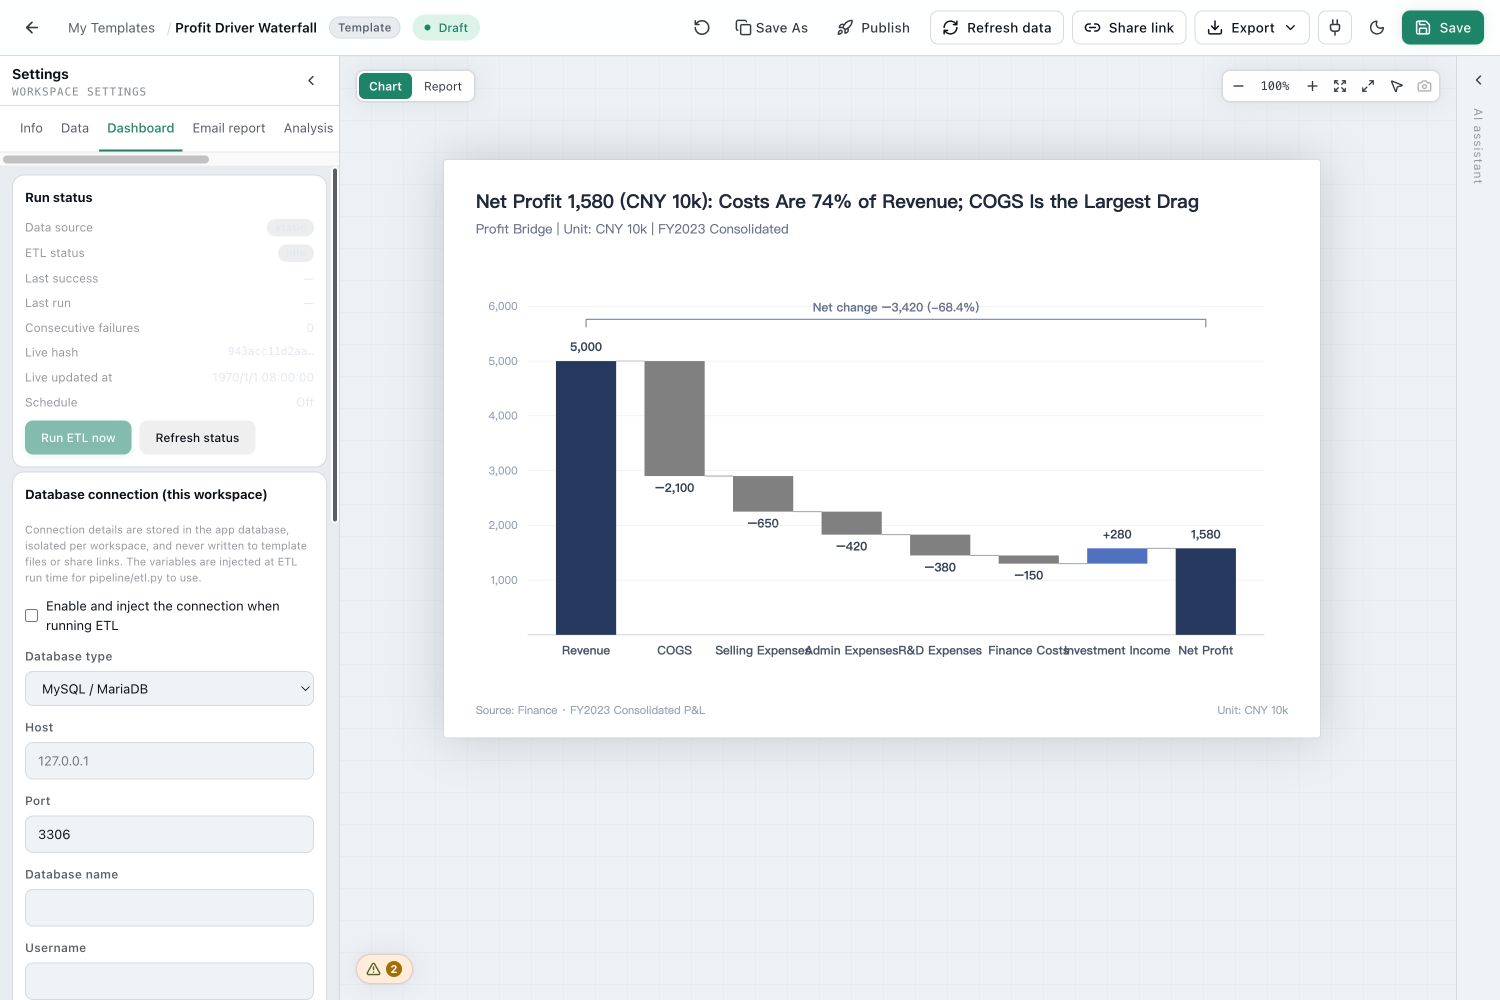
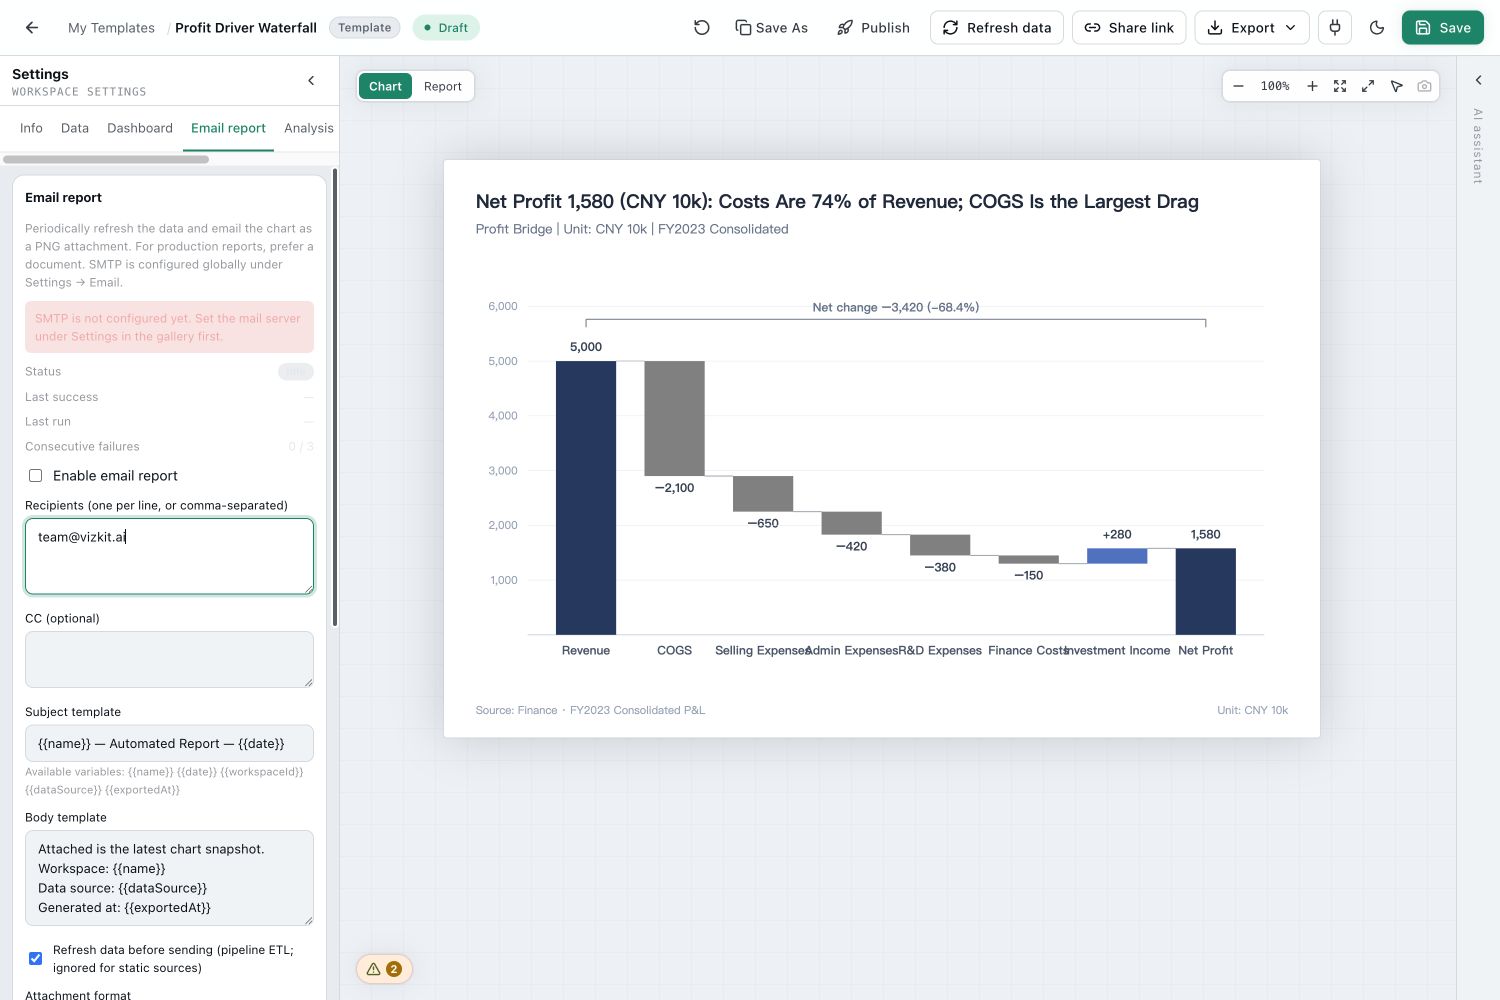
- Connect live data sources, schedule refresh pipelines, share dashboards, and send recurring email reports.
- Connect external agents such as Codex or Claude Code through a documented Skill and HTTP API.
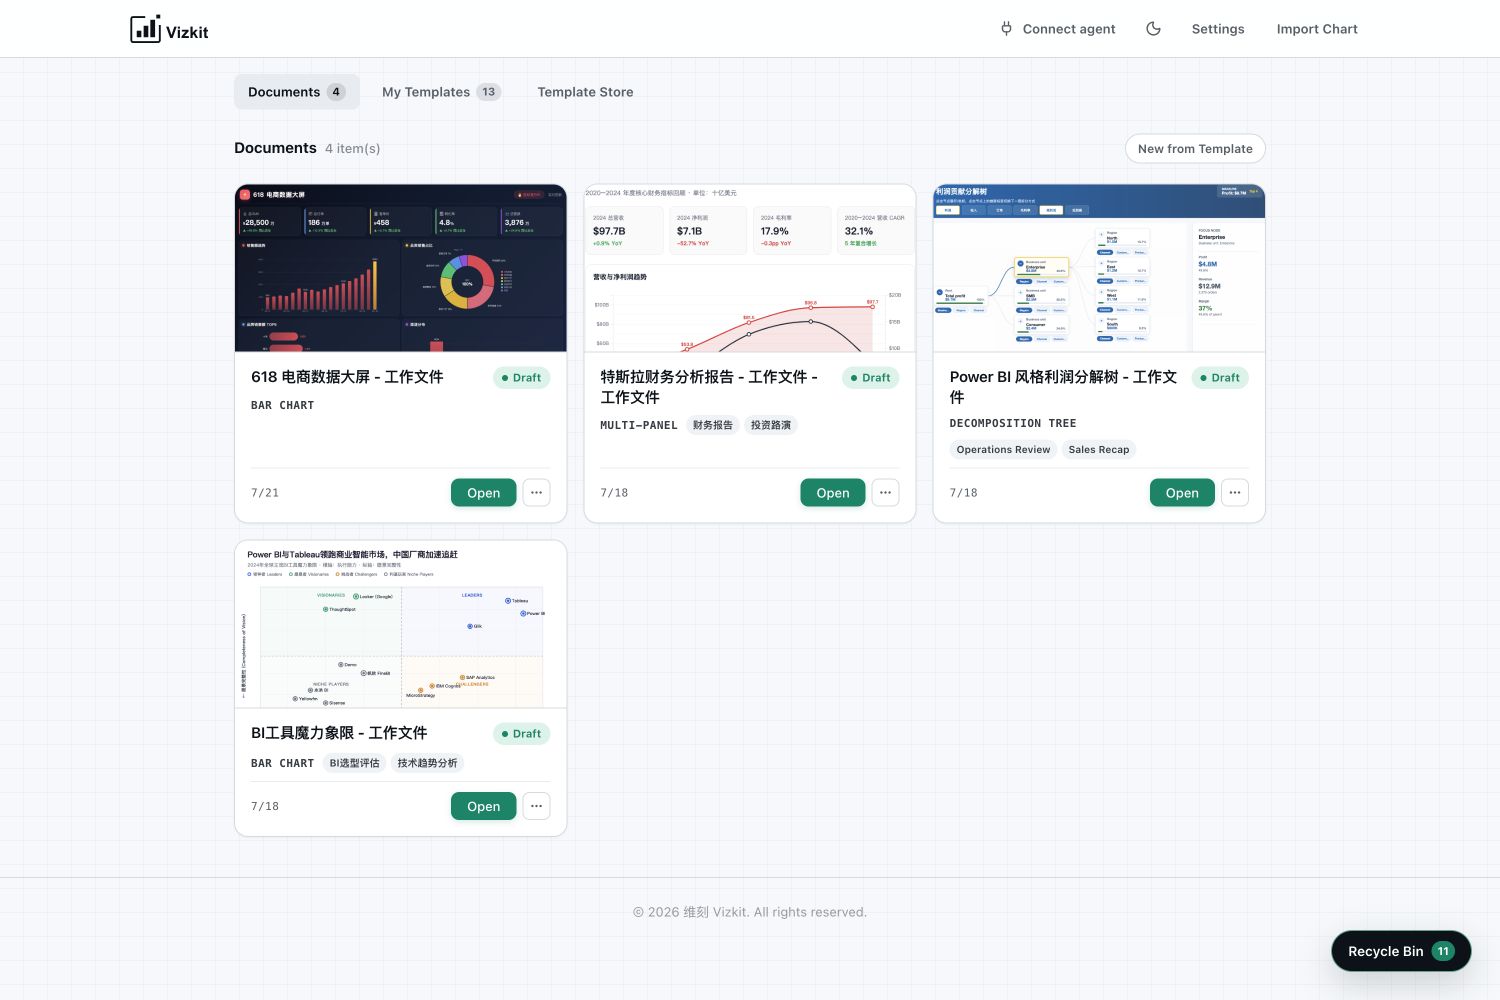
The result is not just an exported image. It is a reusable, versionable chart template that can be applied to new data and continuously improved.
How we built it
Vizkit is built with React, TypeScript, Vite, D3, Express, and Node.js. It can run as a web application or as a desktop application through Electron. We use SQLite for the local workspace index and Puppeteer for reliable rendering and export.
At the center of the system is a file-based workspace contract. Every chart contains its own manifest, data schema, sample data, configuration schema, configuration values, rendering code, analysis, preview artifacts, and version history.
Instead of restricting users to a predefined list of chart types, every template implements the same rendering contract: it receives data, configuration, metadata, and canvas dimensions, then produces a valid SVG visualization. This stable interface allows Vizkit to support almost any visual form without adding chart-specific logic to the application itself.
The AI runtime uses specialized skills and a tool-driven workflow. It can create or patch workspace files, inspect errors, validate the result, and retry when necessary. Changes are first applied in a temporary workspace and committed only after schema, compilation, configuration-consumption, and visual rendering checks pass.
We also exposed the same workflow through an HTTP API and an installable agent Skill. This means an external agent can create a workspace, write its files, validate the renderer, correct failures, apply real data, and export the result without direct filesystem access.
Challenges we ran into
The biggest challenge was balancing creative freedom with reliability. We wanted AI to generate arbitrary visualizations, but an unconstrained model can easily produce code that looks plausible while ignoring configuration, misreading data, or failing at runtime.
We addressed this by separating the stable workspace protocol from the flexible renderer implementation. AI is free to design the chart, but its output must satisfy explicit data, configuration, and rendering contracts.
Another challenge was making AI edits predictable. Rewriting an entire visualization for a small request can introduce regressions and destroy carefully tuned details. Vizkit therefore distinguishes between creation and refinement: creation can build the complete workspace, while routine refinement prefers small, targeted configuration changes.
Rendering also proved more difficult than simply generating SVG. The same chart must behave consistently in the live preview, exported images, reports, shared dashboards, and headless browser environments. We built validation and render-ready protocols to detect failures before a change reaches the user.
Finally, supporting both the built-in assistant and external agents required us to turn internal product behavior into a clear, agent-readable API and Skill—not just documentation written for humans.
Accomplishments that we're proud of
We are proud that Vizkit turns AI-generated visualization code into a maintainable product workflow.
A chart created by an AI agent is immediately editable through the visual interface, reusable with different datasets, exportable in multiple formats, and compatible with the same validation system as a manually created template.
We are also proud that Vizkit supports open-ended visualization types without sacrificing a consistent user experience. A bar chart, Sankey diagram, gauge, or completely custom D3 composition can all use the same workspace, configuration, versioning, preview, and export pipeline.
Most importantly, Vizkit is not tied to one AI interface. Users can work with the built-in assistant or bring their preferred external agent. The agent provides the reasoning and creative capability; Vizkit provides the structured workspace, rendering engine, validation loop, and reliable output.
What we learned
We learned that reliable AI creation depends less on writing one perfect prompt and more on designing a strong feedback loop. Clear contracts, constrained tools, validation, error messages, and retry mechanisms make AI output dramatically more useful.
We also learned that a visualization template needs to capture more than appearance. Data semantics, configurable behavior, intended business use, and analytical context are what make a chart reusable.
Another important lesson was that human and AI editing should operate on the same artifact. When AI output is stored as an opaque code string, users quickly lose control. A structured, file-based workspace makes every change inspectable, versionable, and easier to improve.
Finally, designing for external agents pushed us to create cleaner boundaries. If another agent can understand and safely operate the system through a Skill and API, the product architecture is usually becoming clearer for humans as well.
What's next for Vizkit
Next, we want to turn Vizkit from an individual chart workspace into a collaborative visual communication platform.
We plan to add more data connectors, richer multi-chart dashboard composition, real-time collaboration, cloud synchronization, and team template libraries. Organizations will be able to define brand systems and visualization standards that both humans and AI agents follow automatically.
We also want to improve automatic chart selection and analytical reasoning, so Vizkit can recommend not only how data should look, but which visual structure communicates the underlying business question most effectively.
Our long-term vision is for Vizkit to become the visual execution layer for AI agents: a place where data, reasoning, design, and business communication come together as reliable, reusable artifacts.

Log in or sign up for Devpost to join the conversation.