Inspiration
We love using Spotify and wanted to have a way to visualize how big our favorite artists are compared to other top artists.
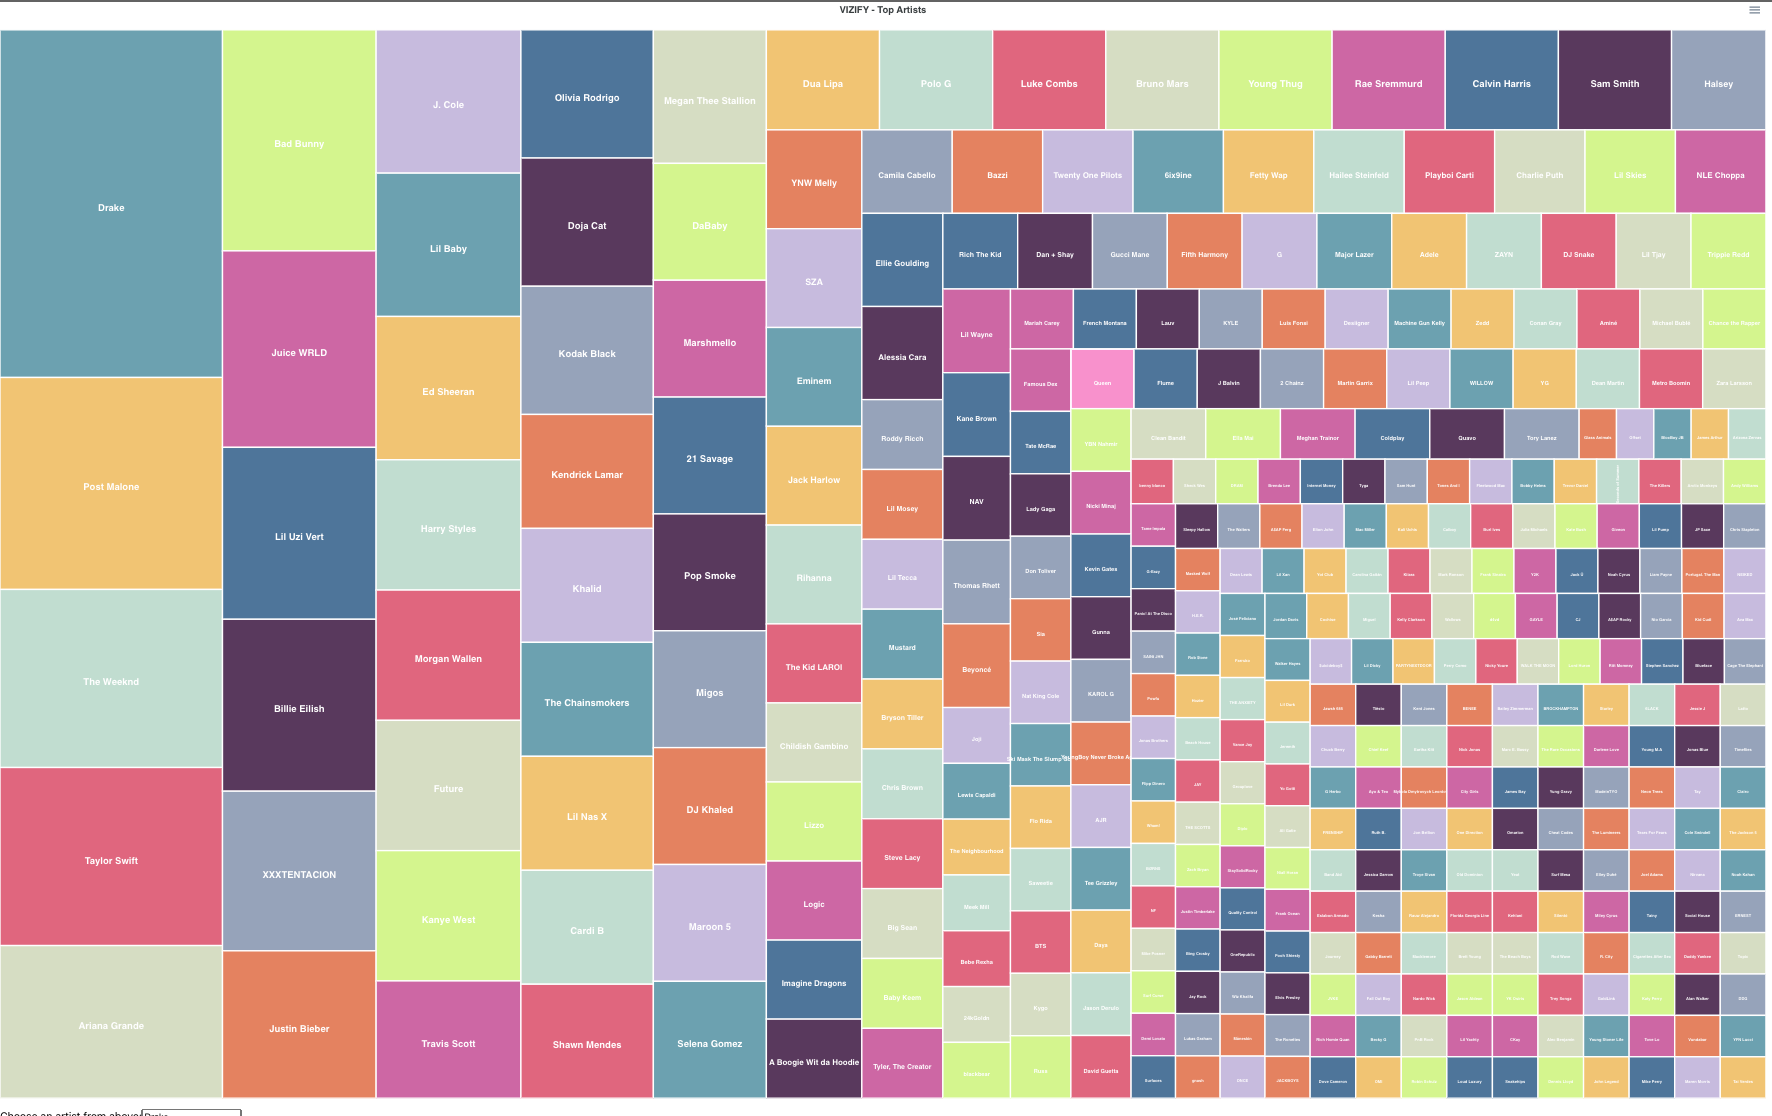
What it does
Vizify utilizes Spotify API and a Spotify dataset to graph beautiful treemaps related to Spotify's favorite artists.
How we built it
We used React.js for the front-end and express.js for the backend.
Challenges we ran into
We had issues with using React mappers, Cors errors and

Log in or sign up for Devpost to join the conversation.