-
-
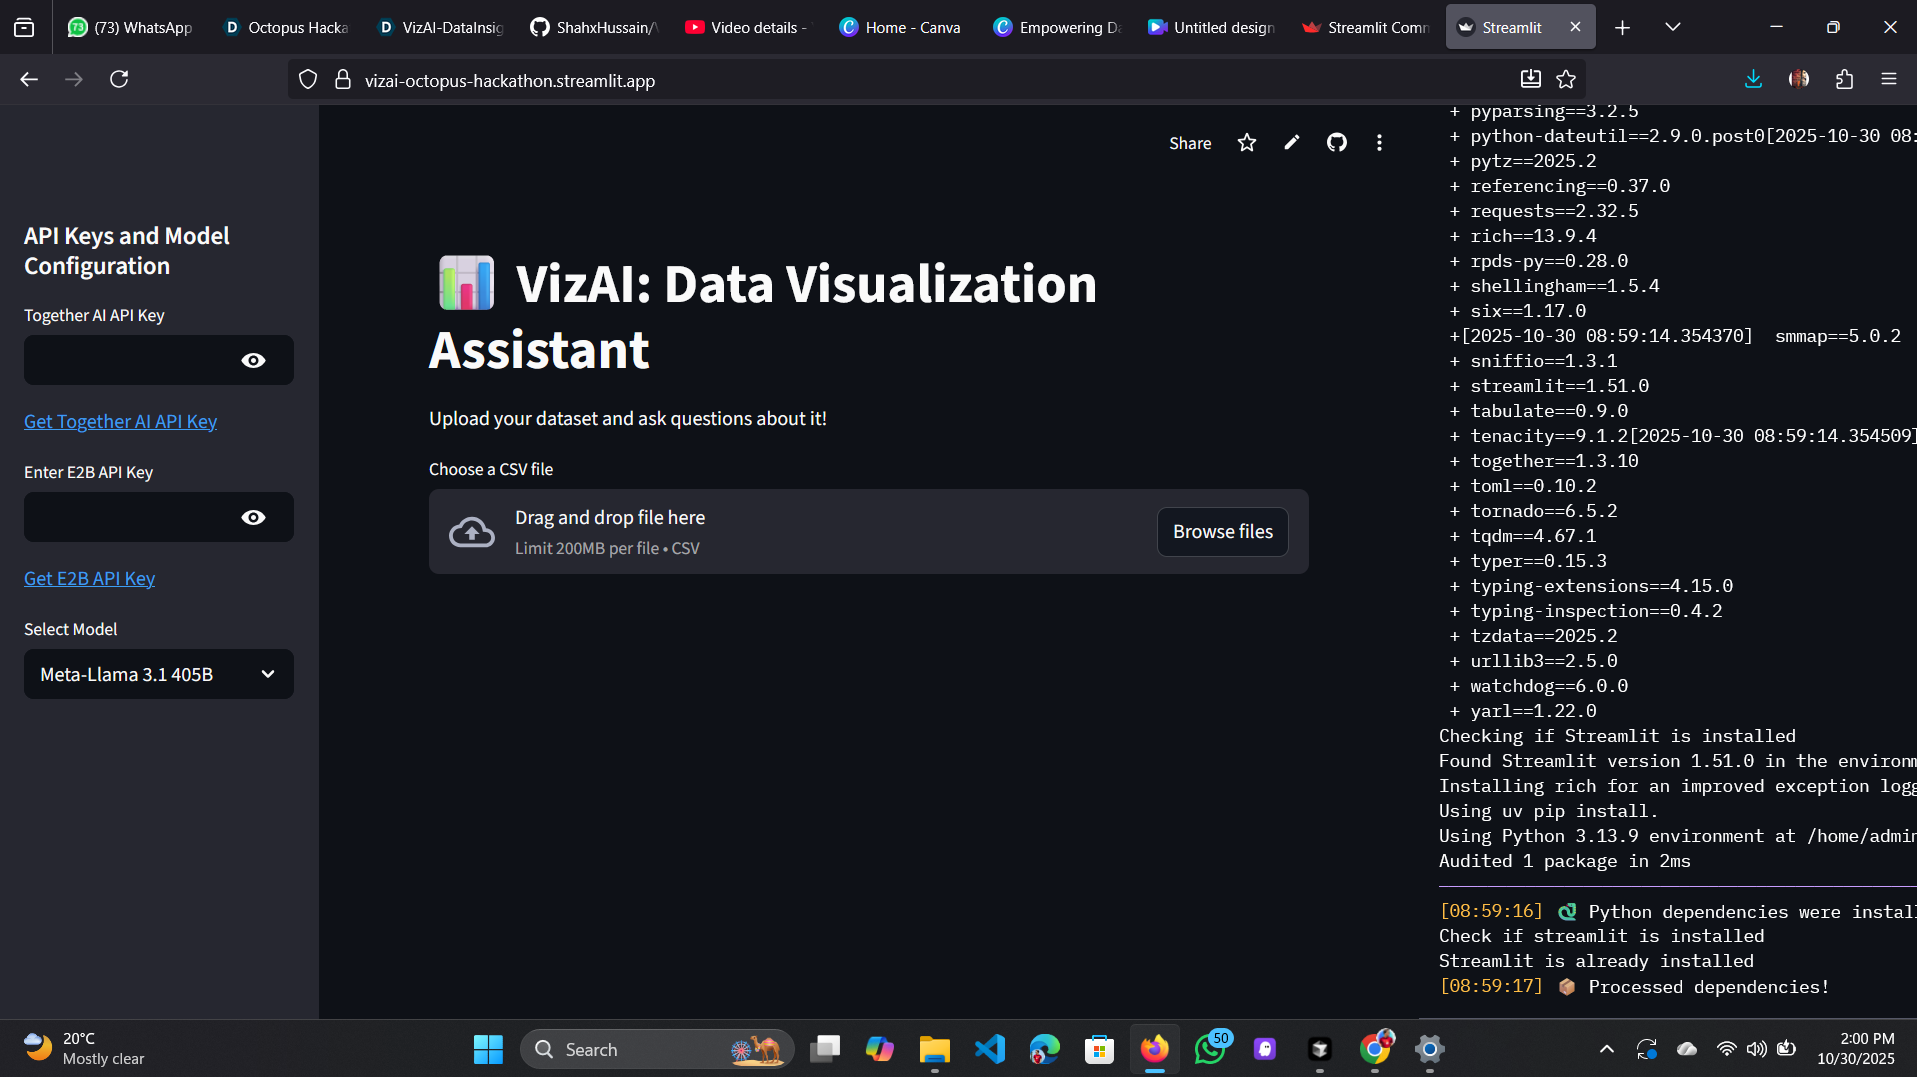
Cover Photo
-
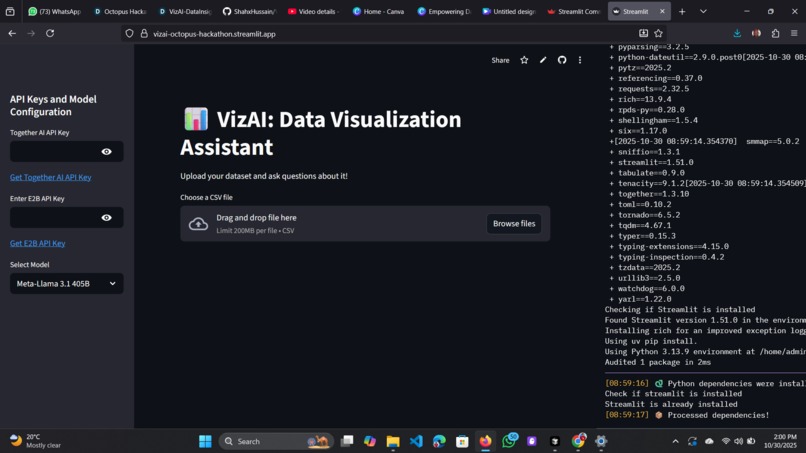
Deployment Check
-
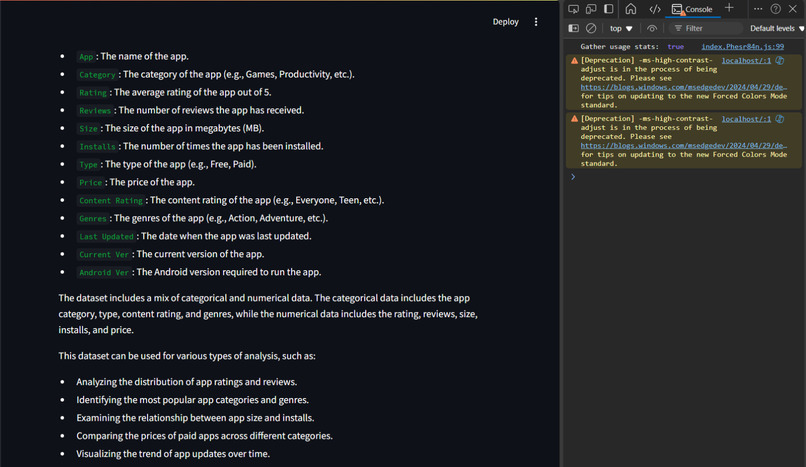
Summarized response from LLM after analyzing data based on user query
-

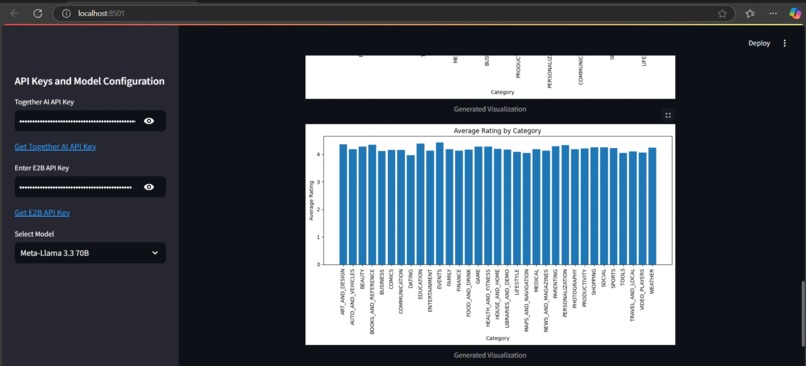
Data Visualizations
-

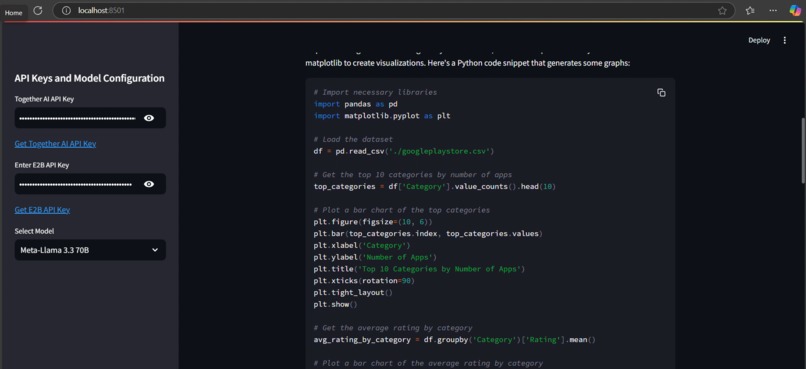
Code Snipped - Generated by LLM - To be executed on E2B

Inspiration
The inspiration behind VizAI came from my personal experience working with data. As a software engineering student, I found that many people, even those who work with data regularly, struggle to understand complex datasets. I wanted to create a tool that would make data analysis more accessible to everyone, regardless of their technical background. The idea of using AI to convert user queries into data-driven insights felt like the perfect way to bridge the gap and help people make sense of their data more easily.
What it does
VizAI allows users to upload datasets and ask questions in simple, natural language. The AI then analyzes the data and provides answers, visualizations, or even generates code based on the user's query. This generated code is executed in a safe environment using E2B (a sandbox), ensuring that the results are both accurate and secure. The tool makes data analysis easy for non-technical users by turning complicated tasks into simple conversations. Whether you're looking for a quick summary of the data, detailed visualizations, or want to generate custom analysis code, VizAI provides instant, easy-to-understand results. It even shows visualizations from the generated code, making it easy for users to explore the data and gain insights quickly and effectively.
Its Impact
VizAI has the potential to redefine how individuals and organizations interact with data. By removing technical barriers and enabling natural language interaction, it empowers non-technical users, analysts, educators, and small businesses to gain insights from their data effortlessly.
What once required advanced programming and analytical expertise can now be done with a simple question, making data-driven decision-making more inclusive and efficient.
💡 For Analysts: Saves time by automating repetitive coding and visualization tasks.
🧑💼 For Non-Technical Users: Turns complex data exploration into simple, conversational interactions.
🏢 For Organizations: Enhances productivity by accelerating data interpretation and reporting.
🧑🎓 For Students & Researchers: Provides an easy platform for exploring and understanding datasets interactively.
By combining AI, automation, and intuitive design, VizAI not only simplifies analytics but also democratizes access to data intelligence, helping bridge the gap between raw information and actionable insight.
How I built it
I developed VizAI using a combination of powerful tools and technologies:
Backend: The backend is powered by Together AI for natural language processing, enabling users to interact with the system through simple, conversational queries. It also integrates E2B, a secure sandbox environment for executing code safely allowing the system to process data and generate dynamic, accurate responses.
Frontend: The user interface is built with Streamlit, which made it easy to design an intuitive and interactive web application. Users can seamlessly upload their datasets and instantly explore meaningful insights. Streamlit’s flexibility also allowed me to embed rich charts and visualizations directly into the app.
Data Processing: For data handling and visualization, I utilized pandas for data manipulation and Plotly and Matplotlib for creating interactive and informative visualizations. These tools helped ensure the data was clean, the insights were clear, and the presentation was user-friendly.
🧰 Tools & Technologies
| Category | Tool / Technology | Purpose / Description |
|---|---|---|
| Frontend | Streamlit | Builds an interactive and user-friendly interface for uploading datasets and asking questions in natural language. |
| Backend (AI & Execution) | Together AI | Processes natural language queries using LLMs and generates corresponding Python code. |
| E2B Sandbox | Securely executes AI-generated Python code in an isolated environment. | |
| Data Processing & Visualization | pandas | Handles data manipulation and preprocessing. |
| Matplotlib | Creates static and publication-quality visualizations. | |
| Plotly | Generates interactive and dynamic charts for better data insights. | |
| Development Tools | Python | Core programming language for backend development and logic handling. |
| VSCode | Primary IDE used for coding and debugging. | |
| Version Control & Collaboration | Git / GitHub | Used for version control, collaboration, and open-source sharing. |
| Additional Libraries | re, warnings |
Used for pattern matching, handling exceptions, and suppressing warnings. |
| Future Enhancements | PDF Reporting Module | Will generate downloadable PDF reports with insights and visualizations. |
| Real-Time Database Insights | Planned integration for querying live databases and generating real-time analytics. |
Challenges I ran into
One of the biggest challenges I faced was generating visualisations dynamically based on the user’s query. The goal was for the AI to not only interpret the user’s question but also generate the appropriate Python code to answer it. Once the code was generated, I had to make sure that it would execute correctly in the E2B sandbox environment, while also ensuring that any visualizations or results from the code were displayed correctly in the app. It took quite a bit of work to connect all these steps seamlessly: receiving the query, generating the code through the Together AI LLM, running the code in the E2B environment, and then showing the final output, which could be anything from charts or graphs.
Accomplishments that i'm proud of
I’m really proud of how well the system can interpret user queries and generate relevant insights from the data. It’s amazing to see how quickly the AI can process a dataset, analyze it, and present meaningful visualizations. Another accomplishment is the ease of use creating an interface where even someone with no technical background can upload a dataset and get answers was a key goal, and it feels great to have achieved that.
What I learned
I have prior knowledge of how to connect LLMs, agents, and other AI models, but I wasn’t aware of E2B, an online interpreter that runs AI-generated code. It was a bit challenging to integrate E2B into the process because I had to learn how to ensure the AI’s generated code would run smoothly and safely in the E2B environment. But once I figured it out, I realized the potential it has for running code dynamically based on user input. In the future, I’ll definitely use E2B in more complex projects, as it opens up new possibilities for executing machine-generated code directly from AI models
What's next for VizAI | DataInsights & Visualization Assistant
The next step for VizAI is to introduce:
Module 2: Insights & Detailed Report in PDF Form.
This module will provide a comprehensive report on the data, summarizing key insights in a downloadable PDF format. The report will include visualizations, trends, and actionable recommendations, making it easy for users to share insights with team members, clients, or stakeholders.
Additionally,
Module 3:
DataBase insghts Directly users will be able to directly query the database to extract real-time insights, receive automated visualizations, and generate instant reports for continuous analysis. Both of these features are currently under development and will significantly enhance the user experience by providing more comprehensive, easily shareable insights and reports.


Log in or sign up for Devpost to join the conversation.