-
-
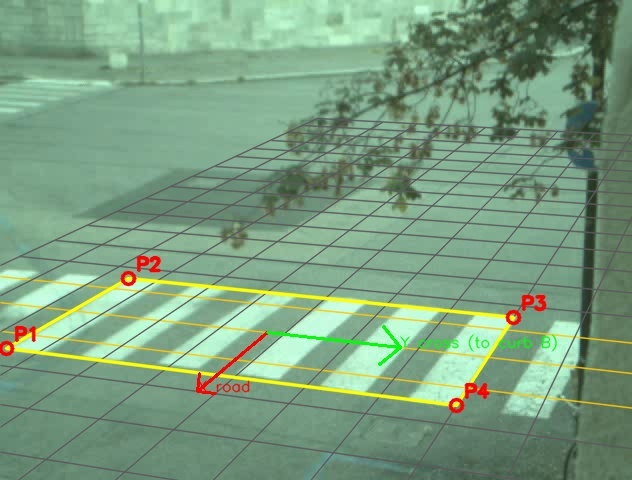
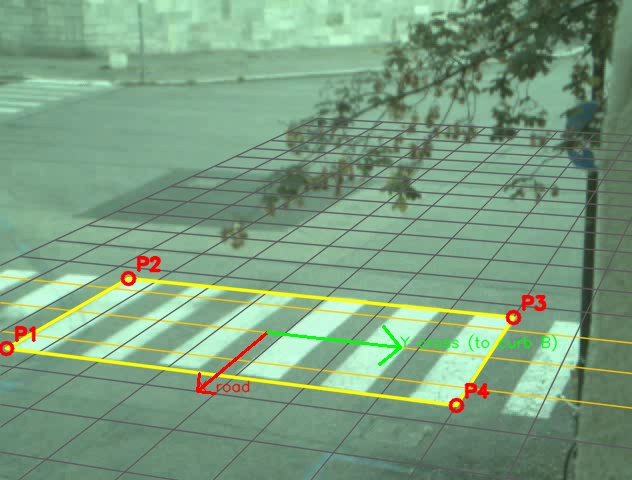
measuring of the crosswalks for speed reference
-
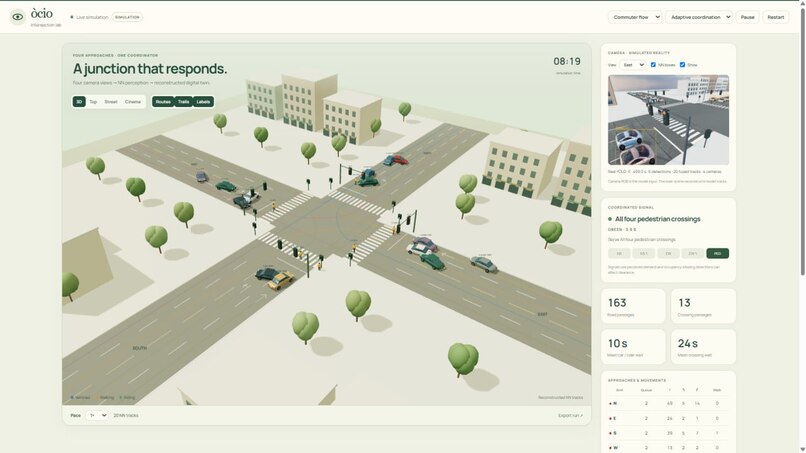
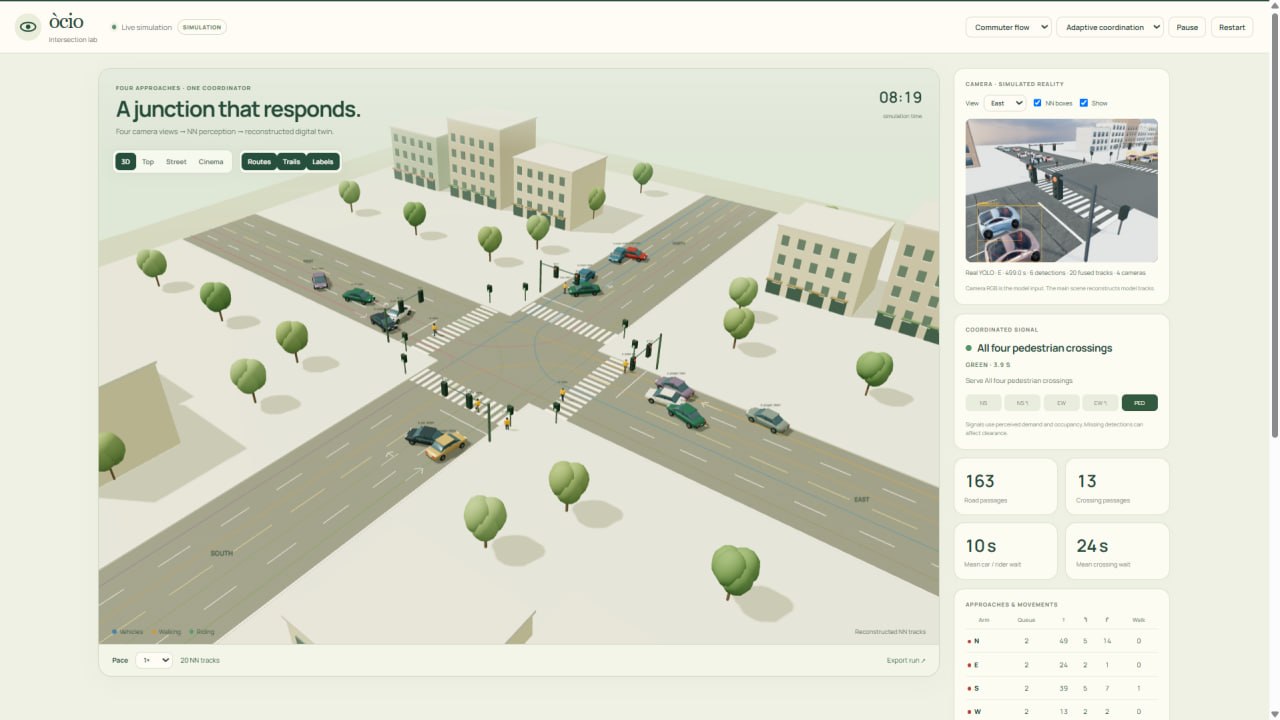
Next steps: full cross simulation
-
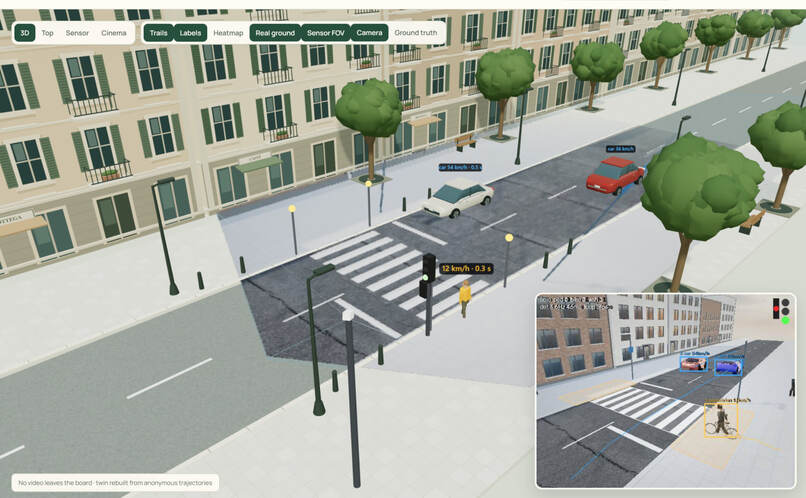
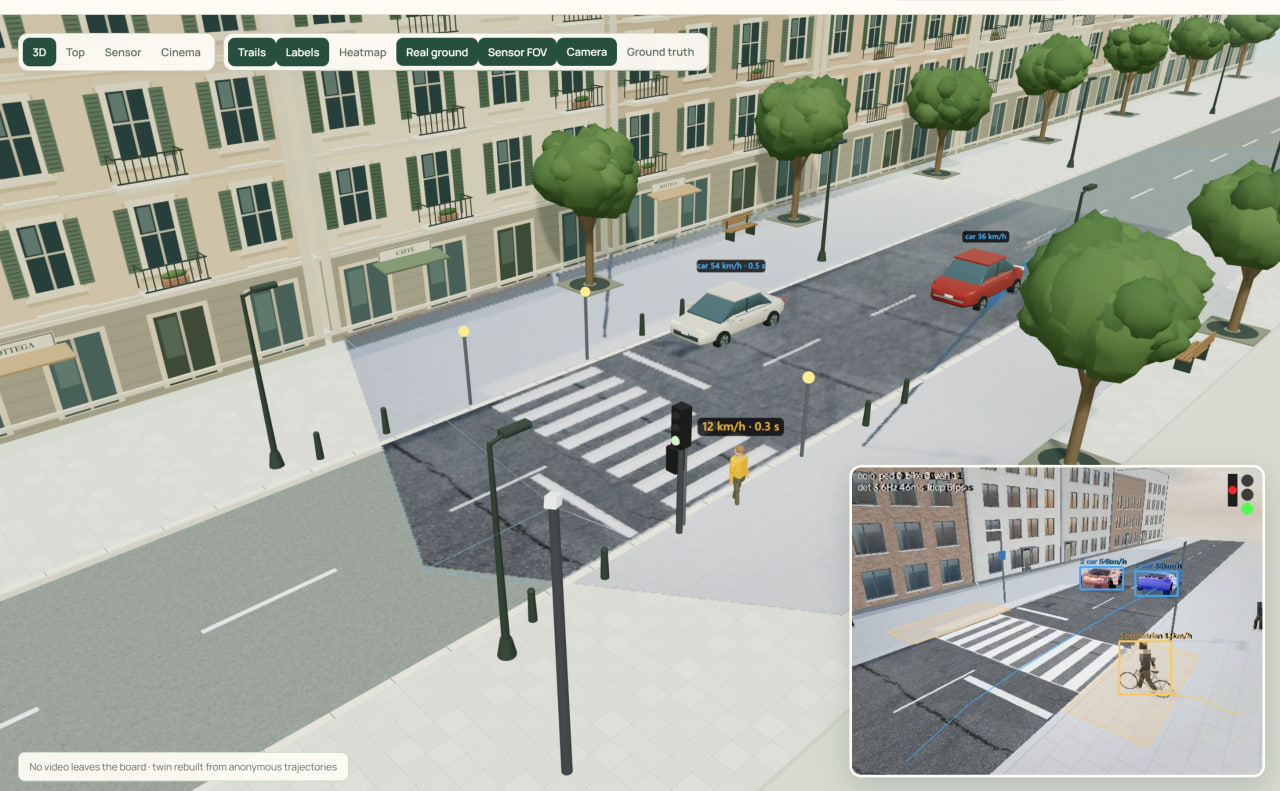
Real Model running on simulation
-
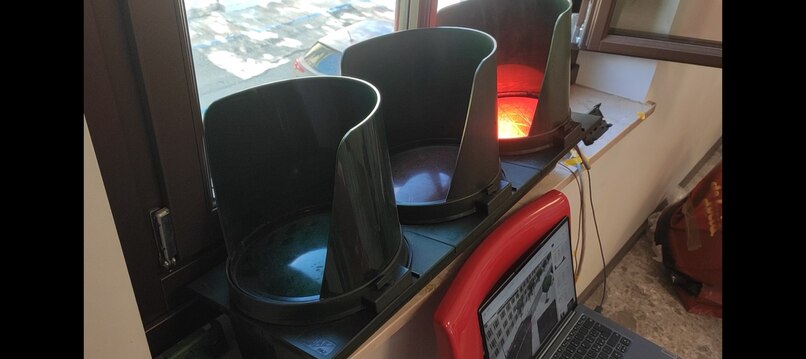
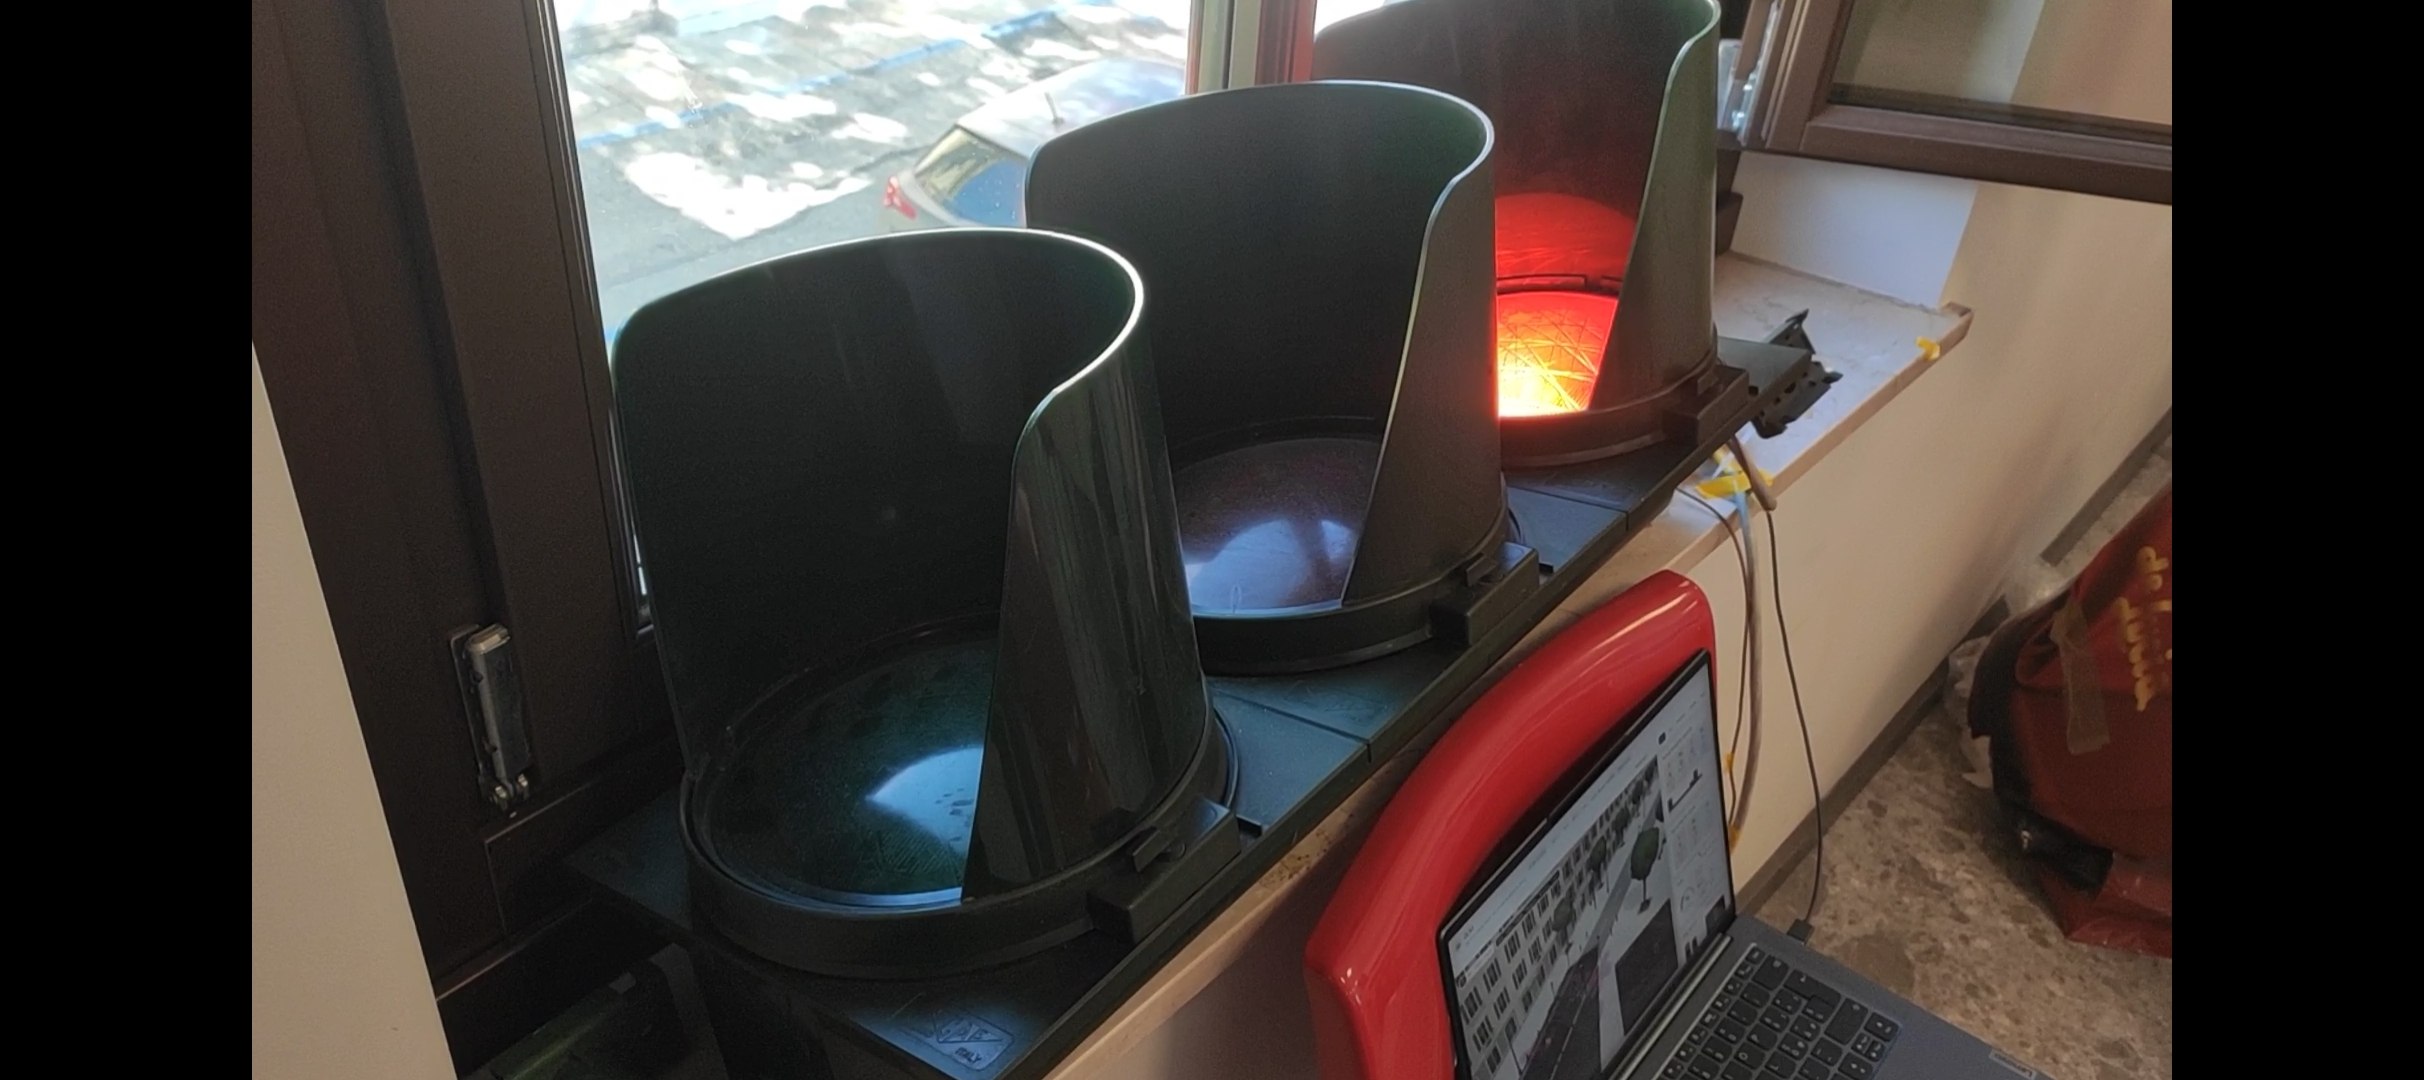
Signal control
-
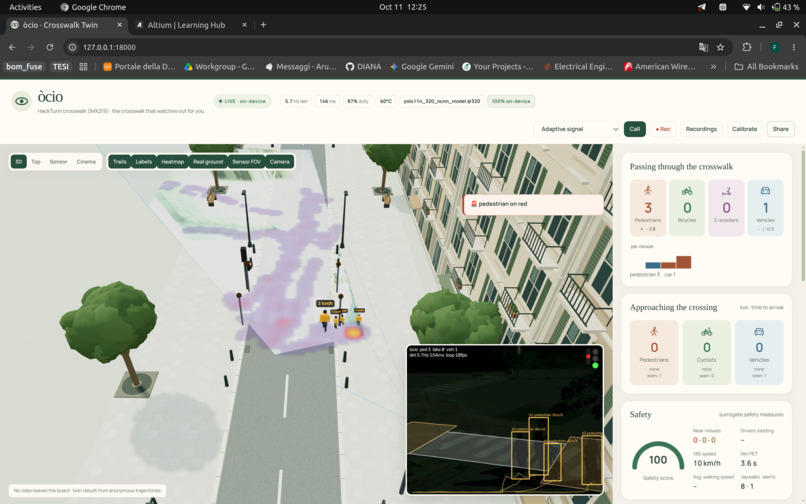
Model running locally on the prototype with real live footage
-
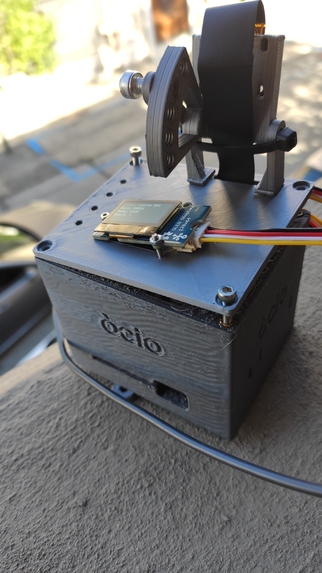
Final prototipe
-
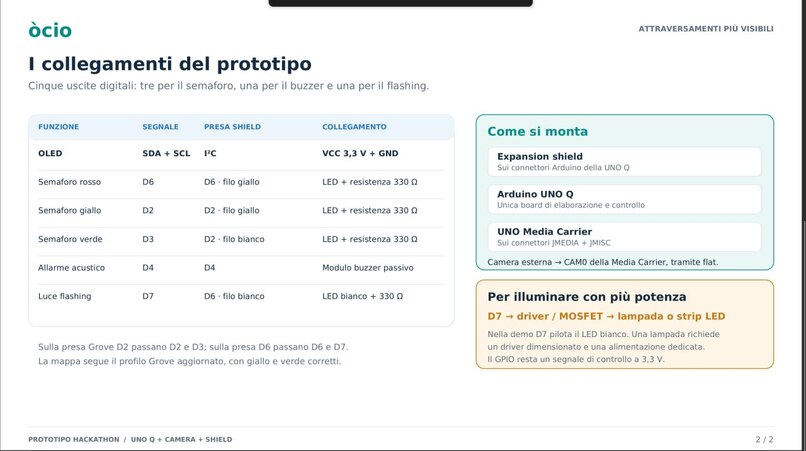
electronics scheme
-
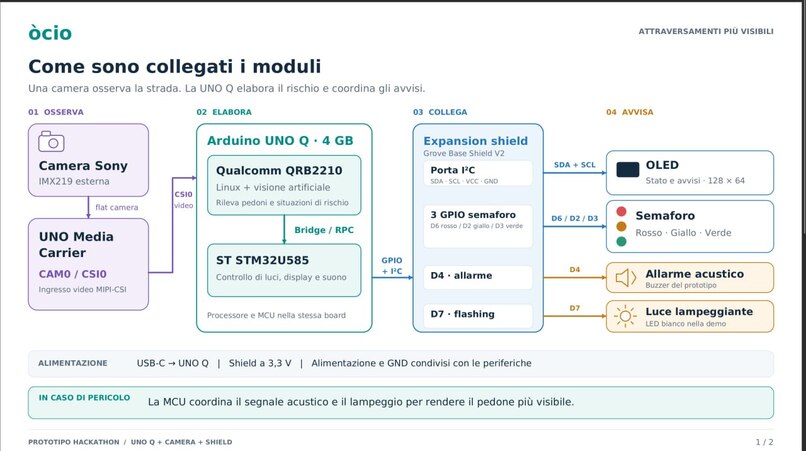
electronics scheme
Inspiration
We wanted to make crossings respond to the people using them. A pedestrian waiting at the kerb needs a chance to cross, while someone moving slowly may need extra time. Cities also need clearer information about crossing activity and dangerous interactions. This inspired òcio: a compact system that observes, measures and responds locally.
What it does
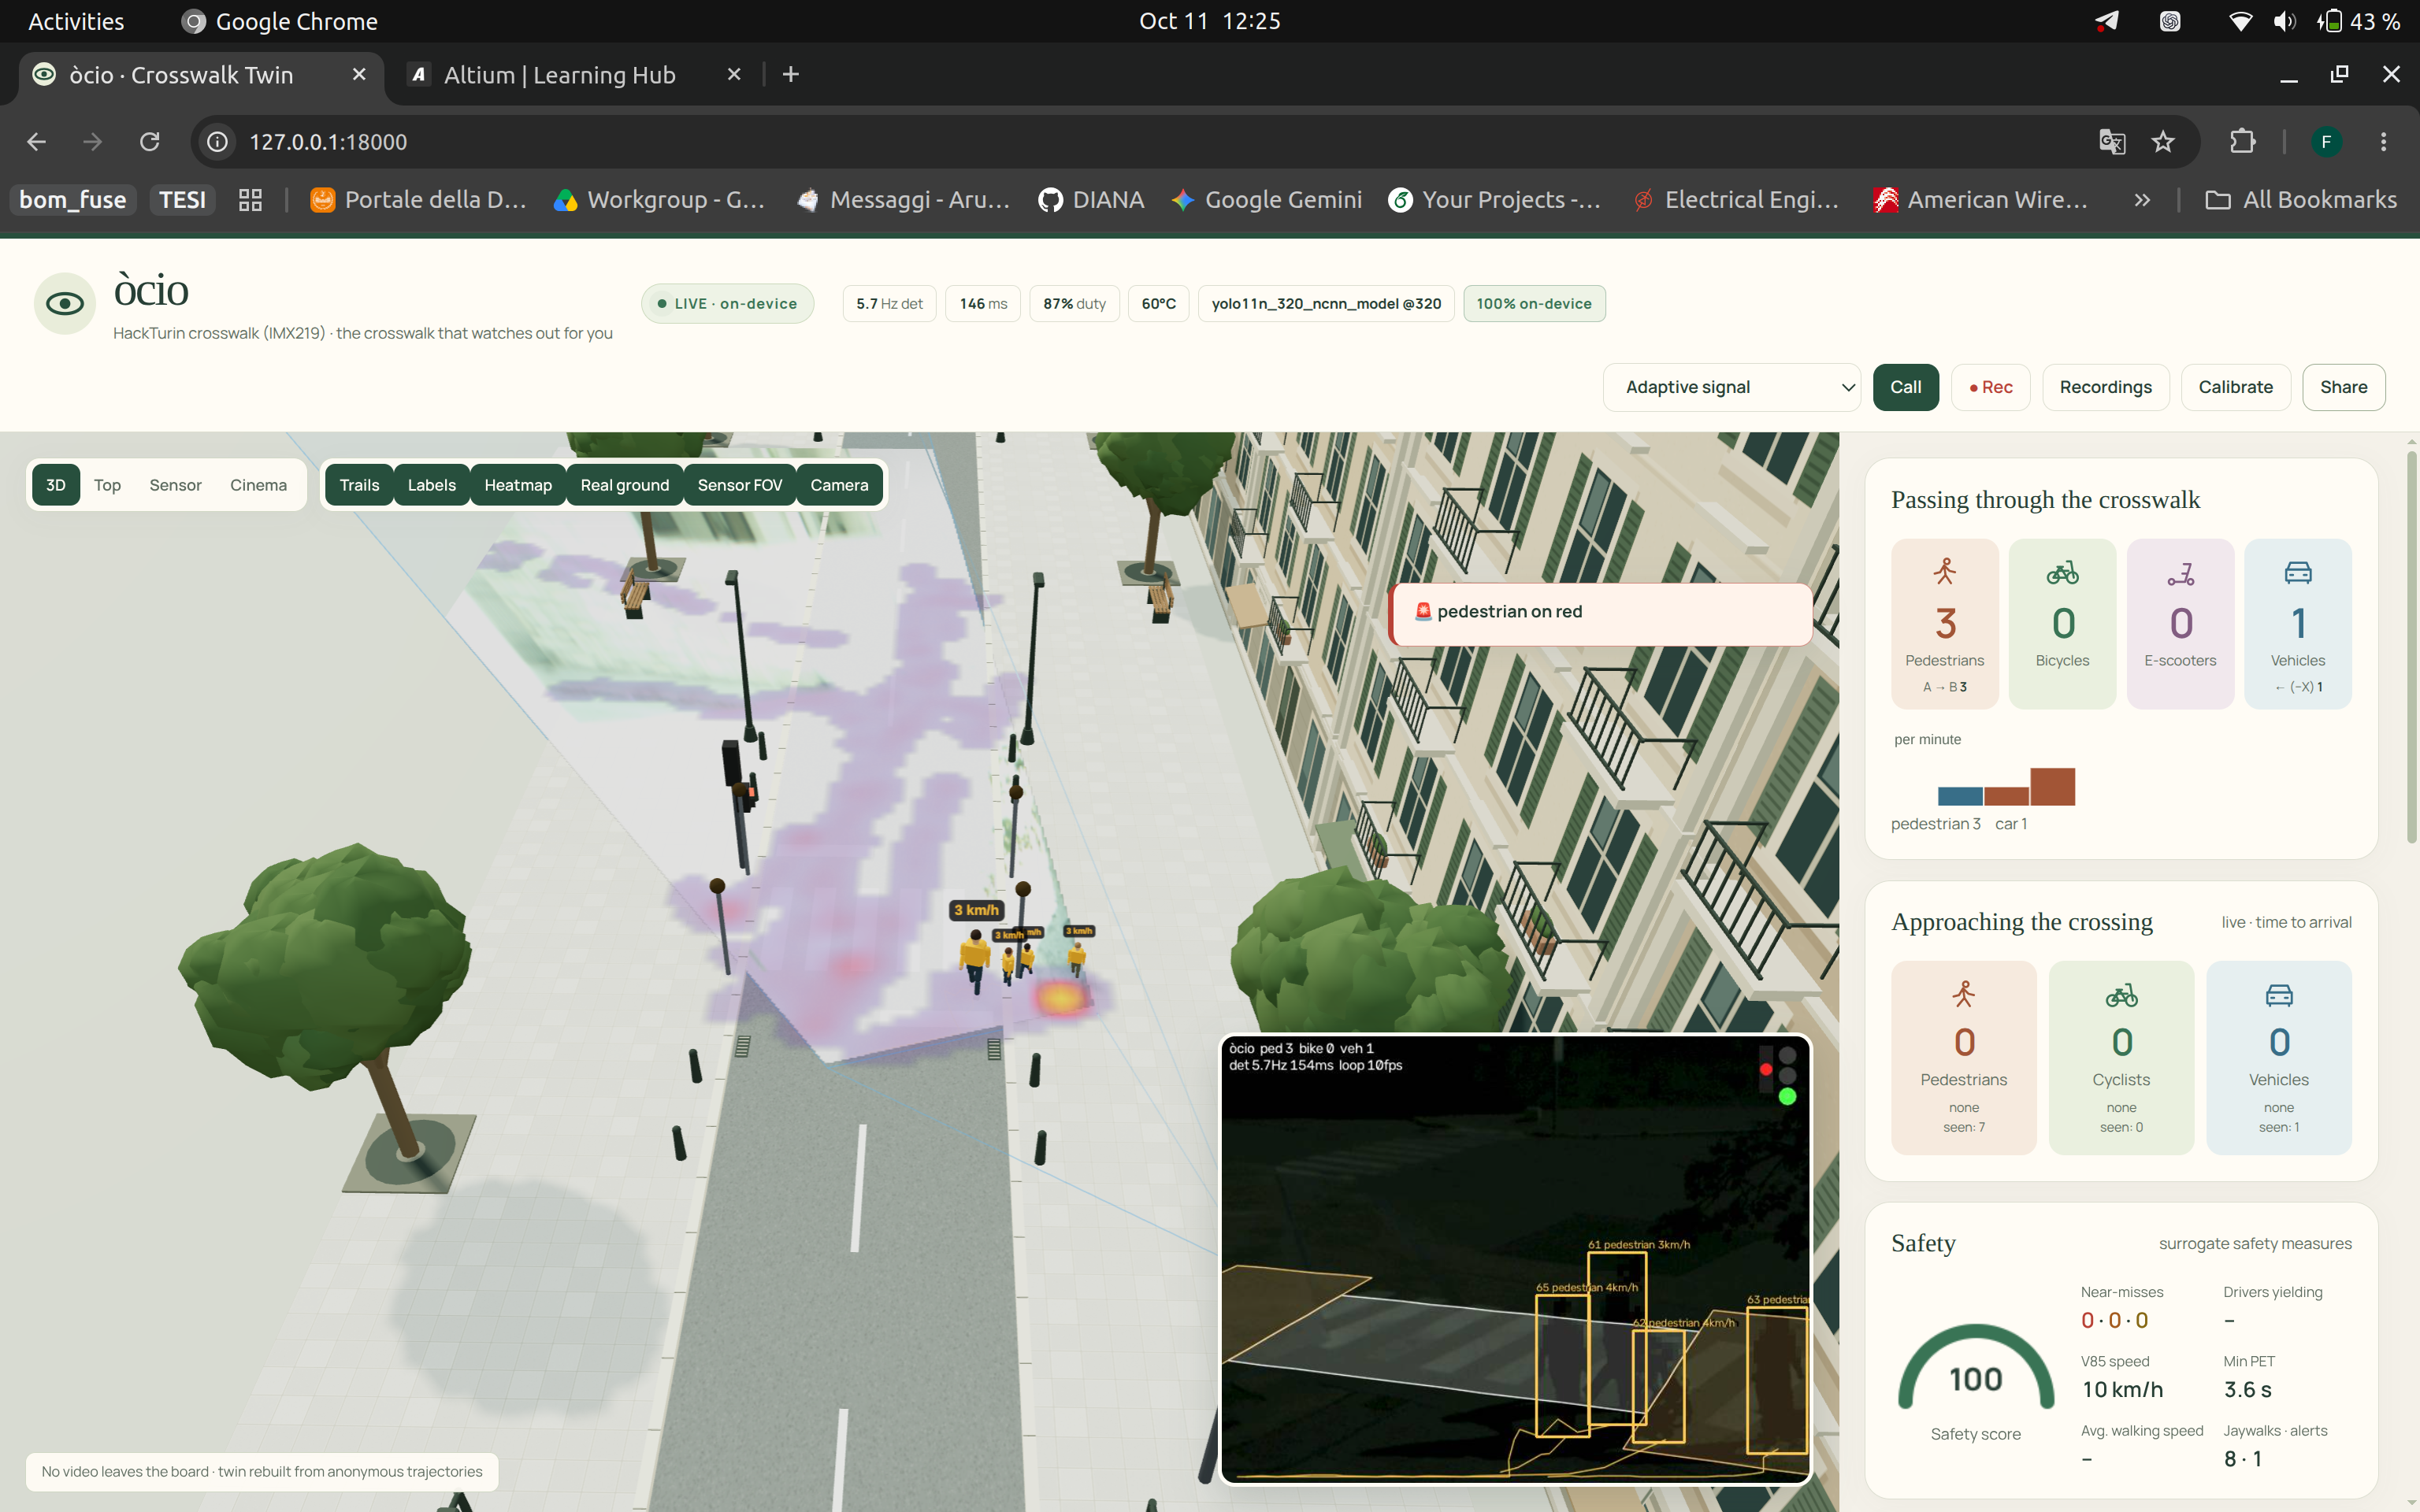
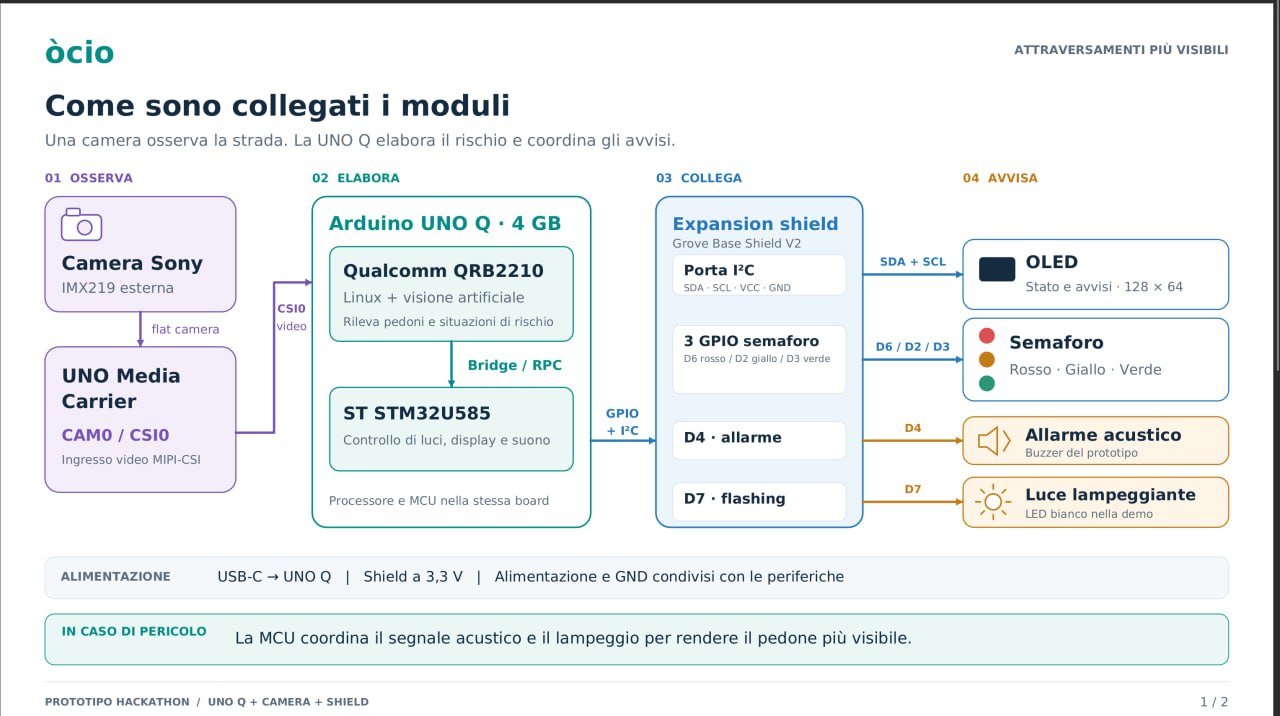
òcio uses a camera to detect pedestrians, cyclists and vehicles, track their movements and count passages by direction. It estimates speeds, crossing times and potential conflicts, then uses those observations to inform warning beacons and adaptive pedestrian signals. A browser dashboard shows an anonymous 3D reconstruction of the crossing, live statistics and the reasons behind signal decisions. The core processing runs locally on an Arduino UNO Q and can operate without an internet connection.
in addition we built the torino planner: The Torino Planner explores what deploying òcio across Turin could mean for travel time, energy use, emissions and investment. Users select any of the city’s eight districts on an interactive map, choose a traffic scenario and set the percentage of estimated signalised crossings to equip. The planner compares conventional push-button operation with vision-assisted pedestrian requests using identical simulated arrivals. Users can prioritise lower CO₂ emissions or shorter combined waiting times, and explore different signal timings across four daily demand periods. The model accounts for both pedestrian and vehicle waiting, vehicle idling and the electricity consumed by the devices. Results include estimated time and fuel savings, operational CO₂ changes, installation and maintenance costs, device replacement, and financial appraisal indicators. The interface separates benefits to road users and society from municipal spending and supplier economics. Users can adjust assumptions, compare saved scenarios and export results as CSV or JSON. The project combines official Turin district boundaries and population data with OpenStreetMap signalised-node data and traffic proxies derived from 5T profiles. These sources provide a transparent starting point; they do not establish a surveyed inventory of compatible crossings. The Torino Planner is a tool for testing deployment assumptions and preparing a pilot. Its results are scenario estimates, not guaranteed savings or a calibrated forecast of Turin’s entire road network. It retains negative outcomes, helping users see when a proposed deployment could increase waiting, emissions or costs. An online test version of the planner is available for you to test!
How we built it
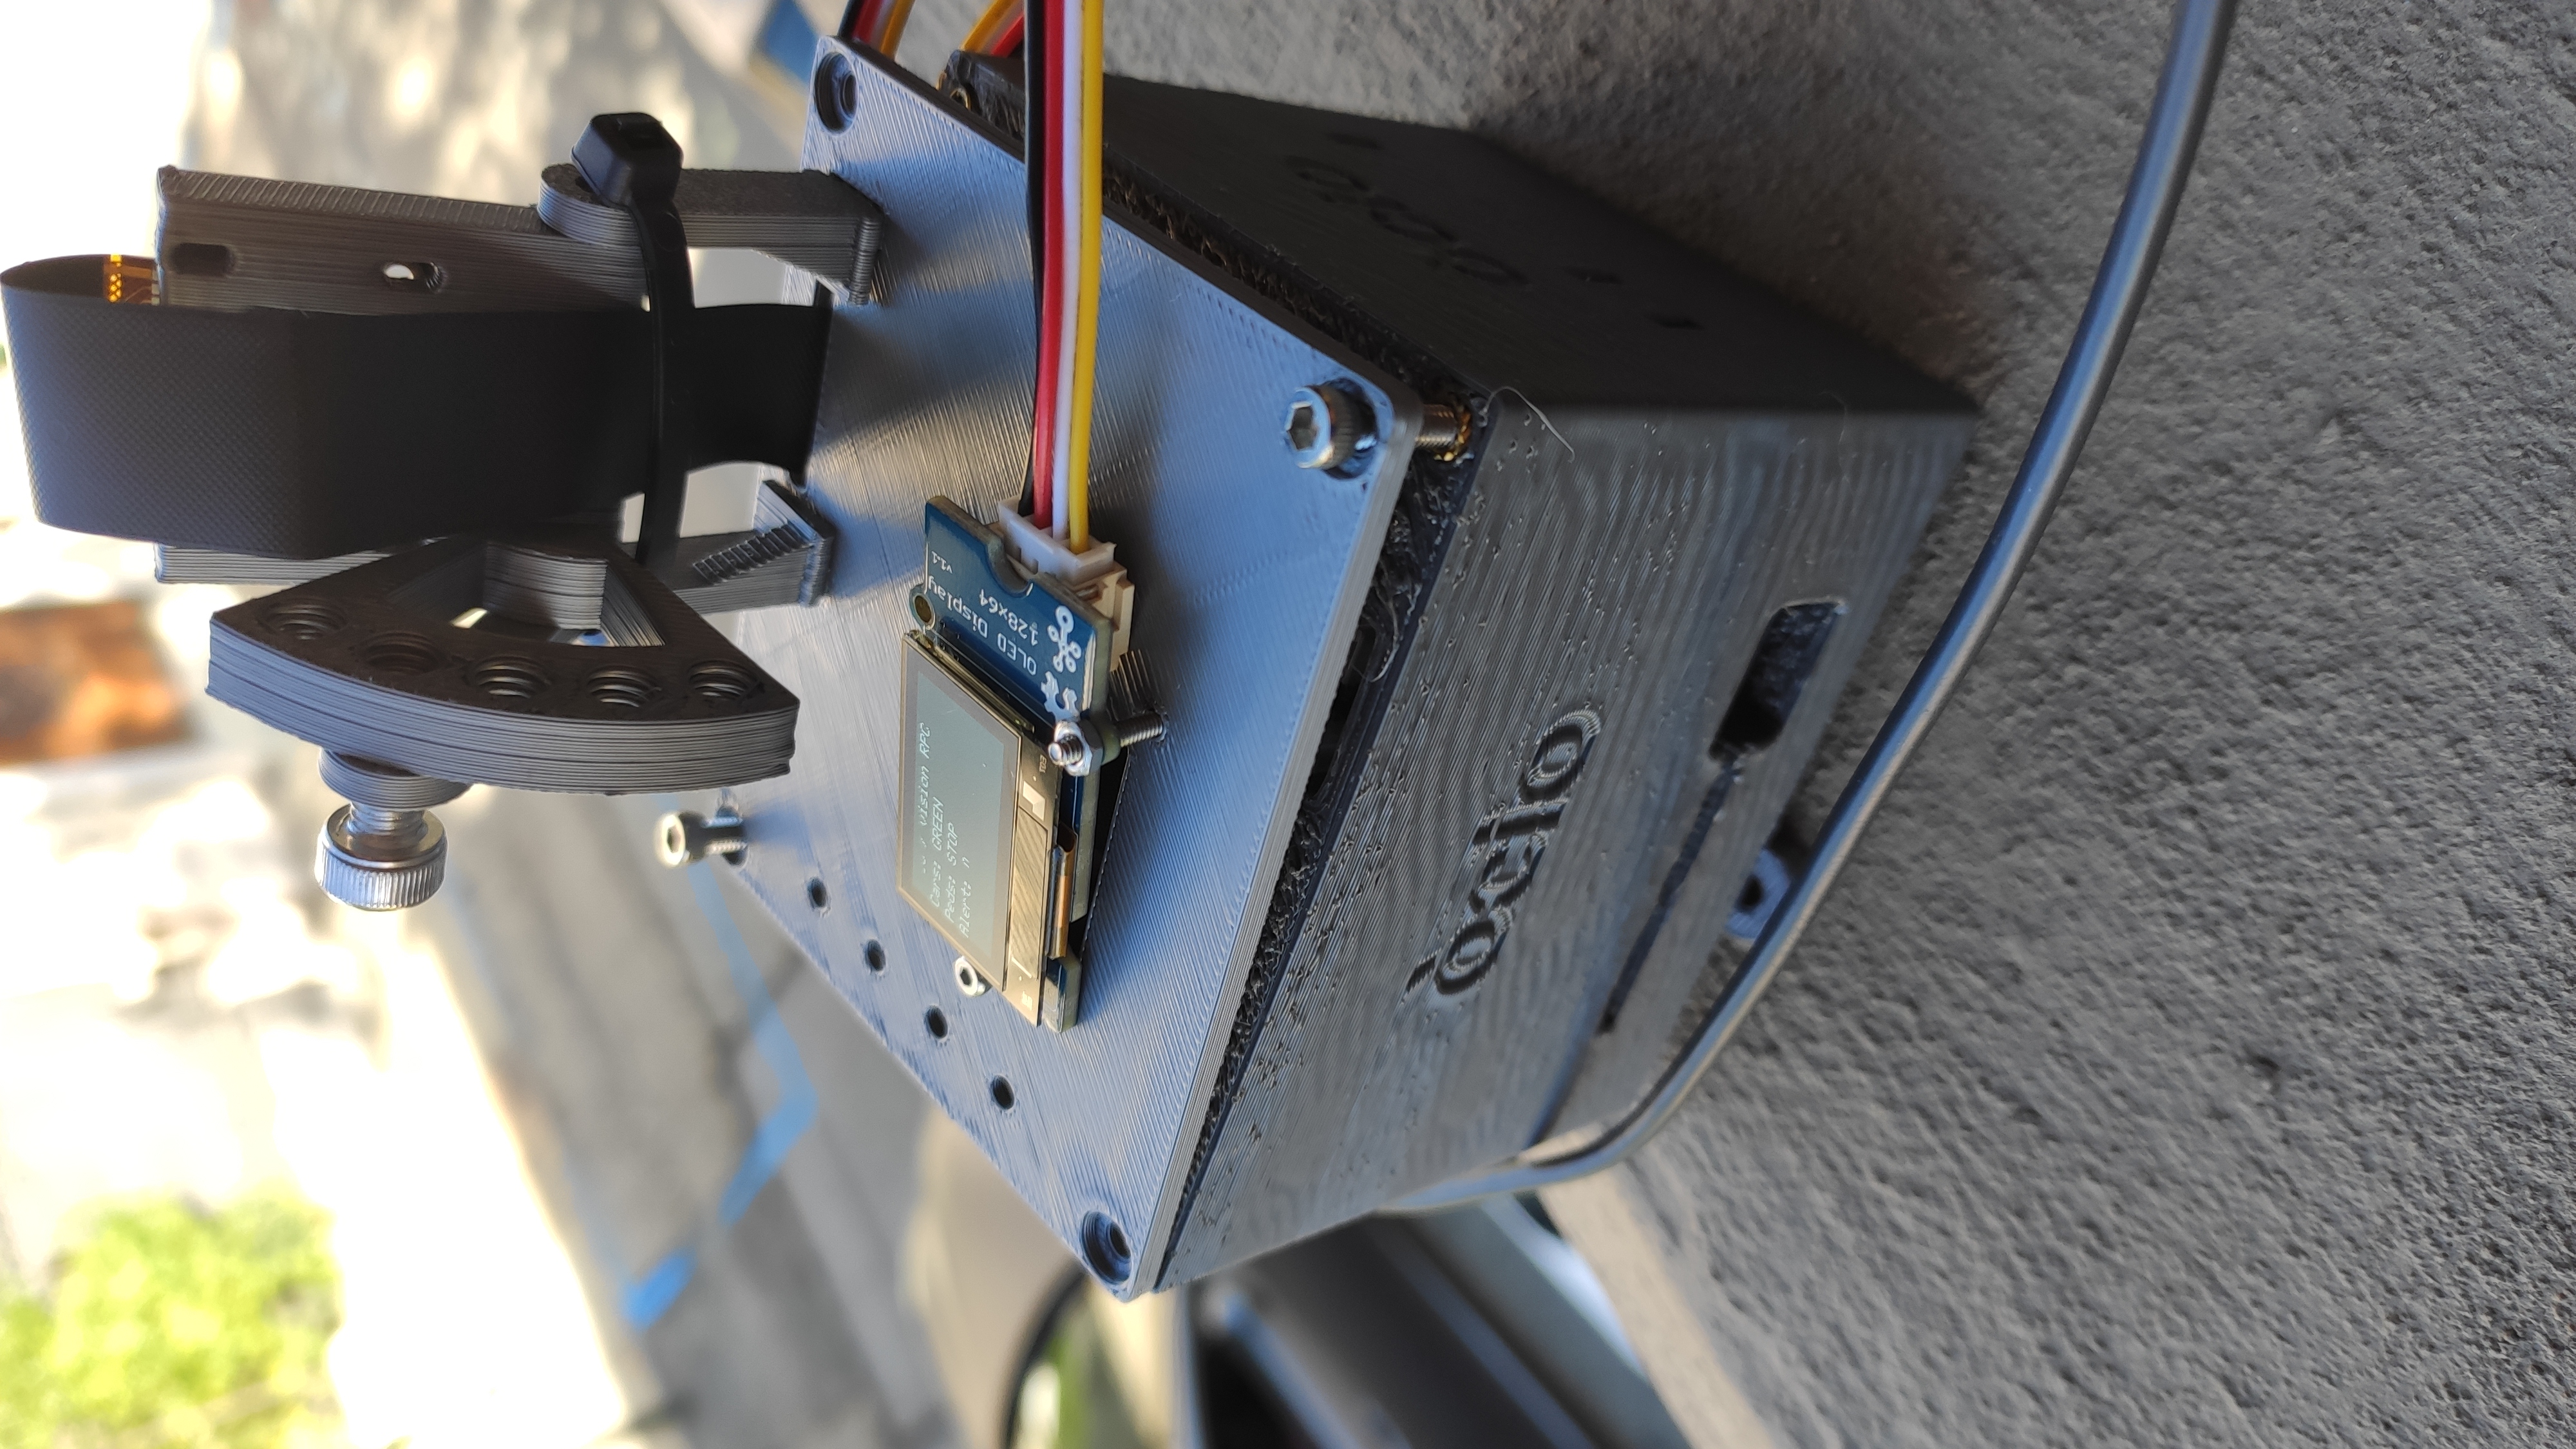
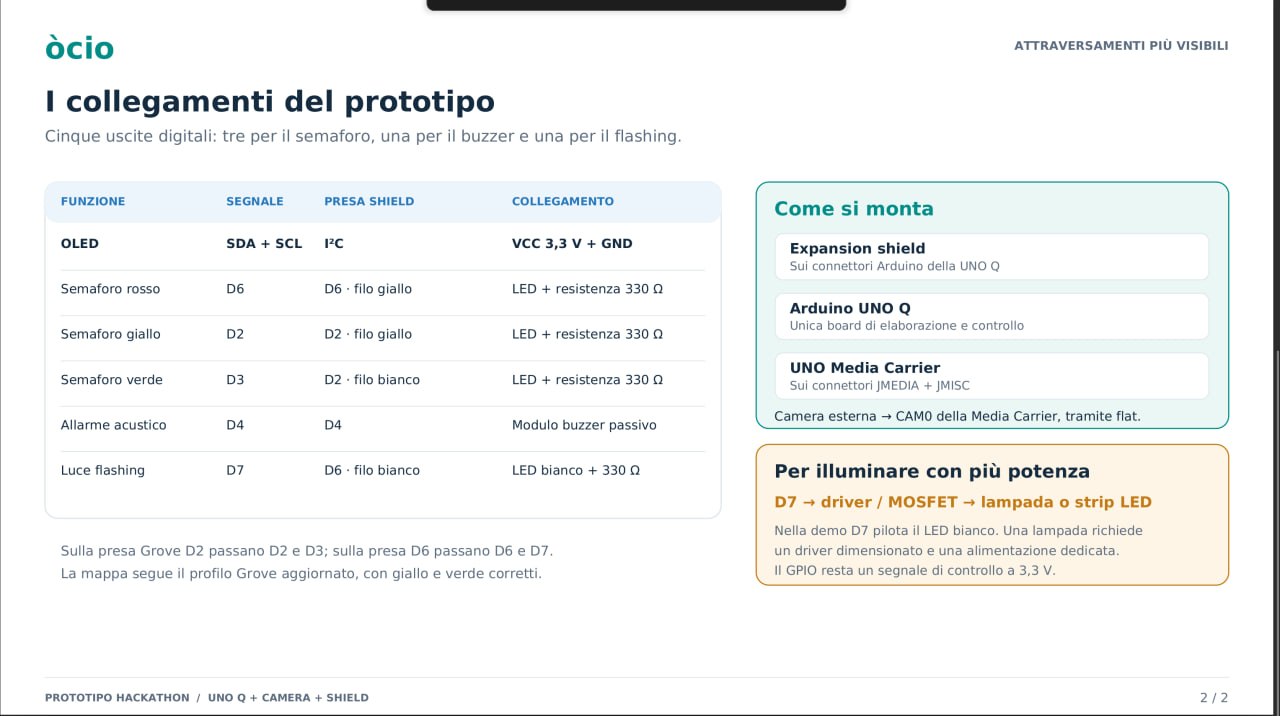
We built a Python vision pipeline using YOLO detectors, camera calibration and ground-plane tracking. We benchmarked models and inference runtimes, selecting NCNN YOLO11n for the live board configuration. Linux handles perception and decision-making, while the UNO Q’s STM32 microcontroller controls the prototype’s LEDs, OLED and buzzer. An independent watchdog provides a fallback indication when communication stops. We also developed a traffic simulator, a Three.js dashboard, recording and evaluation tools, and a CAD enclosure with an adjustable camera mount. Testing progressed from perfect simulated tracks to noisy detections, rendered camera images, public real-world footage and live board operation.
Challenges we ran into
Running vision on a compact board required balancing detection quality, input resolution and processing speed. Occlusions, small road users and vehicles entering the camera view late caused missed detections and counts. Camera integration, wiring corrections and recovery from stalled capture added further challenges. Our recorded site view also excluded the waiting areas, limiting what we could demonstrate about automatic pedestrian requests.
Accomplishments that we're proud of
- Simulated counting accuracy reached 91–93% across 1,860 ground-truth passages under deliberately noisy detections.
- Adaptive control reduced mean recorded pedestrian waiting time by approximately 46% in simulation.
- The saved scenario suites passed 44/44 cases with perfect tracks and 40/44 with noisy detections.
- A live camera run on the UNO Q completed 120 seconds with zero software-check failures and a median detection rate of 6 Hz.
- We demonstrated connected prototype outputs and recorded software fault recovery, including an operator-observed OLED fail-safe transition.
What we learned
Camera placement and calibration matter as much as detector choice. We also learned to distinguish a component test, a simulation result and a complete physical demonstration. Simulation helped us expose failures safely, but real-site performance still needs independently reviewed footage and controlled trials.
Built With
- 3js
- claude
- codex
- python
- yolo
