VitalBridge — One Body, One View
Inspiration
A teammate's younger sister was diagnosed with iron-deficiency anemia — not by a doctor, but by a nutritionist she visited for hair loss. Her hemoglobin had been quietly falling for over a year. Her Fitbit had been logging poor sleep and low HRV for months. Her symptoms — fatigue, brain fog, brittle nails — were all there. But they lived in three different apps that never spoke to each other.
No one connected the dots. She did — too late.
That's the problem we set out to solve.
"Your doctor sees your vitals once a year. Your wearable sees you every night. Your body is sending signals constantly. Nobody is listening to all of them at once."
We were also deeply inspired by Dario Amodei's essay Machines of Loving Grace — specifically the idea that AI could compress decades of medical progress by democratising access to health intelligence. VitalBridge is a small, practical piece of that vision.
What It Does
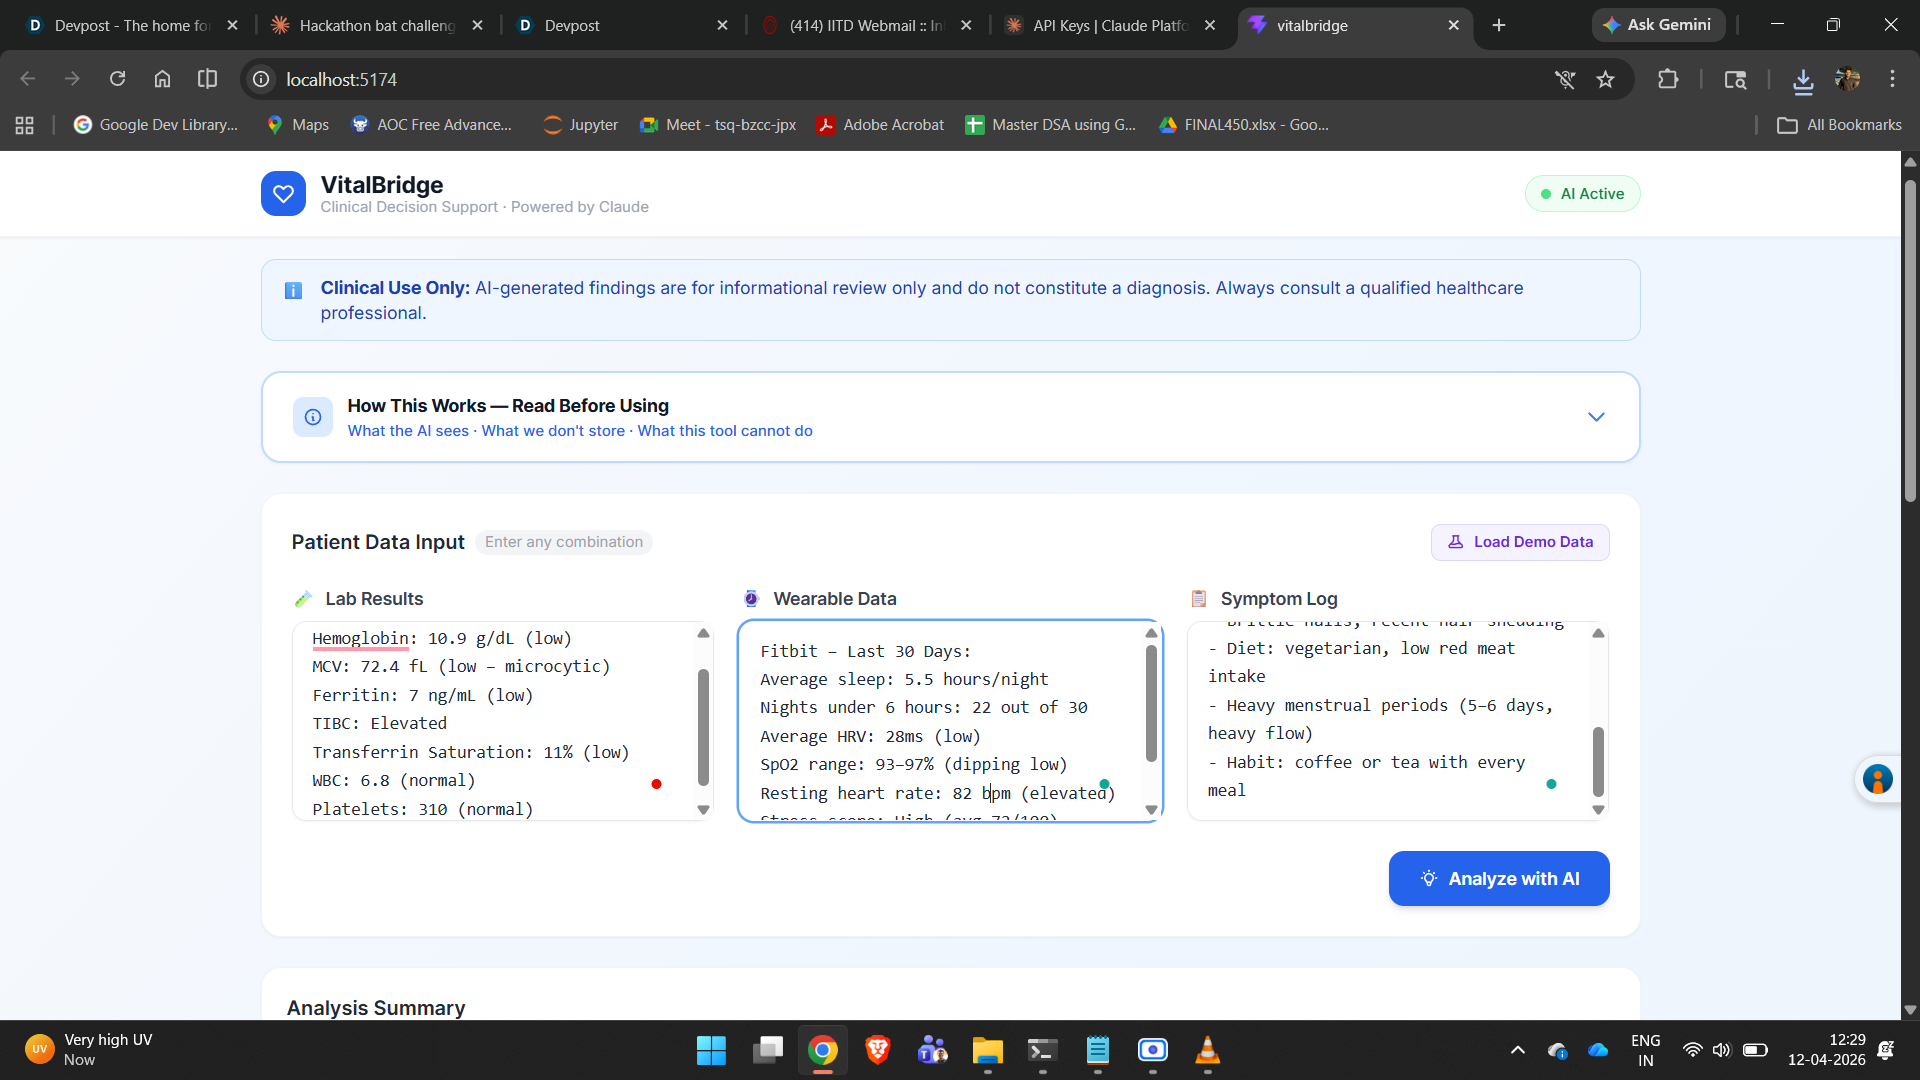
VitalBridge takes three inputs that currently live in silos:
- Lab results — raw text from any blood report (CBC, iron panel, lipid panel)
- Wearable data — sleep, HRV, SpO₂, stress scores from Fitbit or Apple Watch
- Symptom log — plain language description of how you've been feeling
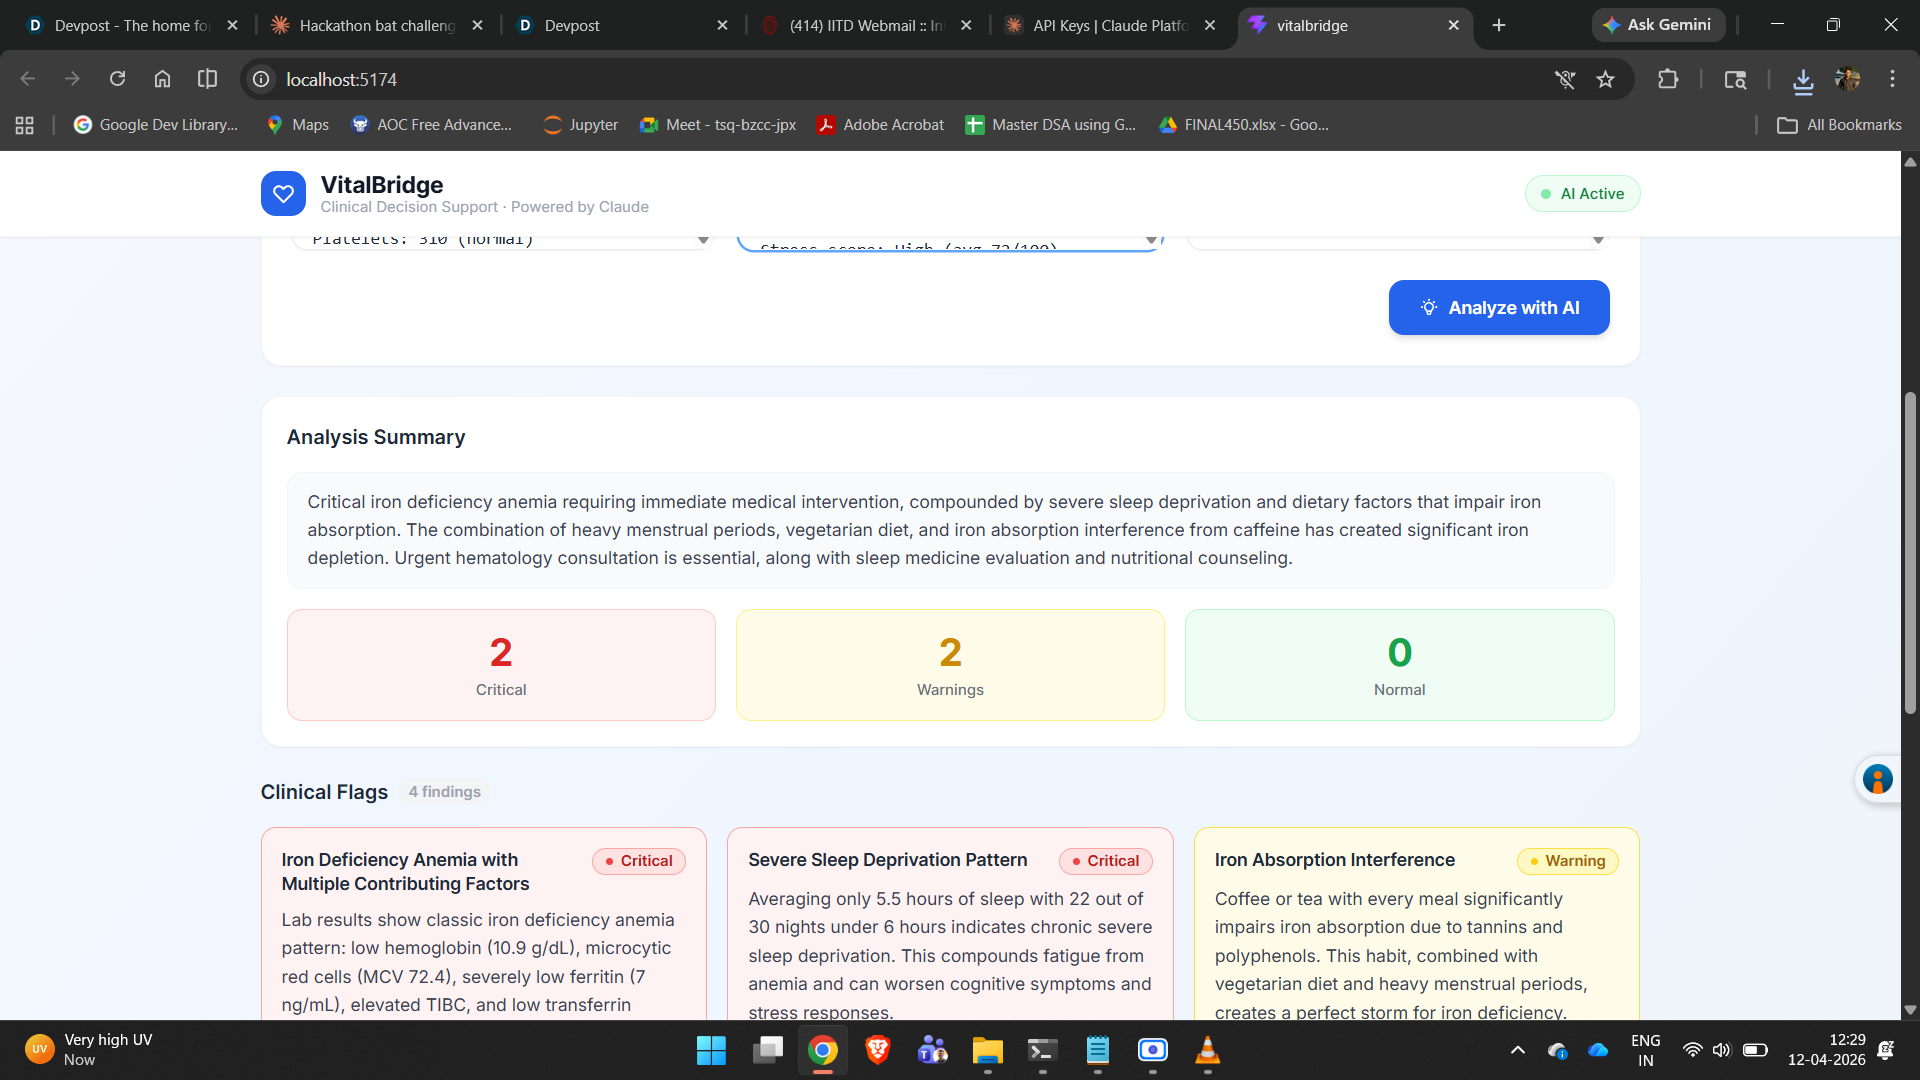
Claude then performs cross-signal correlation across all three — returning structured findings categorised by severity:
- 🔴 Red flags — patterns that warrant immediate medical attention
- 🟡 Yellow signals — trends worth monitoring over time
- 🟢 Green signals — positive indicators to reinforce
The key insight is that individual values often look unremarkable in isolation. It's the combination that tells the real story.
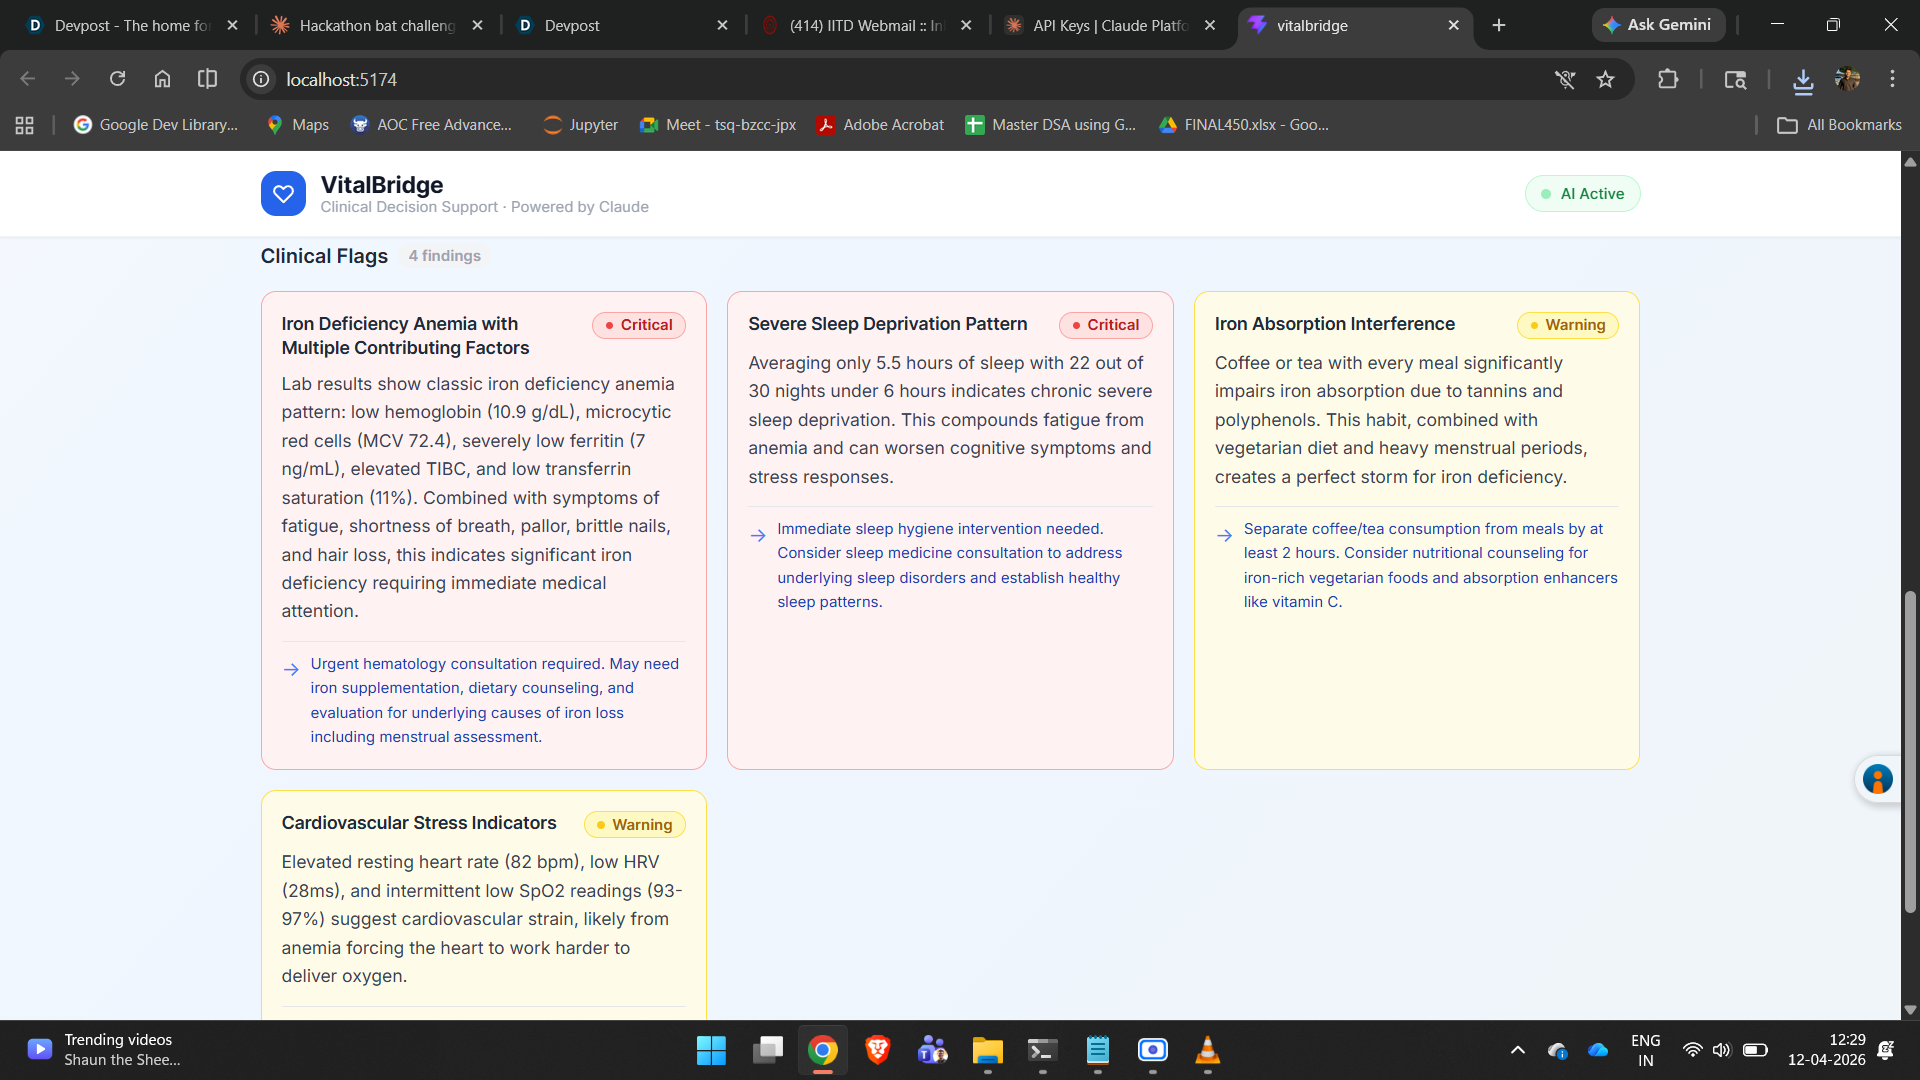
Consider our demo case. Individually:
$$\text{Hgb} = 10.9 \ \text{g/dL} \quad \text{(low, but borderline)}$$
$$\text{HRV} = 28 \ \text{ms} \quad \text{(low, but could be stress)}$$
$$\text{Sleep} = 5.5 \ \text{hrs/night} \quad \text{(poor, but common)}$$
But together, with a symptom cluster of fatigue + exertional breathlessness
- brain fog + heavy periods + vegetarian diet + coffee with every meal (which inhibits iron absorption by up to 60%) — the picture becomes urgent and unmistakable.
That's what VitalBridge surfaces. That's what no single app does today.
How We Built It
Stack: React + Tailwind CSS + Anthropic Claude API (claude-sonnet-4-20250514)
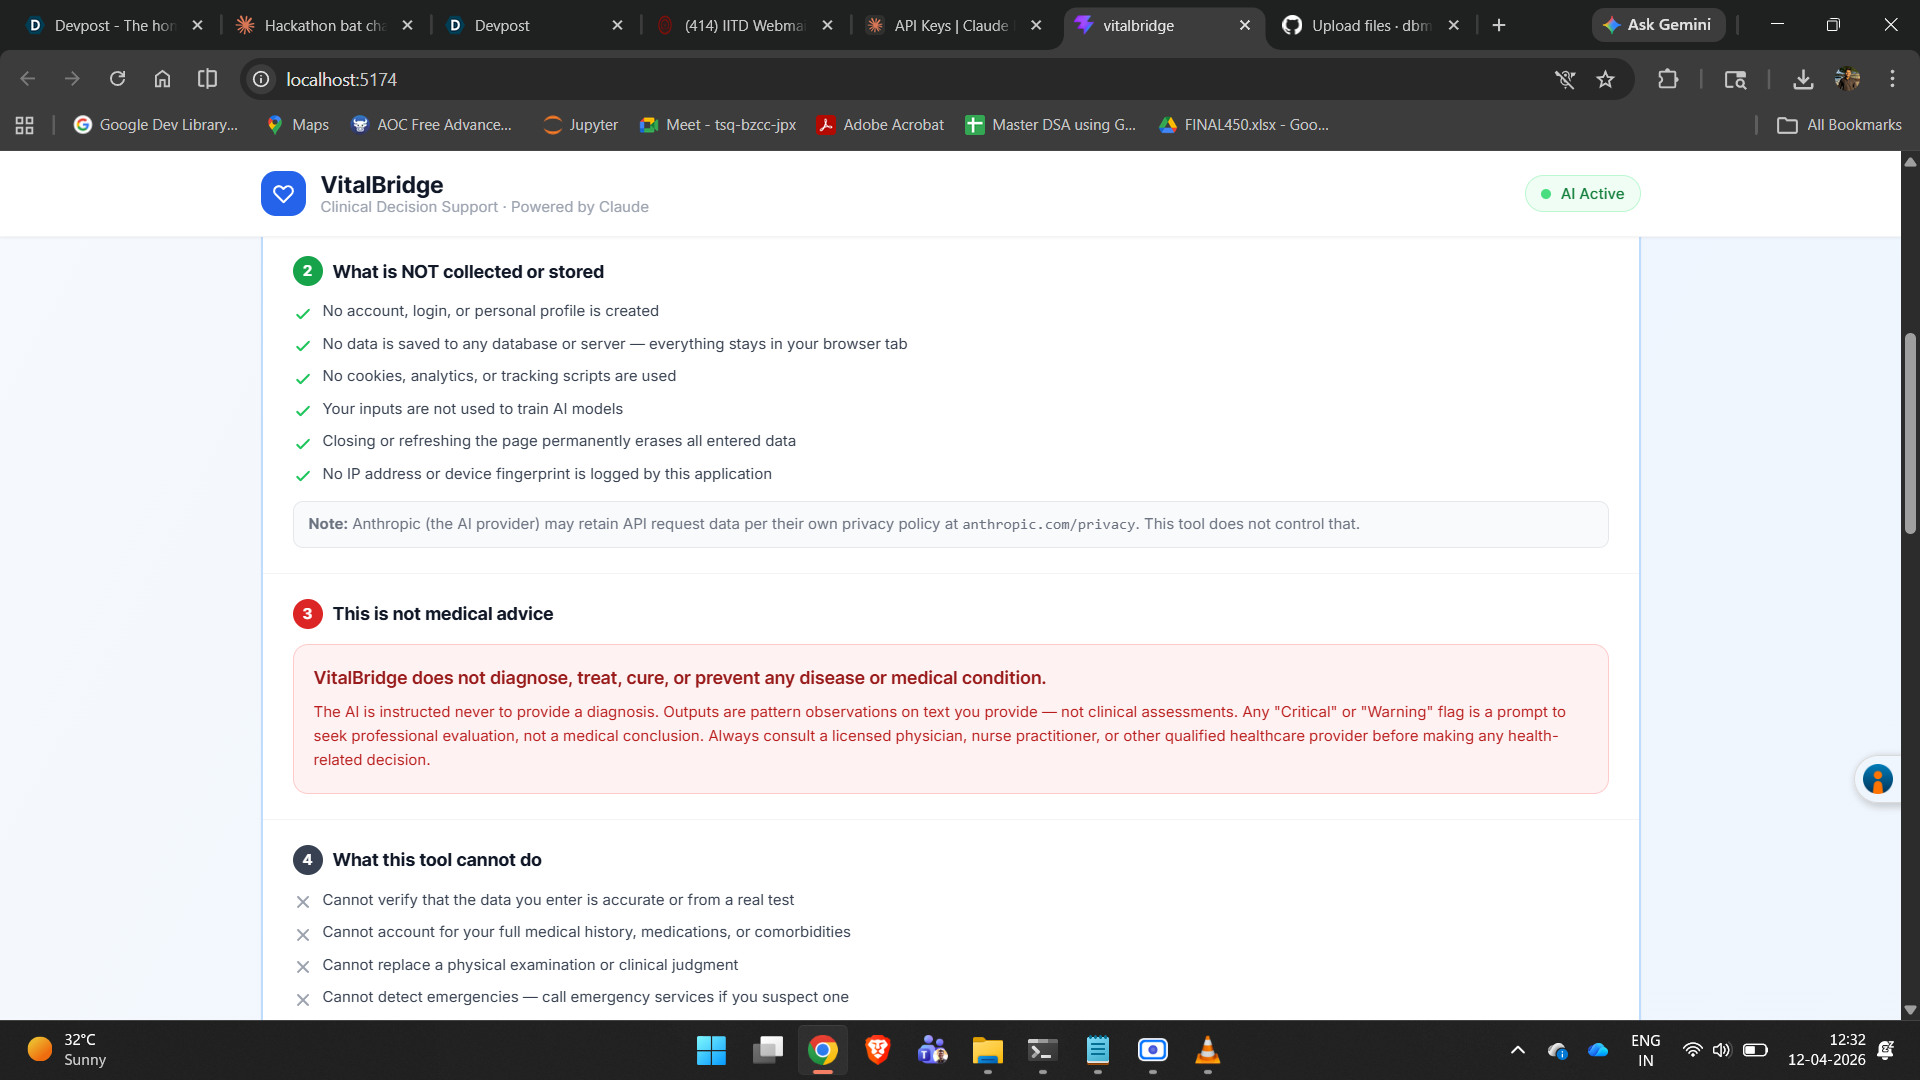
Architecture: Intentionally simple. No backend. No database. No login.
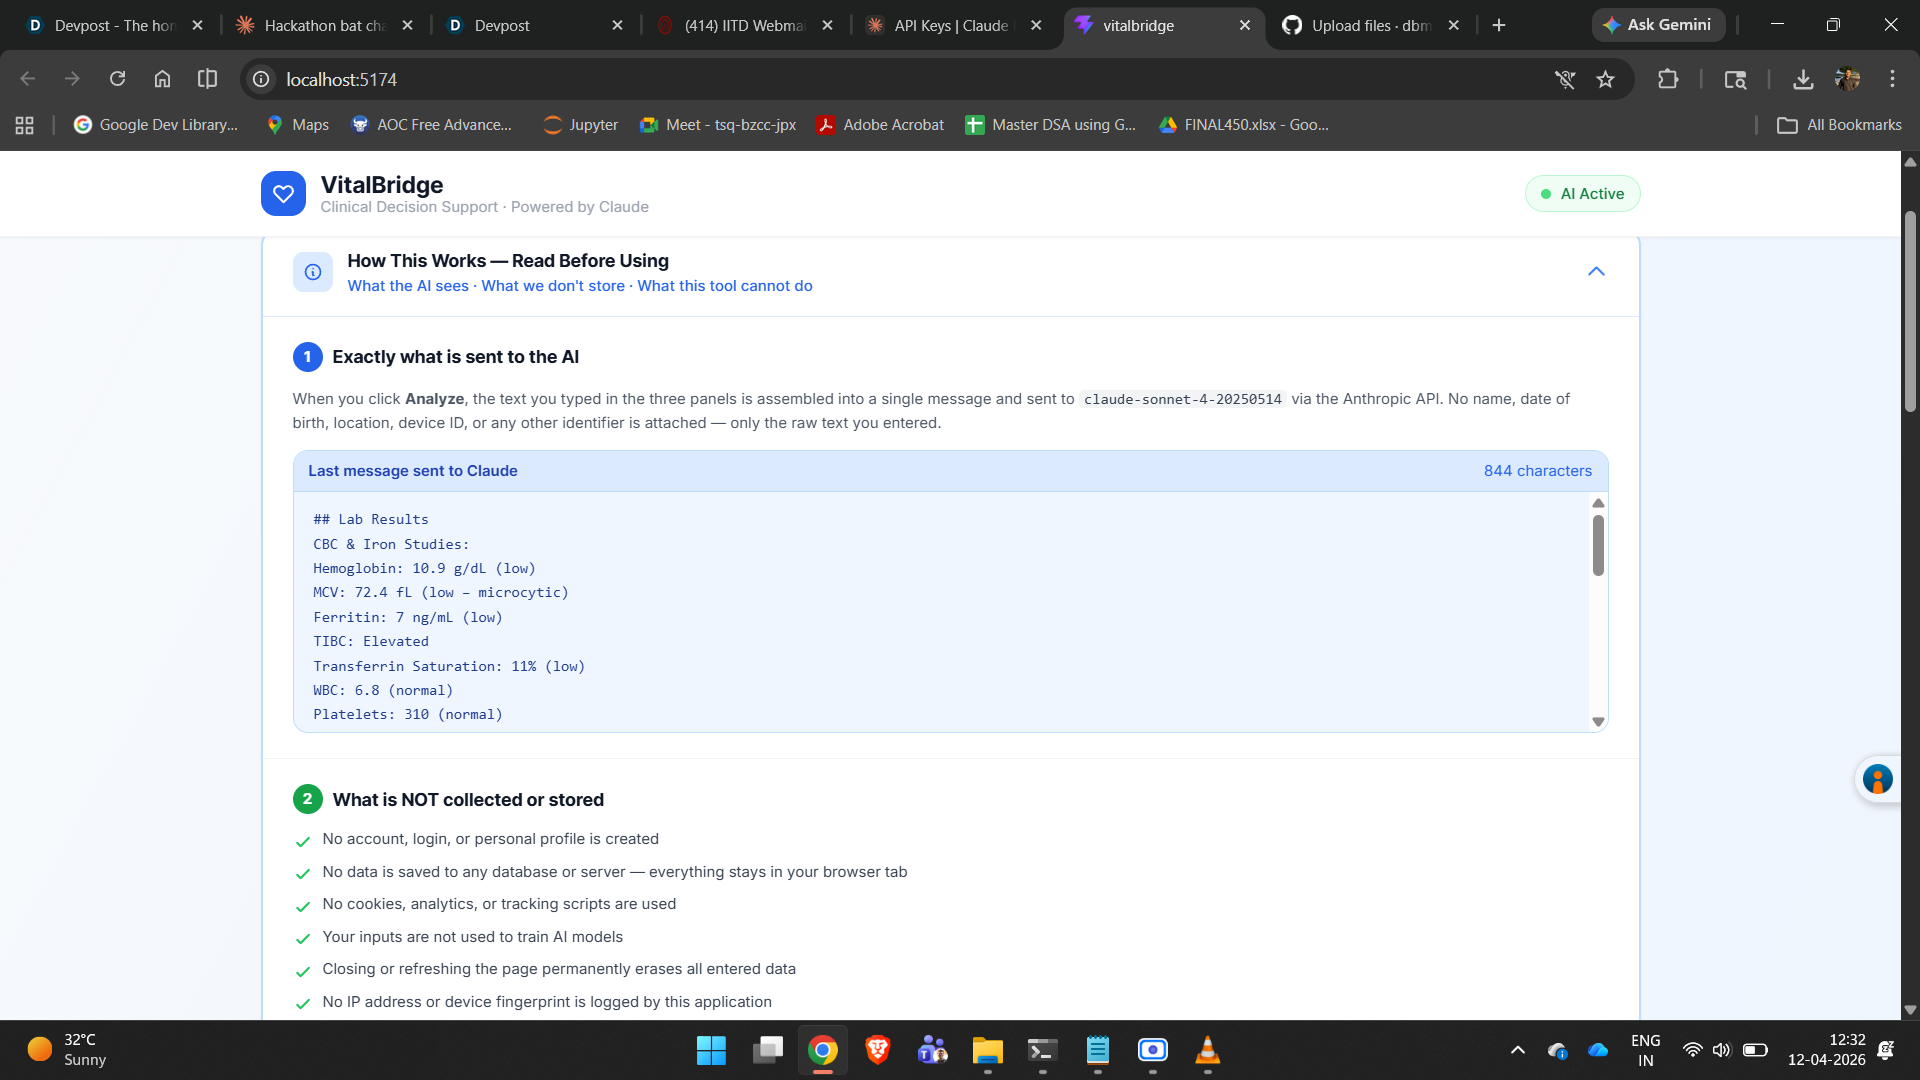
The entire system is a single stateless API call. The user's data never touches our servers — it goes directly to Claude and the response comes back. When the tab closes, nothing persists. This was a deliberate design decision, not a shortcut.
The Claude prompt was the hardest engineering problem of the day. We needed Claude to:
- Reason across three heterogeneous data types simultaneously
- Return structured JSON (not prose) for reliable UI rendering
- Never stray into diagnosis language
- Flag correlations that wouldn't appear in any single dataset
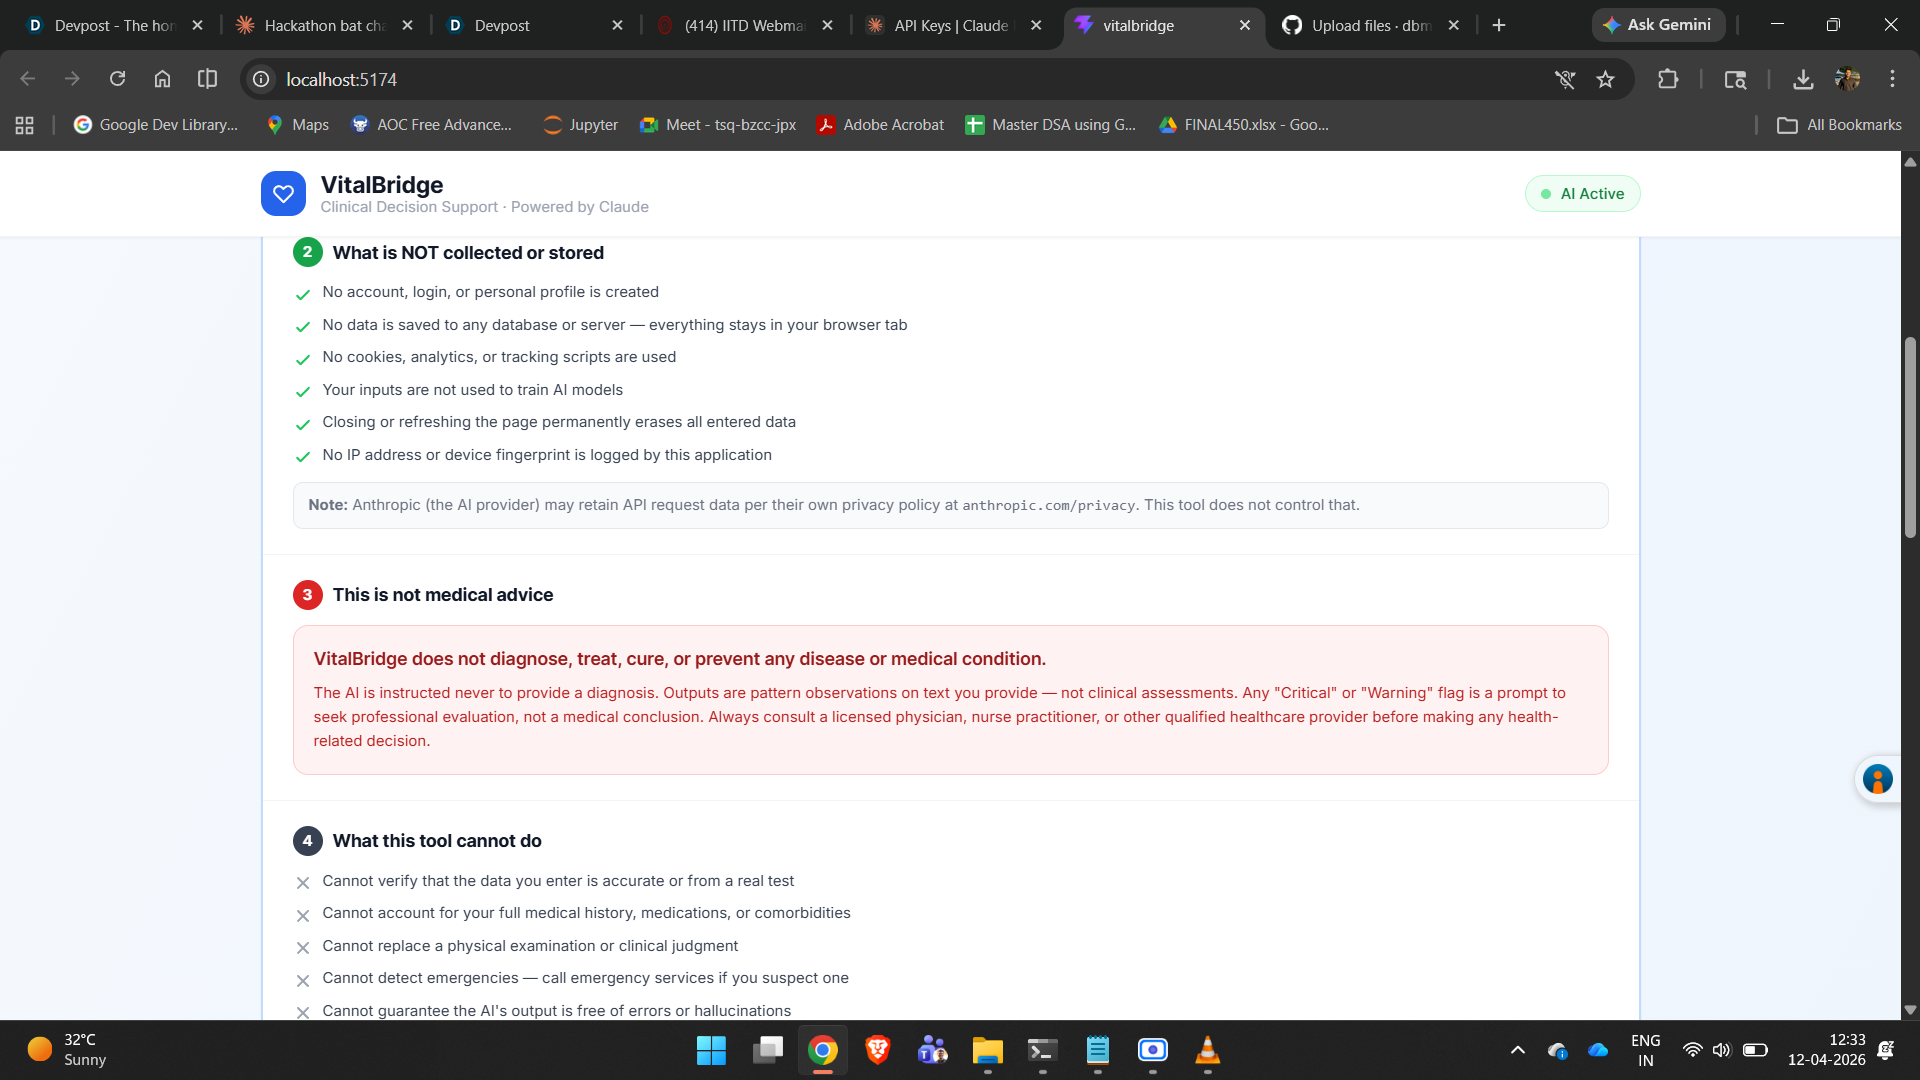
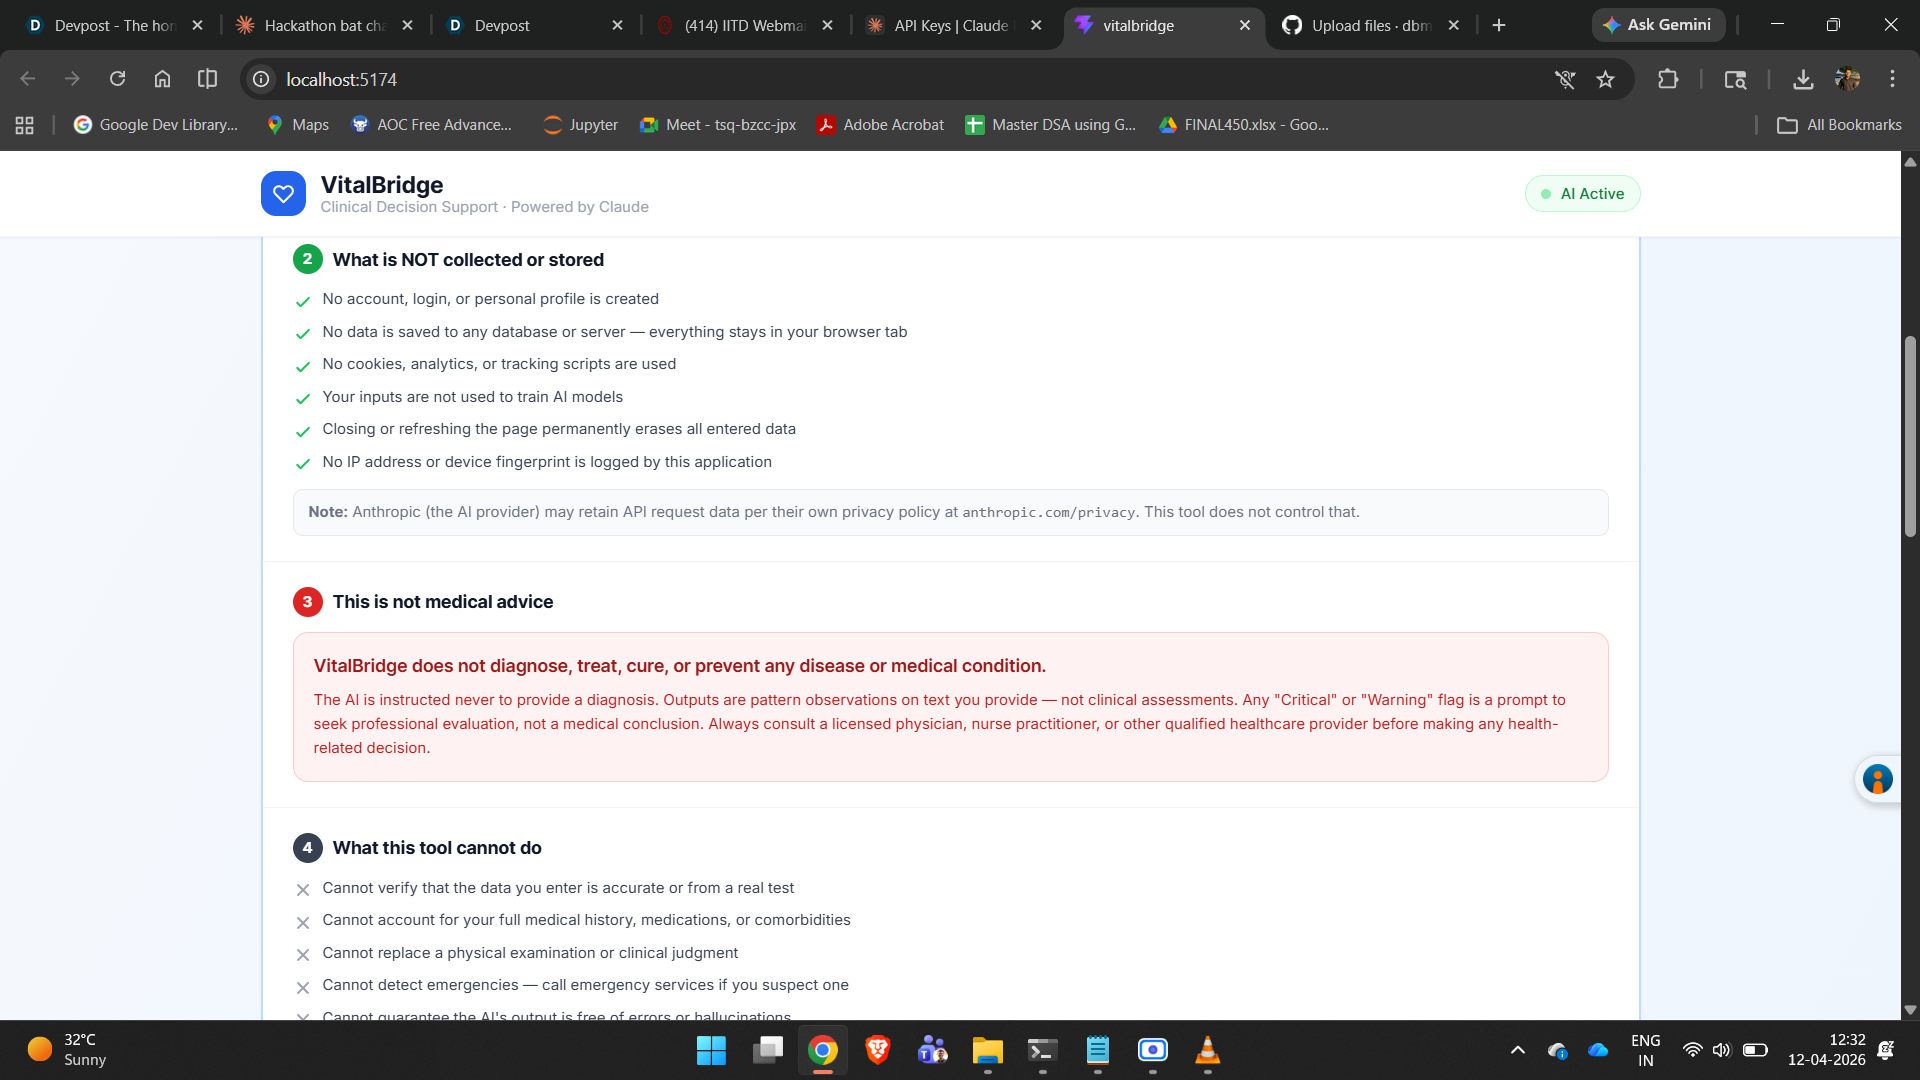
After several iterations, the system prompt that worked: You are a health data analyst — not a diagnostician. Your role is to surface correlations across lab, wearable, and symptom data that a person could bring to their doctor. Never use the word "diagnosis." Always recommend professional consultation for red or yellow flags. Return ONLY valid JSON — no preamble, no markdown fences. The ethics panel was built as a first-class UI element — not an afterthought disclaimer buried in a footer. It shows the user exactly what data was sent to Claude, what was not collected, and what the tool fundamentally cannot do.
Challenges We Faced
1. Prompt reliability Getting Claude to return clean, parseable JSON every single time — without markdown fences, preamble, or hallucinated fields — required more iteration than we expected. We added a try/catch with a fallback error state and a retry prompt that explicitly reinforces the JSON-only instruction.
2. The diagnosis boundary The line between "this pattern is associated with iron deficiency" and "you have iron deficiency anemia" is thin but critical. We spent real time on this — both in the system prompt and in how findings are worded in the UI cards. Every red flag ends with "bring this to your doctor" — not a recommendation of what to do about it.
3. Heterogeneous input formats Lab reports come in wildly different formats — some typed, some OCR'd from a photo, some copy-pasted from a PDF. Claude handles this surprisingly well, but we built the demo data to demonstrate the ideal input format clearly for users.
4. Avoiding the "health anxiety" failure mode An early version of our UI was too alarming — too many red cards, too little context. We added severity explanations and a persistent banner: "These are signals to discuss with a doctor — not a cause for alarm." Responsible design means thinking about emotional impact, not just accuracy.
What We Learned
AI's real value in health is correlation, not diagnosis. The insight gap isn't that doctors lack information — it's that patients arrive without a unified picture. VitalBridge fixes the input, not the output.
Ethical design has to be structural, not decorative. A disclaimer in small grey text is not ethics. We learned to treat the ethics panel as a core feature, not a legal checkbox.
Prompt engineering is product engineering. The system prompt is as important as the UI. A poorly written prompt produces unreliable JSON, a badly calibrated tone, or dangerous overreach. Getting it right took as long as building the interface.
What's Next
- Voice input in Hindi and Tamil — most Indians who would benefit from this can't type a symptom log in English
- Photo upload for lab reports — base64 image input to Claude vision, so users don't need to retype values
- Longitudinal tracking — opt-in local storage so users can see their signals change over time
- GP handoff export — a one-page PDF summary formatted for a doctor's visit
Built At
Anthropic Hackathon · IIT Delhi · April 12, 2026
Track 1 — Biology & Physical Health
CBC Spring 2026 Global Hackathon · 78 universities · 12 countries
Inspired by Machines of Loving Grace. Built for the person whose signals no one was reading.

Log in or sign up for Devpost to join the conversation.