-

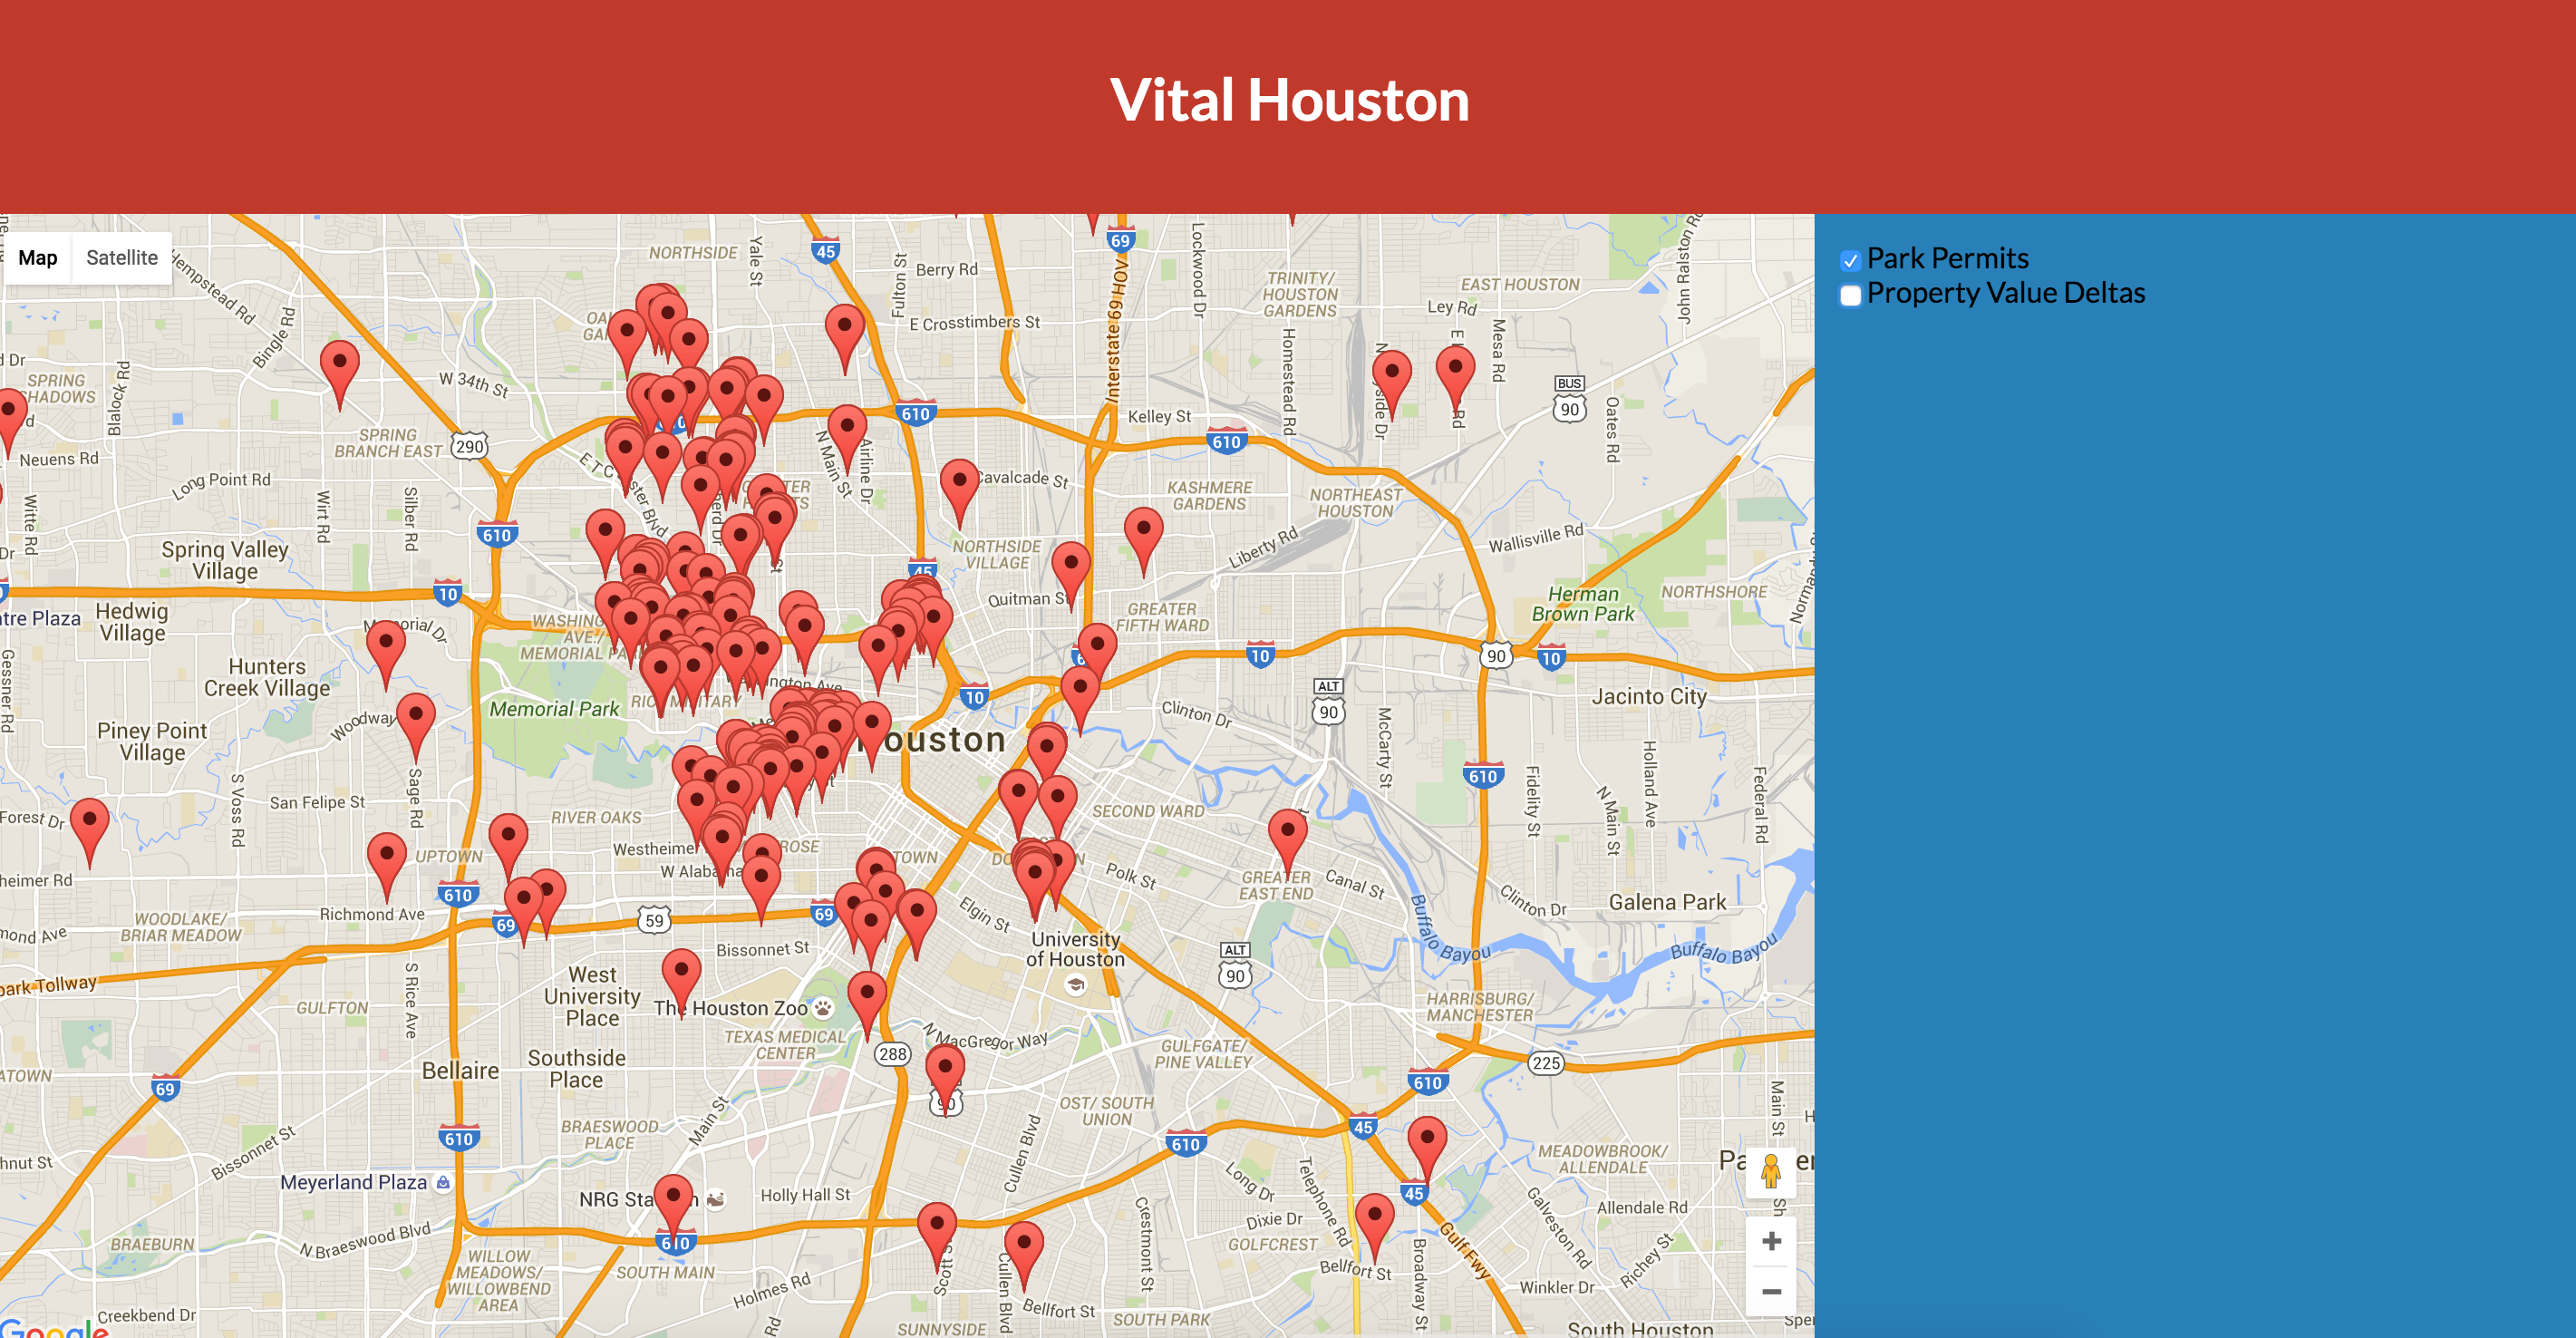
Map visualization with only the parks layer
-

Map visualization with only the zip codes layer
-

Map visualization with both layers on


Inspiration
Lack of transparency
Increase demand for city services
Increasing property taxes
What it does
Visualizes data we've aggregated on a map to start a discussion about where Houston is spending it's money, and where it should be.
How we built it
Open Data + Google Magic. We used full stack JavaScript with Angular, NodeJS, and MongoDB. The parsing of the data was done in Ruby.
Challenges we ran into
Data processing and technical issues, finding the right data to use.
Accomplishments that we're proud of
Successfully being able to convert the data we found into a format that can be easily consumed by the public.
What we learned
Open Data is only so accessible, but if you're will is strong, you can wrangle it.
What's next for Vital Houston
Continue adding more data and asking bigger questions


Log in or sign up for Devpost to join the conversation.