Inspiration
Excited to learn and implement data science and data visualization
What it does
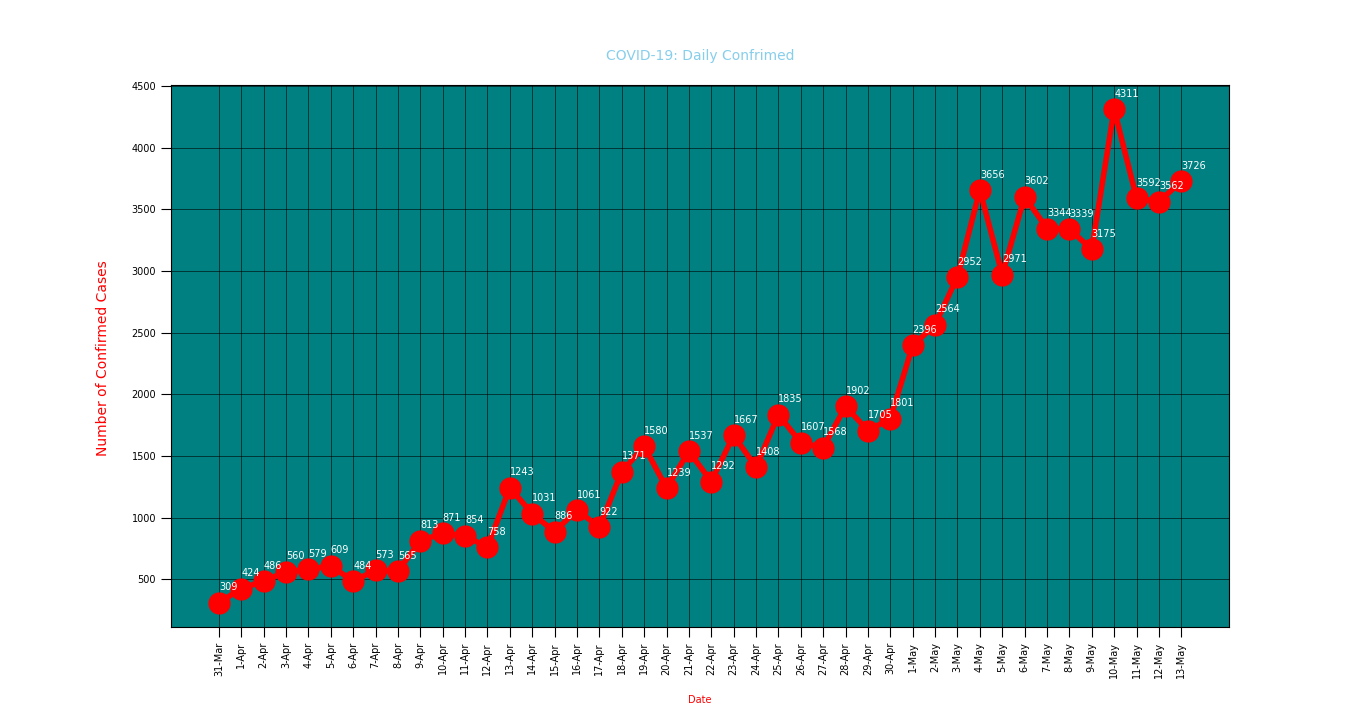
Shows graphical representation of the COVID-19 data, number of cases in days.
How we built it
using pandas as pd to read the data from CSV file using matplotlib.pyplot as plot to plot data in the graph
Challenges we ran into
making graph more representable learn matplotlib as I have never used it before
Accomplishments that we're proud of
made my first data visualization
What we learned
data visualization using Python and its libraries
What's next for Visualizing the DATA
making more advanced data visualization projects

Log in or sign up for Devpost to join the conversation.