-
-
Home Page
-
About Page
-
Sample Devlog Directory
-
Sample Devlog

DISCLAIMER
The three minute video is not nearly long enough to properly explain the entirety of the project. The below descriptions are more detailed and offer much more information regarding the site's inspiration and development. For more insights into our coding process, please read the devlogs, which are records of daily progress. For another look towards the ethics and potential impacts of a website like this, please click the "ethics" button to see a short article: that explains our concerns and rationale. This project was built with a lot of passion—not only for coding, but also for discussion and information regarding the handling of crime in urban cities—and I hope you can see that!
Finally, the video has a bit of lag at the 2:15 mark. I (Michael) start talking about the assault data being displayed, but it's not yet visible. This is a result of internet lag, and is not perfectly representative of what the final product is. If you have a strong internet connection, it will load properly. Try it for yourself!
INSPIRATION
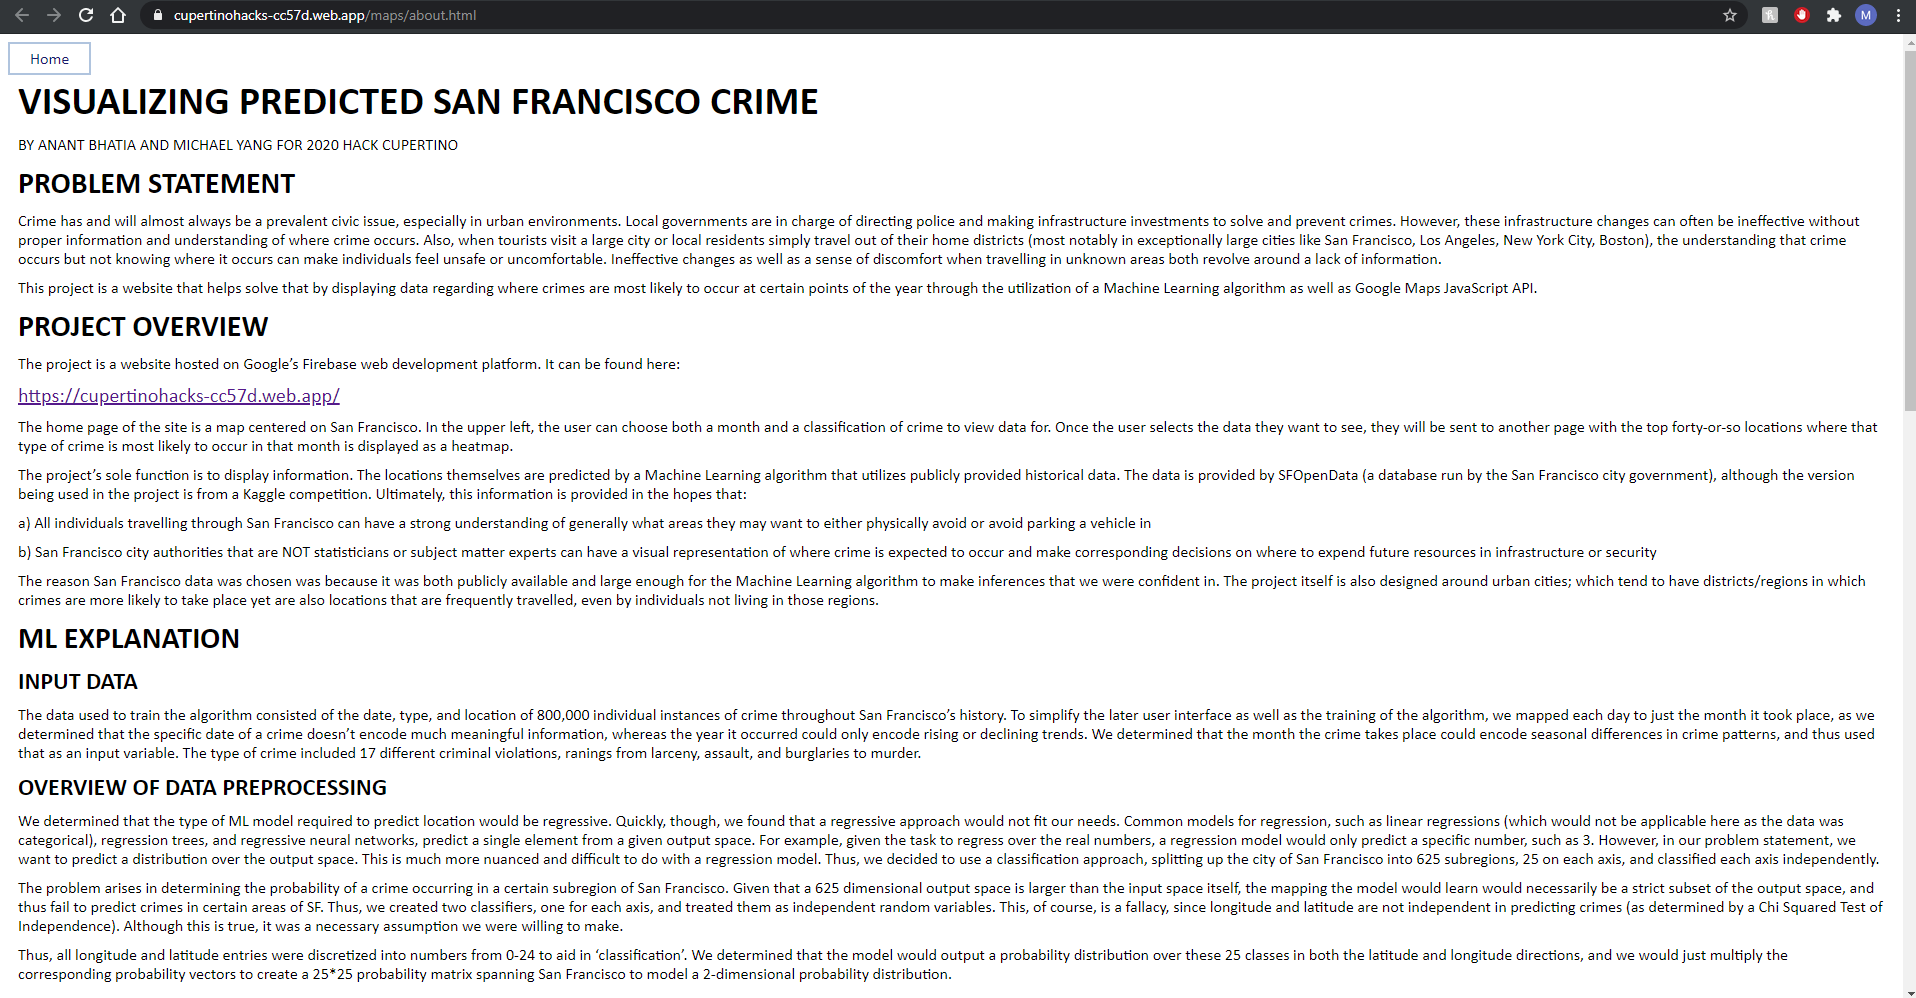
Crime has and will almost always be a prevalent civic issue, especially in urban environments. Local governments are in charge of directing police and making infrastructure investments to solve and prevent crimes. However, these infrastructure changes can often be ineffective without proper information and understanding of where crime occurs. Also, when tourists visit a large city or local residents simply travel out of their home districts (most notably in exceptionally large cities like San Francisco, Los Angeles, New York City, Boston), the understanding that crime occurs but not knowing where it occurs can make individuals feel unsafe or uncomfortable. Ineffective changes as well as a sense of discomfort when travelling in unknown areas both revolve around a lack of information.
This project is a website that helps solve that by displaying data regarding where crimes are most likely to occur at certain points of the year through the utilization of a Machine Learning algorithm as well as Google Maps JavaScript API.
WHAT IT DOES
The project is a website hosted on Google’s Firebase web development platform. It can be found here:
https://cupertinohacks-cc57d.web.app/
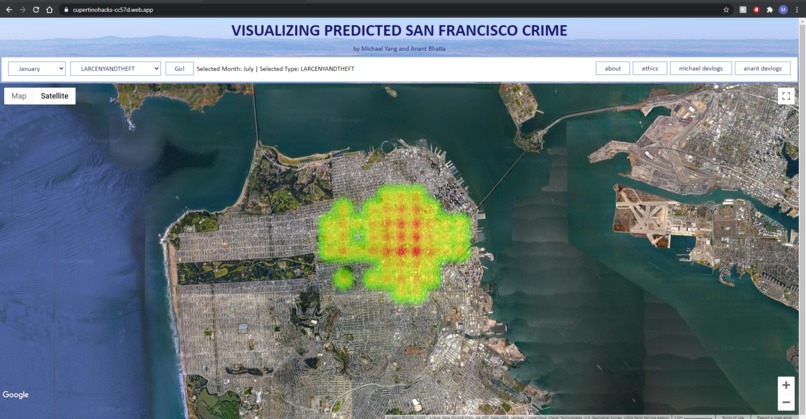
The home page of the site is a map centered on San Francisco. In the upper left, the user can choose both a month and a classification of crime to view data for. Once the user selects the data they want to see, they will be sent to another page with the top forty-or-so locations where that type of crime is most likely to occur in that month is displayed as a heatmap.
The project’s sole function is to display information. The locations themselves are predicted by a Machine Learning algorithm that utilizes publicly provided historical data. The data is provided by SFOpenData (a database run by the San Francisco city government), although the version being used in the project is from a Kaggle competition. Ultimately, this information is provided in the hopes that:
a) All individuals travelling through San Francisco can have a strong understanding of generally what areas they may want to either physically avoid or avoid parking a vehicle in
b) San Francisco city authorities that are NOT statisticians or subject matter experts can have a visual representation of where crime is expected to occur and make corresponding decisions on where to expend future resources in infrastructure or security
The reason San Francisco data was chosen was because it was both publicly available and large enough for the Machine Learning algorithm to make inferences that we were confident in. The project itself is also designed around urban cities; which tend to have districts/regions in which crimes are more likely to take place yet are also locations that are frequently traveled, even by individuals not living in those regions.
HOW IT WAS BUILT
ML EXPLANATION
INPUT DATA
The data used to train the algorithm consisted of the date, type, and location of 800,000 individual instances of crime throughout San Francisco’s history. To simplify the later user interface as well as the training of the algorithm, we mapped each day to just the month it took place, as we determined that the specific date of a crime doesn’t encode much meaningful information, whereas the year it occurred could only encode rising or declining trends. We determined that the month the crime takes place could encode seasonal differences in crime patterns, and thus used that as an input variable. The type of crime included 17 different criminal violations, ranings from larceny, assault, and burglaries to murder.
OVERVIEW OF DATA PREPROCESSING
We determined that the type of ML model required to predict location would be regressive. Quickly, though, we found that a regressive approach would not fit our needs. Common models for regression, such as linear regressions (which would not be applicable here as the data was categorical), regression trees, and regressive neural networks, predict a single element from a given output space. For example, given the task to regress over the real numbers, a regression model would only predict a specific number, such as 3. However, in our problem statement, we want to predict a distribution over the output space. This is much more nuanced and difficult to do with a regression model. Thus, we decided to use a classification approach, splitting up the city of San Francisco into 625 subregions, 25 on each axis, and classified each axis independently.
The problem arises in determining the probability of a crime occurring in a certain subregion of San Francisco. Given that a 625 dimensional output space is larger than the input space itself, the mapping the model would learn would necessarily be a strict subset of the output space, and thus fail to predict crimes in certain areas of SF. Thus, we created two classifiers, one for each axis, and treated them as independent random variables. This, of course, is a fallacy, since longitude and latitude are not independent in predicting crimes (as determined by a Chi Squared Test of Independence). Although this is true, it was a necessary assumption we were willing to make.
Thus, all longitude and latitude entries were discretized into numbers from 0-24 to aid in ‘classification’. We determined that the model would output a probability distribution over these 25 classes in both the latitude and longitude directions, and we would just multiply the corresponding probability vectors to create a 25*25 probability matrix spanning San Francisco to model a 2-dimensional probability distribution.
ALGORITHMS
We tested a multitude of algorithms on the dataset, of which 3 will be explained in the following paragraphs:
We tried training a simple multi-class logistic regression to predict the 25 classes in both the longitude and latitude axis. Unfortunately, due to reasons I am still trying to debug, the probability distribution was heavily skewed to 2 classes: 16 and 17, which happen to span the infamous Tenderloin (the most notoriously dangerous neighborhood in SF).
We also tried training a simple artificial neural network, which didn’t seem to succeed either. This is likely because the network saw multiple instances of the same input with vastly different outputs, which hindered the network from being able to properly perform gradient descent. The issue wasn;t with the network architecture, rather it was with the problem statement - it is simply mathematically improbable to predict a good probability distribution of crime, an occurrence that is largely random.
Lastly, we tried using a categorical Naive Bayes model. This worked well because it makes naive independence assumptions, hence the name, which helped the model get “less confused”. It also relies largely on historical data, which was useful given our historical dataset. The Naive Bayes model ended up predicting a larger, more robust subset of the 25 classes, and thus, we ended up using this model for our predictions
FIREBASE DEPLOYED CODE EXPLANATION
The entire front-facing portion of the project is developed and hosted with Firebase, which is Google’s app development platform. Firebase was chosen primarily out of convenience. The Firebase service is free if the developer’s application doesn’t take up too much storage or have too much web traffic, and eliminates the need for a separate hosting server by providing its own servers that the developer can directly upload to and have hosted online. Additionally, Firebase also has its own databasing and storage service, making the development of the application much simpler to handle.
Because Firebase largely trivializes the hosting and deployment of the project, most of the actual code in the project is HTML, JS, and CSS stylesheets to supplement them.
The right half of the fieldset contains a small menu/navigation bar. TheThe site’s core page is its home page, or the file titled “index.html” in the actual files. The home page consists of two main elements: the main fieldset containing most of the UI as well as the map itself.
FIELDSET
The "fieldset html object contains two main parts. The left half of the fieldset contains two selections, a button, and a label for the data being displayed on the map. The two selections allow the user to choose a month and a crime type, and the button on the right labelled “go” will take the user to another page that contains a map for that information. These elements are all fairly simple in the actual source code. The selections are merely select objects with hard-coded values, and the “go” button links to a function labelled buttonreact() that takes the user to the page they have selected.
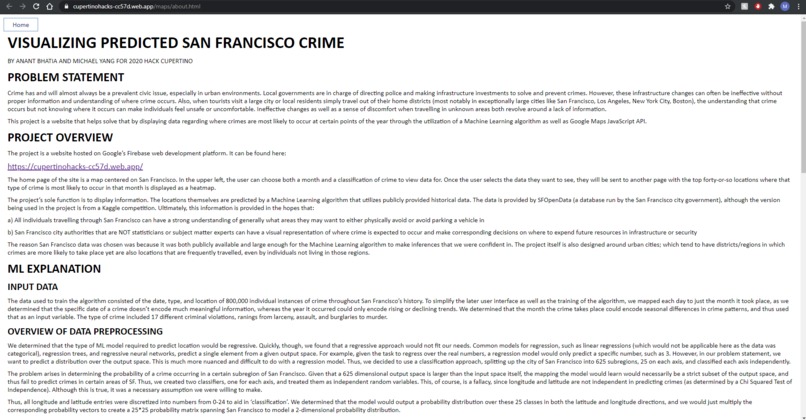
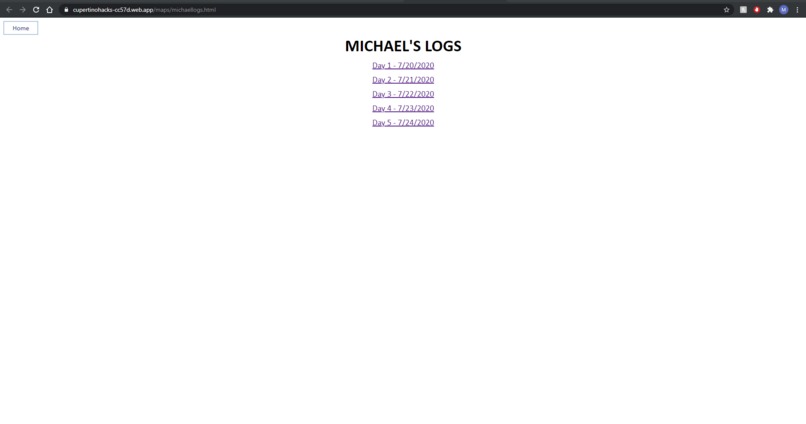
The navigation bar has four buttons, labeled “about,” “ethics,” “michael devlogs,” and “anant devlogs.” The about page will take the user to this location, where they will be able to read about the purpose, inspiration, and technology behind the project. The ethics page will take the user to a short article/blog post written by Michael Yang regarding his considerations of the ethics of predicting locations for crime. The two devlogs pages will take the user to basic pages with links that lead to pages with texts regarding both Michael and Anant’s progression and work process.
The fieldset has some simple css stylesheets that set fonts as well as customize the buttons. The css files were all written from scratch (not taken from online), and, as such, are incredibly simple.
MAP
The map is generated through the Google Maps JavaScript API. The API provides not only the generation of the map itself, but also Latitude/Longitude objects (google.maps.LatLng) as well as functions that allow for the generation of the heatmap.
The map itself is a div object titled “map” in the html code, and the initMap() function is what initializes it when the page is loading. The initMap() function contains two main parts: an implicit declaration of the map variable, as well the implicit declaration of the heatmap variable. The map variable is a reference to the map div object, and comes with preset values that enable certain UI functions or display settings. The map is initialized with a zoom of 13 (which is roughly enough to see San Francisco in its entirety), all UI functions enabled (including things like the ability to rotate the screen, zoom, etc.) except for Google Street View, and with satellite view (which is changeable by the user). The heatmap variable is used to initialize the heatmaplayer object (google.maps.visualization.HeatmapLayer). In initializing the heatmap, the heatmap is given a set of points, a map that it will be placed over (in this case the map variable initialized right above it), and a radius for each point. The set of points is taken from a separate function named locations(), and once that function is run, the map is generated on the page.
The locations() function provides the heatmap with an array of google WeightedLocation objects (google.maps.WeightedLocation). The locations() function has a nested loop of jquery calls. The calls are to a json file titled “resultsfinal.json,” which contains all the points produced by the machine learning algorithm. The outer loop is a $.getJSON function, and the inner loop is an $.each loop. The $.getJSON function produces an array of all the elements in the JSON, and the $.each function selects both the month and classification for the nodes that will eventually be mapped. The $.each’s input is an array formatted as: month[monthnumber].CRIMECLASSIFICATION, which is different for each map page. The loop will then generate a new LatLng object with each point, and push them into an array that is ultimately returned. To make sure that the json file is read and that the map is properly initialized with the heatmap, the jqueries are set to not be asynchronous ($.ajaxSetup({async:false});), this makes sure that the locations() function runs completely and returns a completed array before the map is initialized.
JAVA/PARSING EXPLANATION
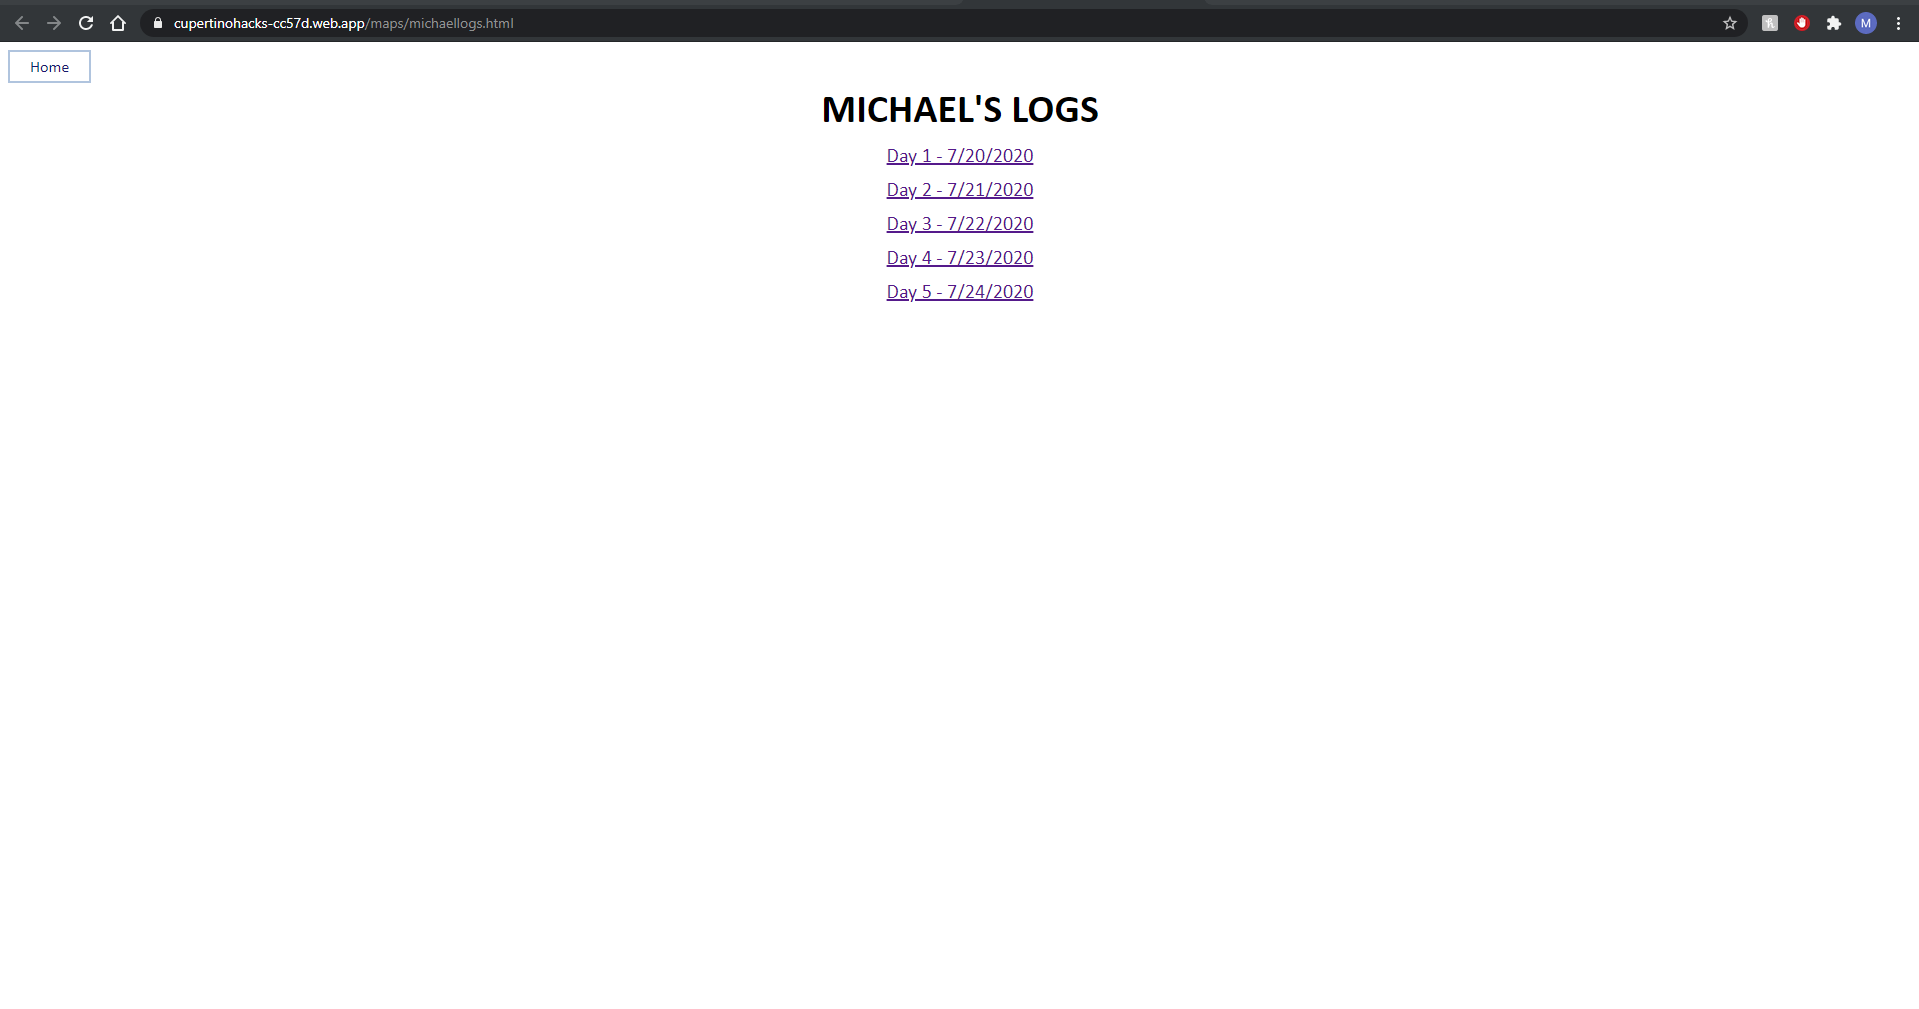
The project contains a few simple Java files. The Java files themselves are not utilized in the front facing portion of the project. However, they are still vital to the project. The Java files are simple processes (they each have their own main function and are independent to one another) that parsed data and generated the html files for each map. The java files themselves can be found in Github, or in Michael’s Day 1, 4, and 5 logs (https://cupertinohacks-cc57d.web.app/maps/michaellogs.html).
The first file (day 1 log) is used to parse the original full dataset csv file into a new csv file that cuts out all information irrelevant to the machine learning step. It takes the original csv and breaks it into a new, four-columned csv containing month, type, latitude, and longitude in that order. More details can be found in the comments of the actual code.
The second file (day 4 log) is an extremely simple process used to remove all the spaces in the json file with the completed data. The machine learning code produced a json formatted as a 3 dimensional array (array[month][type][point]), and, for the sake of convenience in formatting the JS code that would read the JSON, all spaces in the JSON elements were removed. More details can be found in the comments of the actual code.
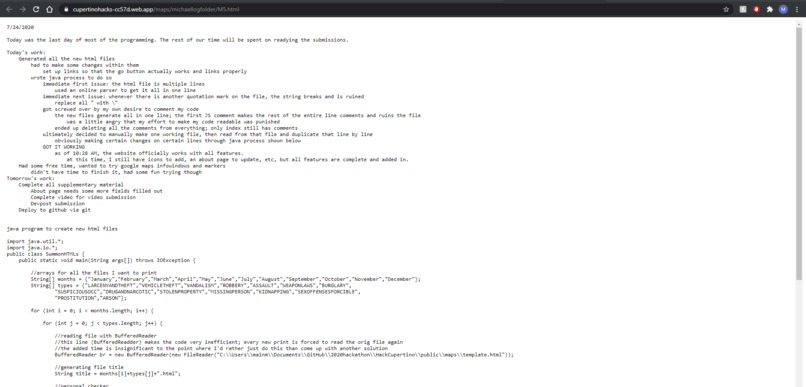
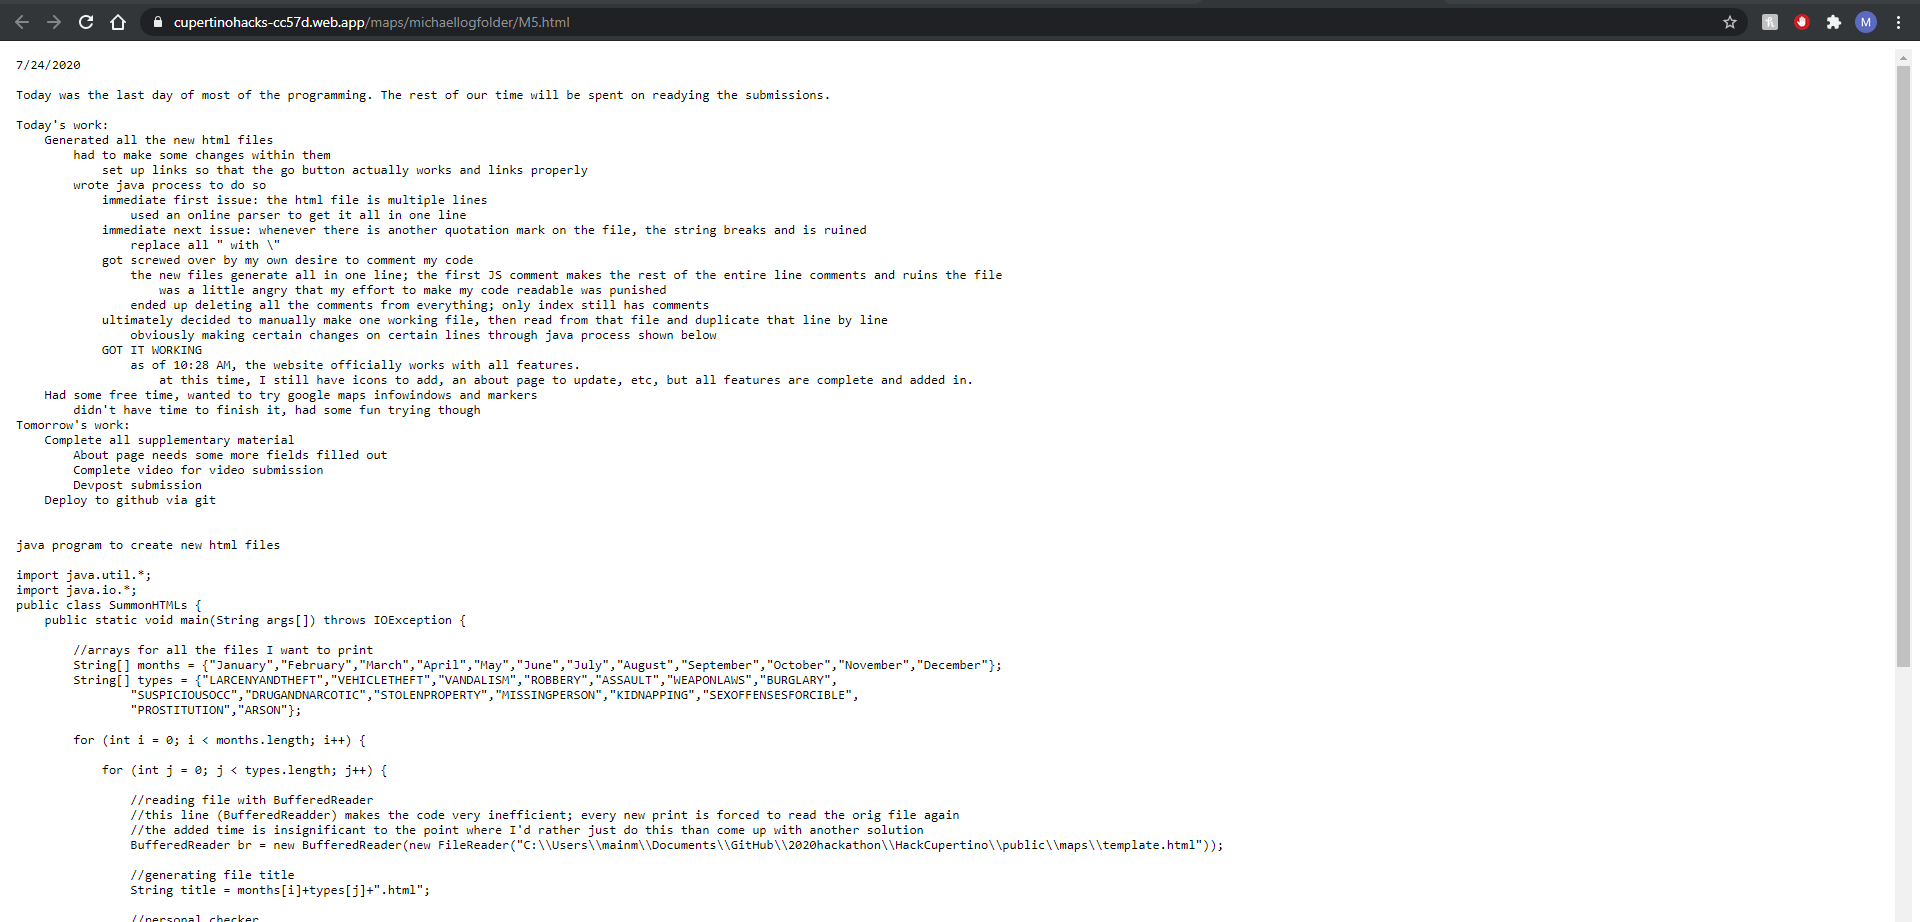
The third file (day 5 log) copies a template html file and prints multiple versions of it (one for each month/type) to the website directory. It simply copies a template line by line, and makes alterations in the locations() function as well as the displayed text in the fieldset to match the data being displayed. More details can be found in the comments of the actual code.
CHALLENGES
All progress and challenges faced are documented in the logs section of the website, at these two links:
https://cupertinohacks-cc57d.web.app/maps/michaellogs.html
https://cupertinohacks-cc57d.web.app/maps/anantlogs.html
ABOUT THE TEAM/PERSONAL GROWTHS
MICHAEL YANG:
Hi! I’m a rising senior at Lynbrook High School with a strong interest in computer science, primarily full stack programming, which I hope to study at university and pursue as a career.
The idea of a project revolving around the display of San Francisco crime has been something that’s interested me for over a year. I had initially experimented with the same dataset in a different hackathon. However, the code written back then was wildly different, both in purpose, quality, and general structure. The project back then had no online hosting, had no ML-inferred data (we just displayed historical data), and displayed the top 100 overall locations where all types of crime occurred, something very different from the project here. I also didn’t write any of the front-end code for that hackathon; a teammate that has since then graduated from high school did.
The project this report depicts is something that I consider a vast improvement and a testament to my coding progress. I’ve rebuilt the entire site with completely new code. I’ve switched the mapping API to Google as opposed to HERE.com, I’ve hosted the site on Google’s Firebase platform. Although it was never used in the final project, I learned a great deal about working with Firebase’s Realtime Database. This project, while far from perfect, was somehow stressful yet also engaging and exciting to work on, and the experience gained from it was absolutely meaningful.
I admit that the front-end code has flaws. It’s not as pretty as I’d like it to be. I claimed to want to become a full stack programmer, but the front-end portion of things is easily not as good-looking as the modern standard for websites. Although I did code it all from scratch and without a template, it’s not really an excuse. Other parts of the scripts are very much a little sloppy. There were some huge issues with the database that led me to scrapping its usage in the final project. None of the code is even close to the modern professional standard.
But for me, this is in many ways still just the beginning. At the end of the day, it was just five days of programming (I only really coded from Monday to Friday), and not even a full 40 hours of actual work. I look forward to being able to do better in the future.
ANANT BHATIA:
Hello, world! I am Anant Bhatia, a rising senior at Lynbrook High School with a strong interest in computer science and mathematics, especially in theoretical machine learning and vision.
I have been exploring machine learning for the past year and a half, and have completed numerous projects involving neural networks. This being said, it was been a while since I have pursued a project with statistical machine learning, and viewed this project as a chance to hone my skills in that area.
I think the most important thing I have learned through pursuing this project is methods of debugging and understanding statistical models. I used Chi Squared analysis and multivariate linearity tests for data exploration, as well as worked with formatting data to make it easy for visualization. I also learned to to look at the mathematics behind each model and the assumptions it makes (such as naive independence assumptions in Naive Bayes algorithms, as well as assumptions of Gaussian distributions in linear models) to debug low accuracy rates in the model’s prediction. Overall, I learned a lot about the pure statistical theory behind pure machine learning models and the resulting methods in debugging said models.
What's next for Visualizing Predicted San Francisco Crime
Potentially, heatmaps will be replaced by markers with linked infowindows; when you click on a point, it can provide an info-window.

Log in or sign up for Devpost to join the conversation.