
Inspiration
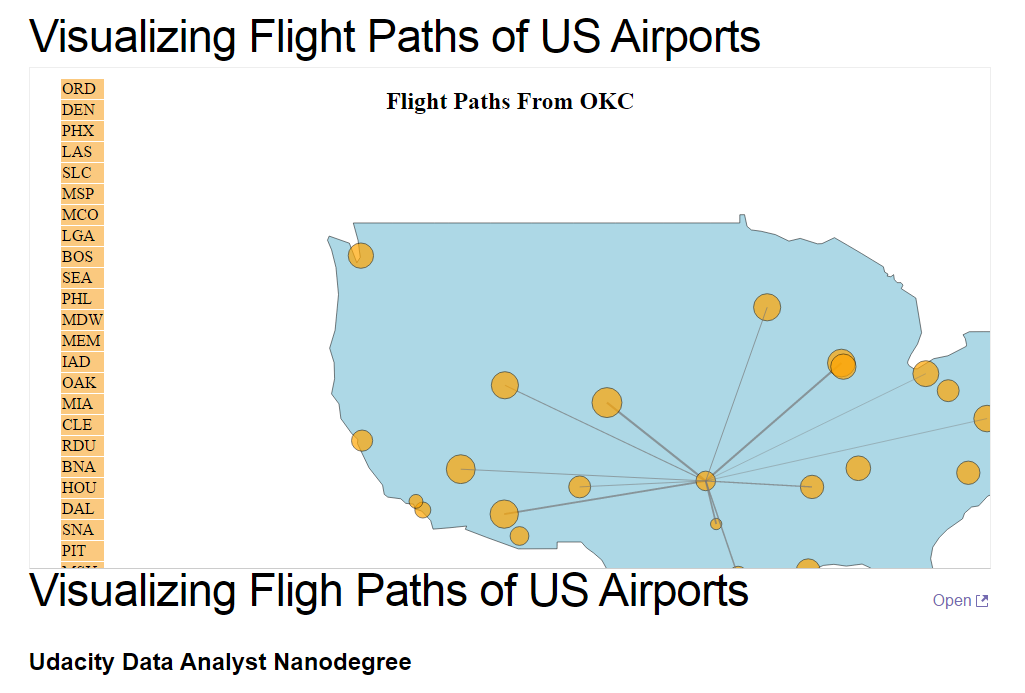
This is the final project of the data visualization course of Udacity Data Analyst Nanodegree. I chose the data of flights of US airplanes because I thought that the data can be visualized on the map nicely using nodes and edges.
What it does
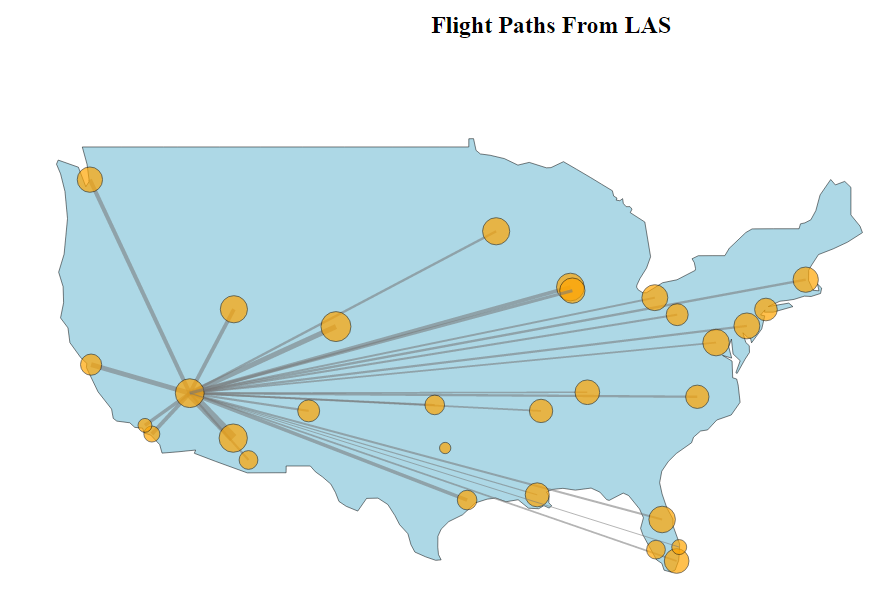
First, it shows the whole edges and nodes where nodes represent the airports and edges represent the possible routes. Then, it shows the edges of each node one at a time. The order of the appearance is based on the activity of the airports. The most active airports are shown first. The width of the edge represents the number of airports flew between the two nodes (airports). When the animation is done, a user can click a node to see the edges of the node.
How I built it
I used Python to parse the flight data and used D3.js to create a visualization.
Challenges I ran into
This was the first time using D3.js so I encountered a lot of errors. Usually, it took me 3 hours to fix the errors, sometimes it took more than a day. The hardest part of the project was to create a static network visualization using force layout.
Accomplishments that I'm proud of
I am glad that I learned how to use D3.js to visualize the data. I believe that this skill will be a great asset as a data scientist.
What I learned
When I first started to learn this data visualization course I was a bit skeptical of its importance. I wanted to learn more about machine learning or more advanced statistics because I thought these things are more practical and useful. However, when I started to create this visualization, I enjoyed using D3.js a lot and I learned that there are so many ways of visualizing the data and D3.js helps me to do anything. I love creating new things using my creativity. I also loved to talk with others and get feedbacks from them to improve my visualization. From such experience, I also learned that interactions with other people can be very helpful and enjoyable.
What's next for Visualizing Flight Paths of US Airports
There are still more things to be done to improve the visualization. I will keep communicate with others and get feedbacks from them to improve the project.

Log in or sign up for Devpost to join the conversation.