-
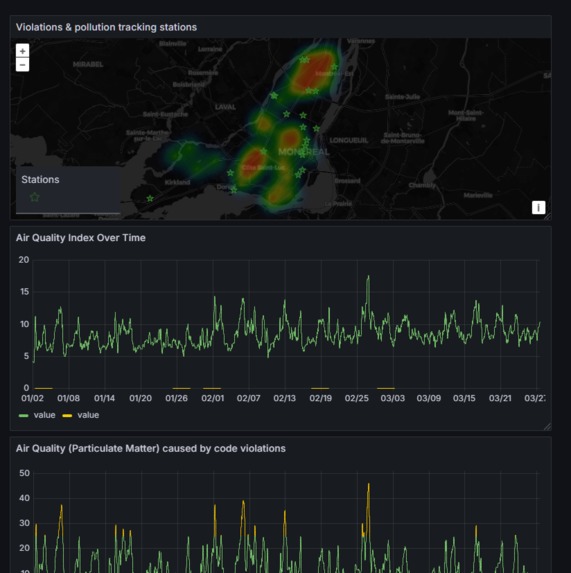
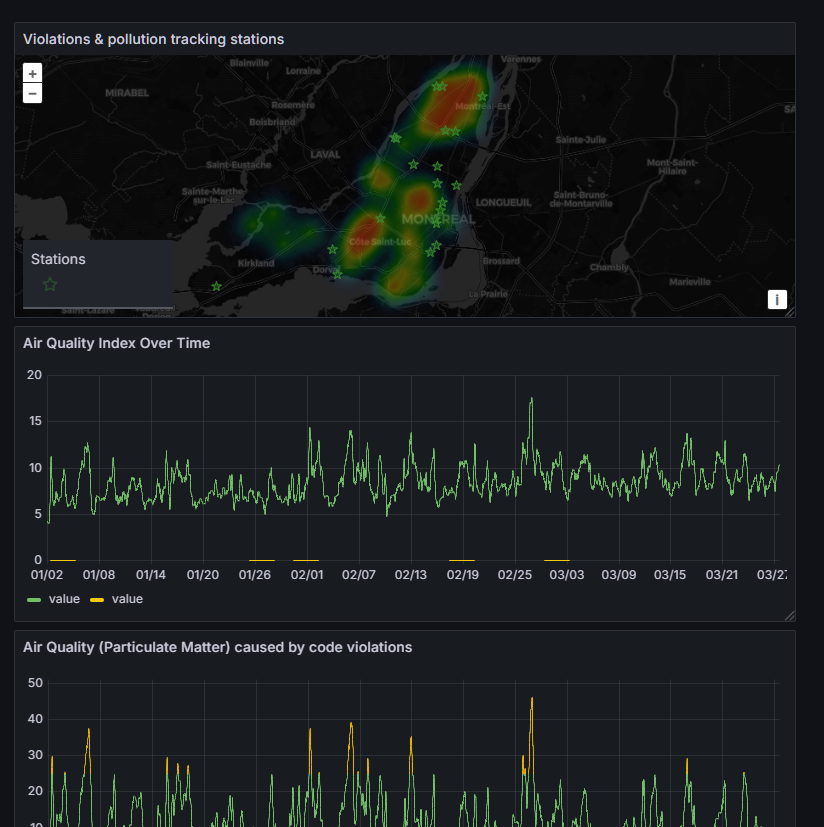
Grafana Dashboard
Inspiration
We were inspired by the growing concern over urban air quality and the need to hold companies accountable for environmental violations. By leveraging Montreal's open data, we aimed to uncover whether industrial non-compliance directly impacts the air we breathe, empowering citizens and policymakers with actionable insights.
What is it?
This project explores the relationship between environmental regulation violations by companies and Montreal's air quality. Using open data sets, we built a Grafana dashboard to visualize trends and correlations between industrial violations and air quality metrics. The dashboard provides clear insights into how non-compliance affects urban air pollution, offering a tool for better decision-making and public awareness.
How we built it
We integrated Montreal's open data sets on environmental violations and air quality metrics into a centralized database. Using Grafana, we created interactive visualizations to map trends and correlations over time. The dashboard was designed to be user-friendly, allowing stakeholders to explore the data and draw meaningful conclusions about the impact of industrial activities on air quality.
Challenges we ran into
Data Integration: Combining disparate data sets with varying formats and timeframes required significant cleaning and alignment.
Correlation Analysis: Establishing a direct causal link between violations and air quality proved complex due to external factors like weather and traffic.
Visual Clarity: Designing a Grafana dashboard that was both informative and easy to interpret required multiple iterations and user feedback.
Built With
- grafana
- influxdb
- postgresql
- python

Log in or sign up for Devpost to join the conversation.