-
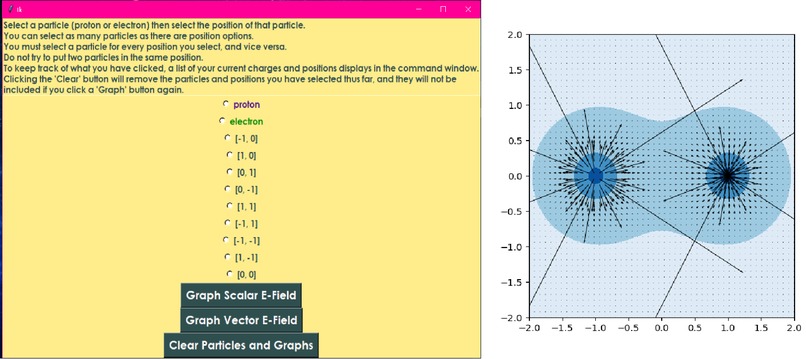
The GUI and a plot of the electric field generated by a proton (left) and electron (right)

Inspiration
I'm on my way to becoming a high school physics teacher and wanted to create an educational tool I could eventually use in my classroom. Electricity and Magnetism concepts have always been hardest for me and having ways to visualize the systems is always helpful. That's why I created this simple tool to visualize the electric field generated by an arrangement of point particles.
What it does
By clicking on a particle type (proton or electron), then clicking a location (one of nine in a grid), you generate a charged particle at that location. You can add up to 9 particles, each in a different location. Then, you can graph the electric field. You can do the actual field (which is a vector field) or the magnitude of the field (which is a scalar field). The vector field is represented with arrows and the scalar field with a color gradient, and the two can be graphed simultaneously by graphing the scalar field first, then the vector field. If you want to start over with a new arrangement of particles, you can clear the existing list. One thing to note: you must click a particle for ever location, and vice versa.
How I built it
I used Python to build this, and used the numpy, matplotlib, and tkinter packages. I started by writing functions to calculate the magnitude of the electric field due to one point charge, then calculated the vector field. From there, I generalized to a multiparticle system. I then used tkinter to create RadioButton widgets to select the charges and locations. After that, I designed the plotting functions and assigned them to tkinter Buttons. As a last touch, I wrote a function and added a button to clear previous inputs.
Challenges I ran into
I have very little coding experience so this was all a challenge. I had never even had Python installed on my laptop (I had only used Google Collaboratory before) so figuring that out and then using the command line was interesting. Learning the ins and outs of creating widgets with tkinter was probably the hardest part of this.
Accomplishments that I'm proud of
I'm so excited that I actually created a working application! This was my first time creating a GUI and I'm very pleased with how it turned out.
What I learned
I feel much more confident in my ability to work with Python. Learning tkinter on the fly strengthened my problem solving skills.
What's next for Visualizing Electric Fields from Point Particles in 2D
I'd like to add other types of charge distributions besides point particles, such as hollow spheres or line charges.


Log in or sign up for Devpost to join the conversation.