-
-
3D Vectors
-
AI Tutor + Graph Tool
-
2D Planes
Inspiration
I'll be honest — linear algebra almost broke me.
Not because I couldn't do the calculations. I could. But I had no idea what I was actually doing. I'd compute eigenvectors, multiply matrices, solve systems of equations — and feel nothing. No intuition. No understanding. Just symbols on a page.
When my professor wrote \( A\mathbf{v} = \lambda\mathbf{v} \) on the board, I could solve it. But I couldn't see it.
That's because I'm a visual learner. I don't understand things until I can see them. And math, the way it's taught, gives you almost nothing to look at. So I built Visualize.
What It Does
Visualize is an AI-powered STEM education tool that makes linear algebra and calculus visible.
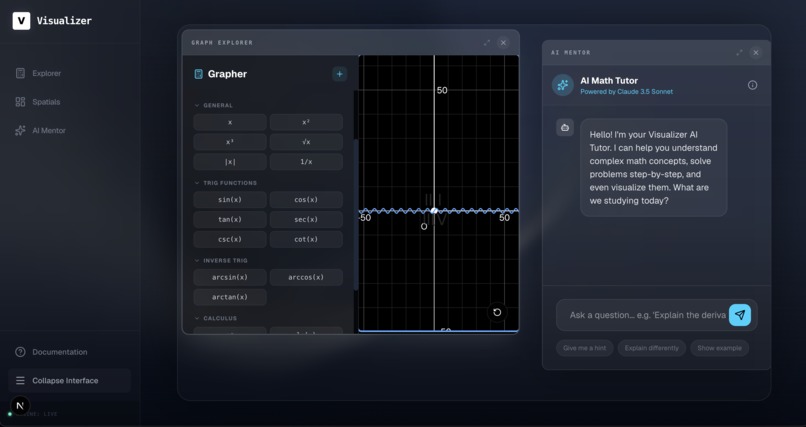
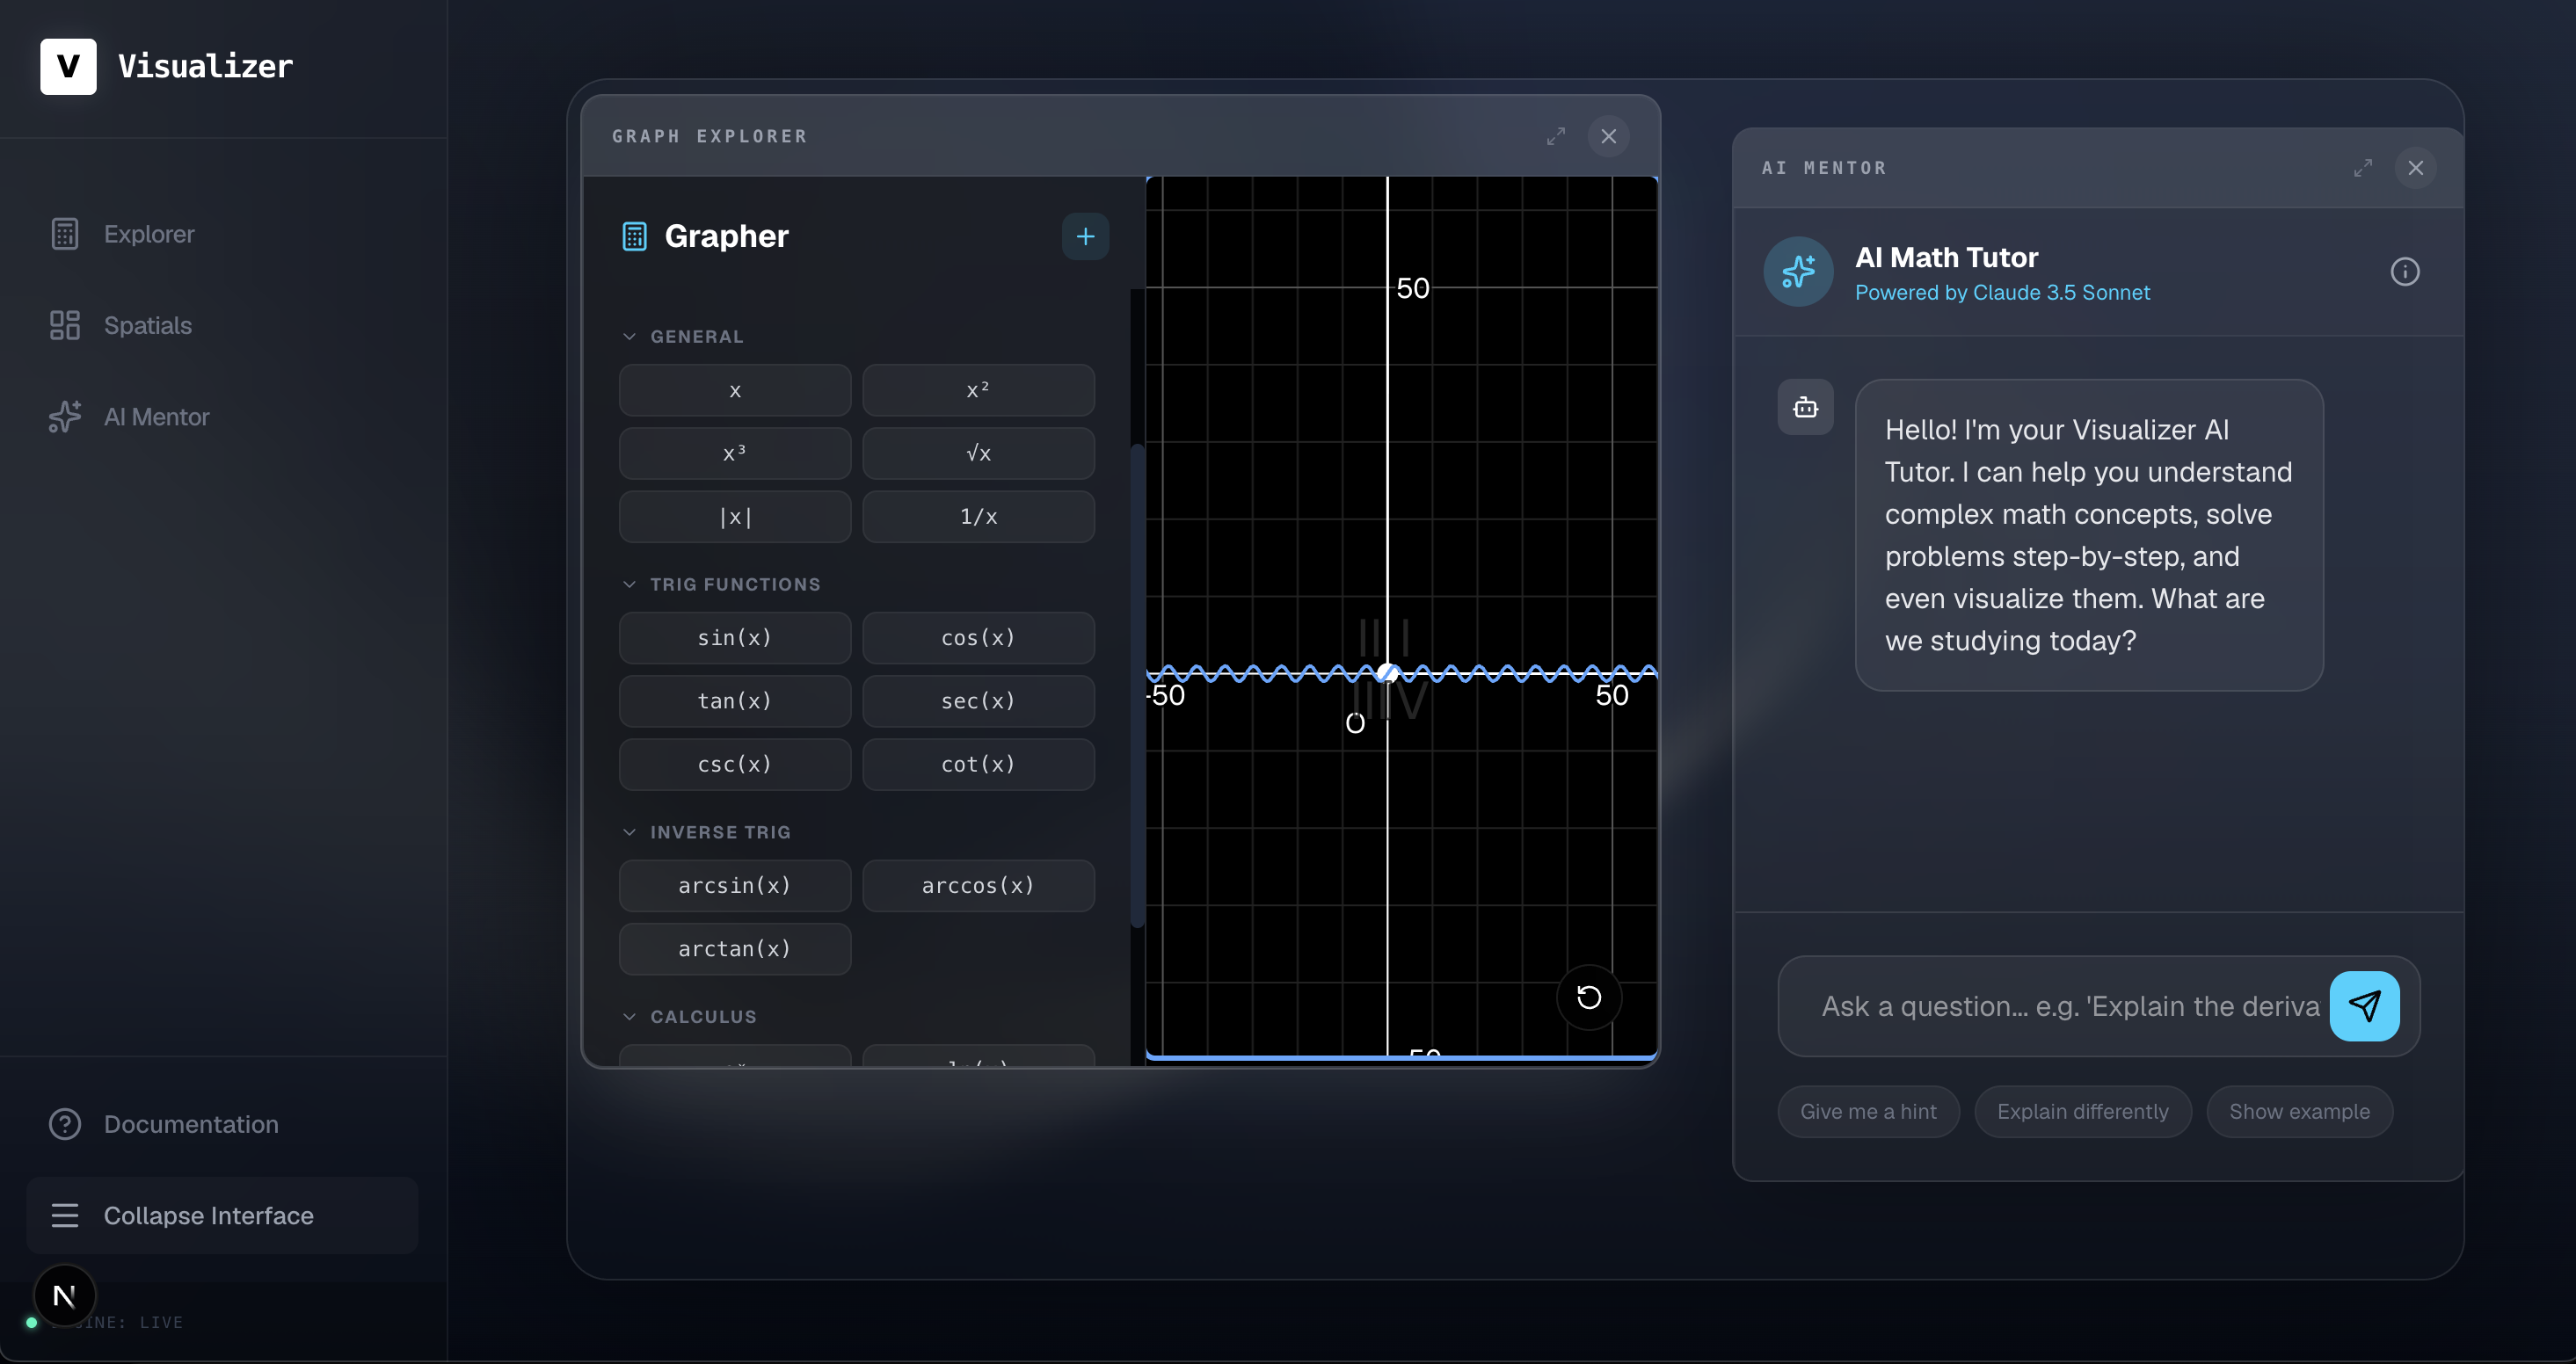
Function Grapher
Plot any function with a full coordinate system, intersection points, and adaptive tick scaling. Supports general functions like \( f(x) = x^2 \) and \( f(x) = \frac{1}{x} \), trig functions, inverses, and calculus tools including numerical \( f'(x) \) and \( \int f(x)\,dx \).
2D Vectors
Interactively explore:
- Vector addition — tip-to-tail animation with resultant \( \mathbf{a} + \mathbf{b} \)
- Scalar multiplication — live scaling with direction flip for negative scalars
- Dot product — shaded angle arc and live readout of \( \mathbf{a} \cdot \mathbf{b} = |\mathbf{a}||\mathbf{b}|\cos\theta \)
- Line intersection — two lines defined by \( ax + by = c \), solved as a \( 2 \times 2 \) system
- Span — visualize \( c_1\mathbf{v}_1 + c_2\mathbf{v}_2 \) sweeping a parallelogram with sliders
Eigenvalues
Watch the characteristic polynomial resolve live:
$$ \det(A - \lambda I) = \lambda^2 - \text{tr}(A)\lambda + \det(A) = 0 $$
Eigenvectors render as arrows that stay fixed while the transformation warps surrounding space. Diagonalization displays as:
$$ A = PDP^{-1} $$
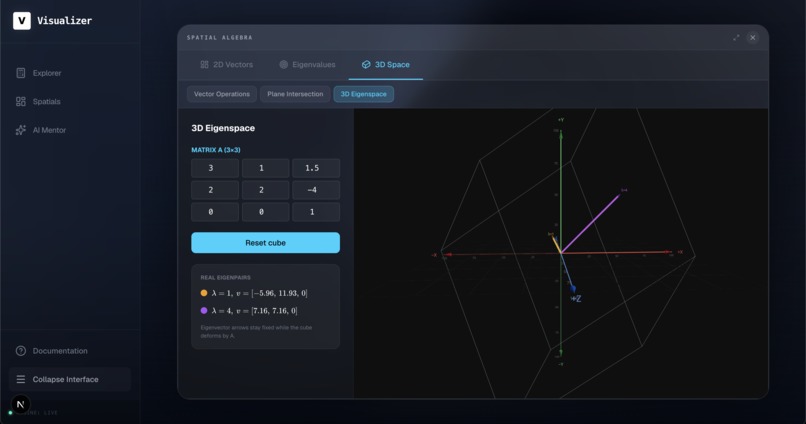
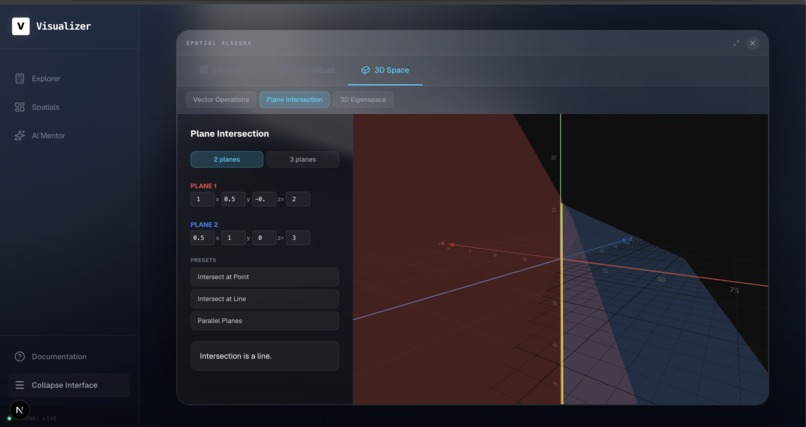
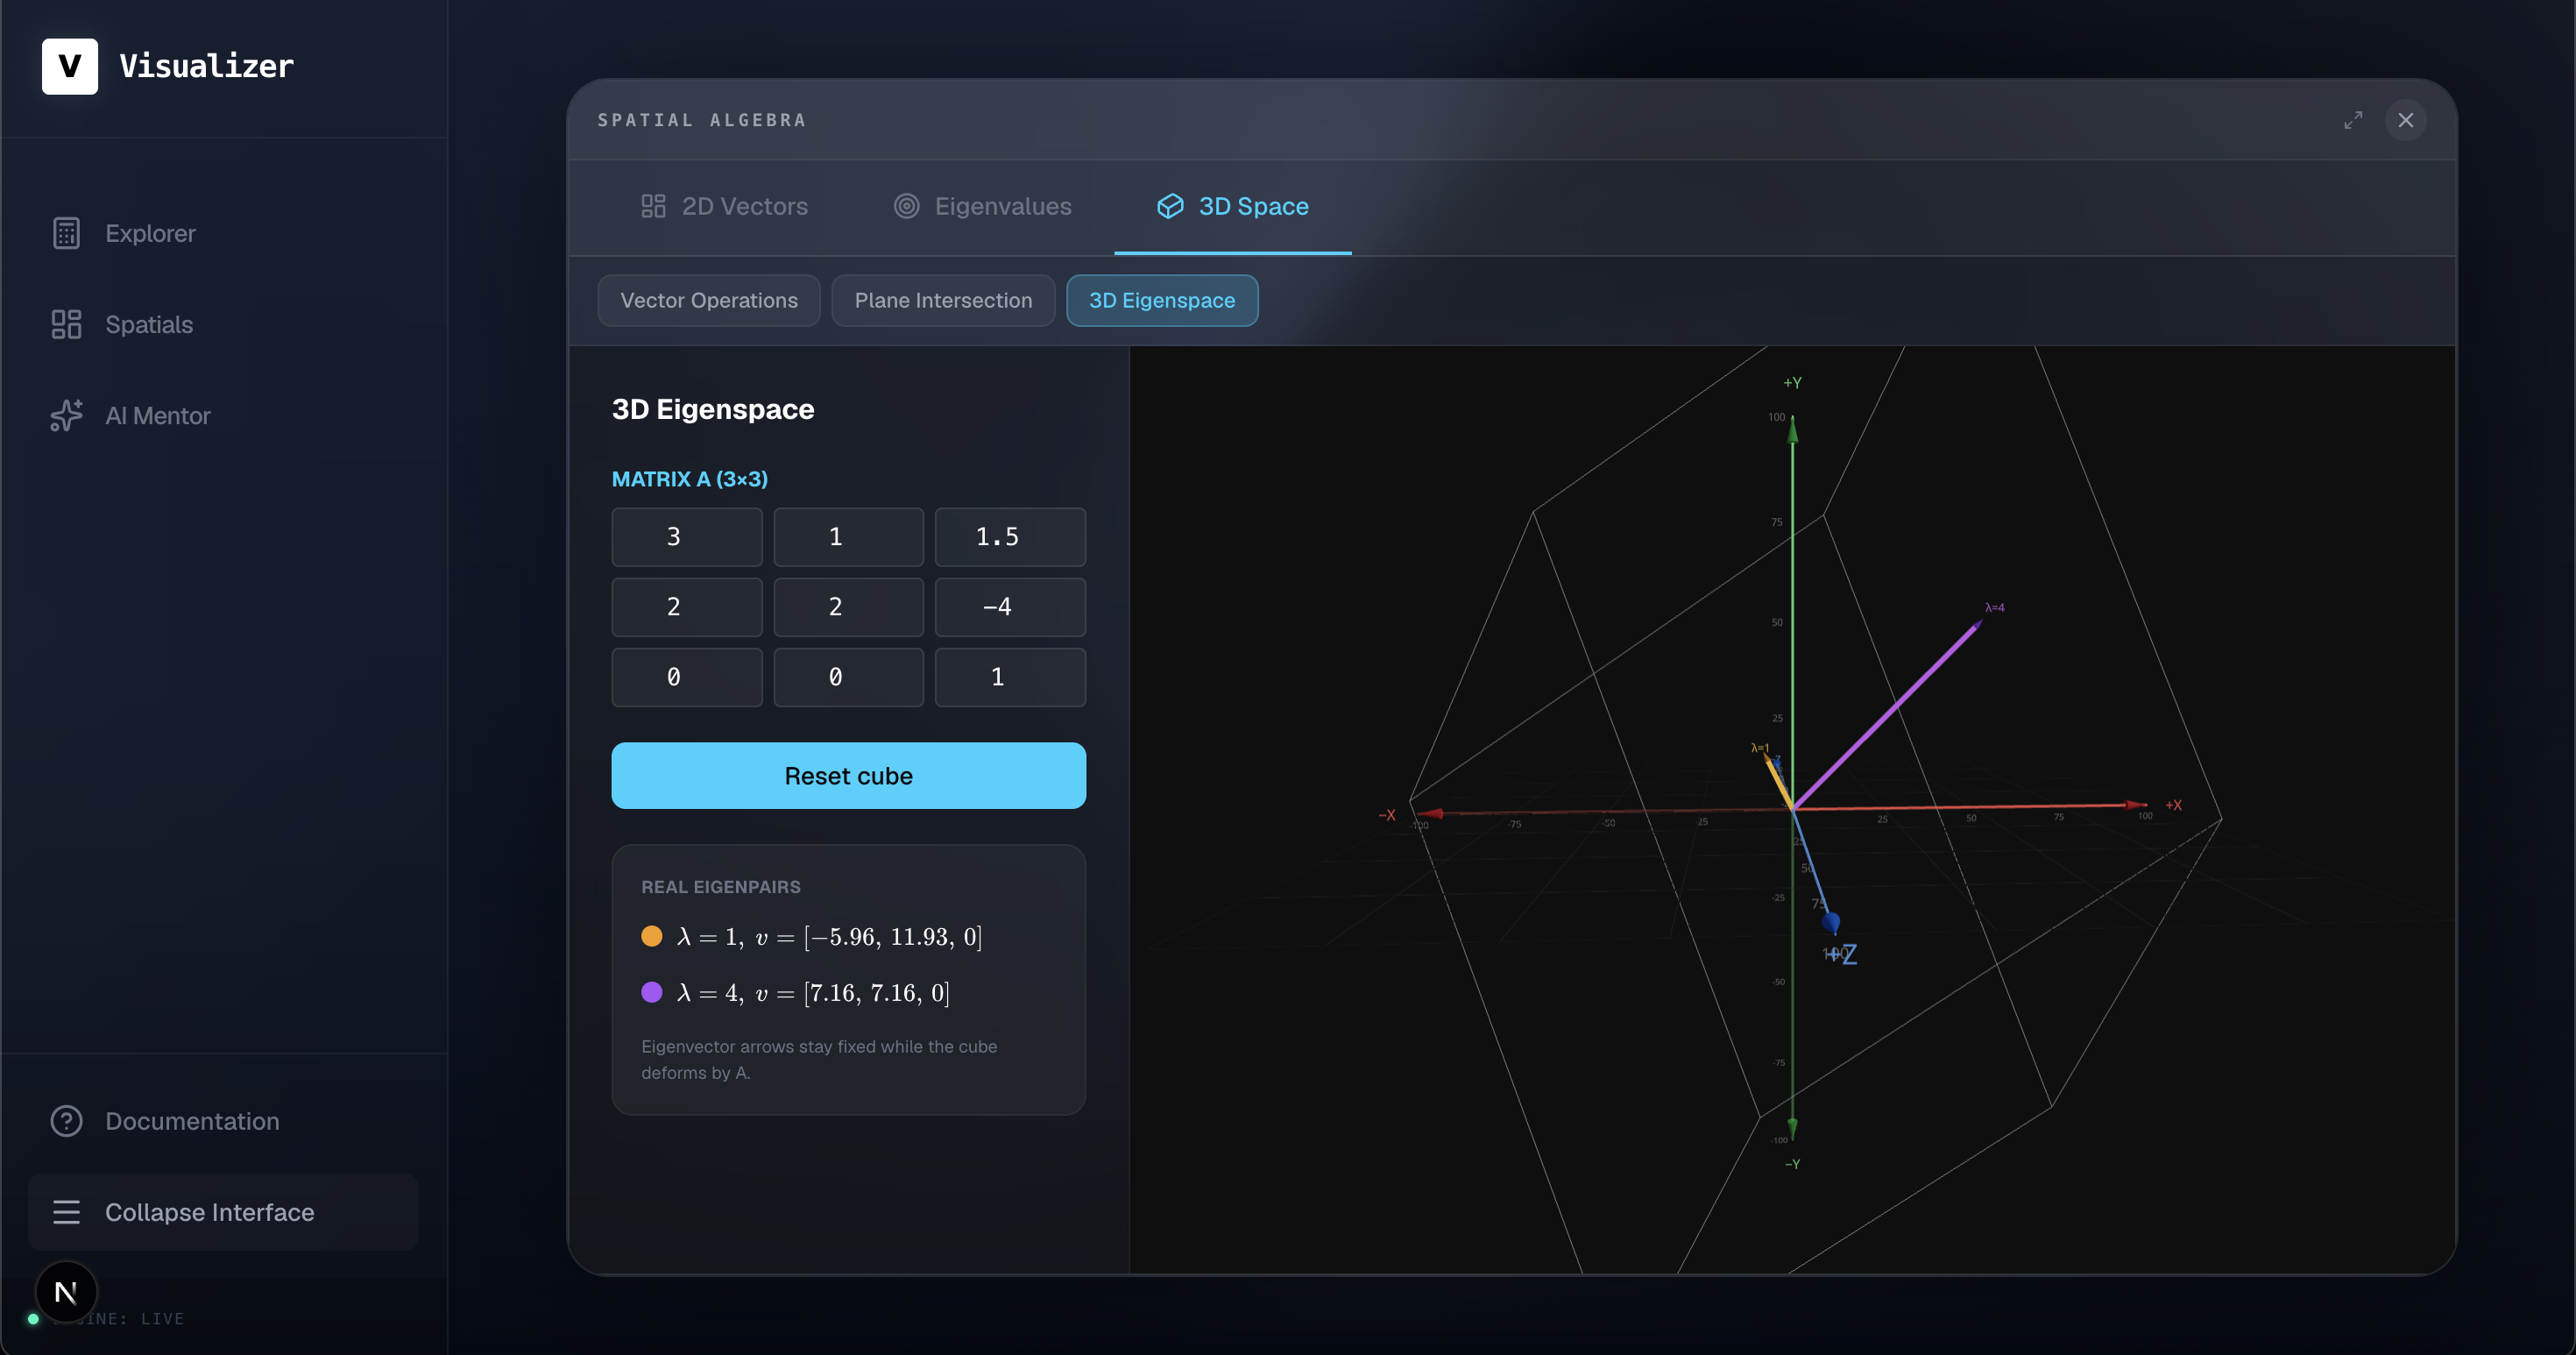
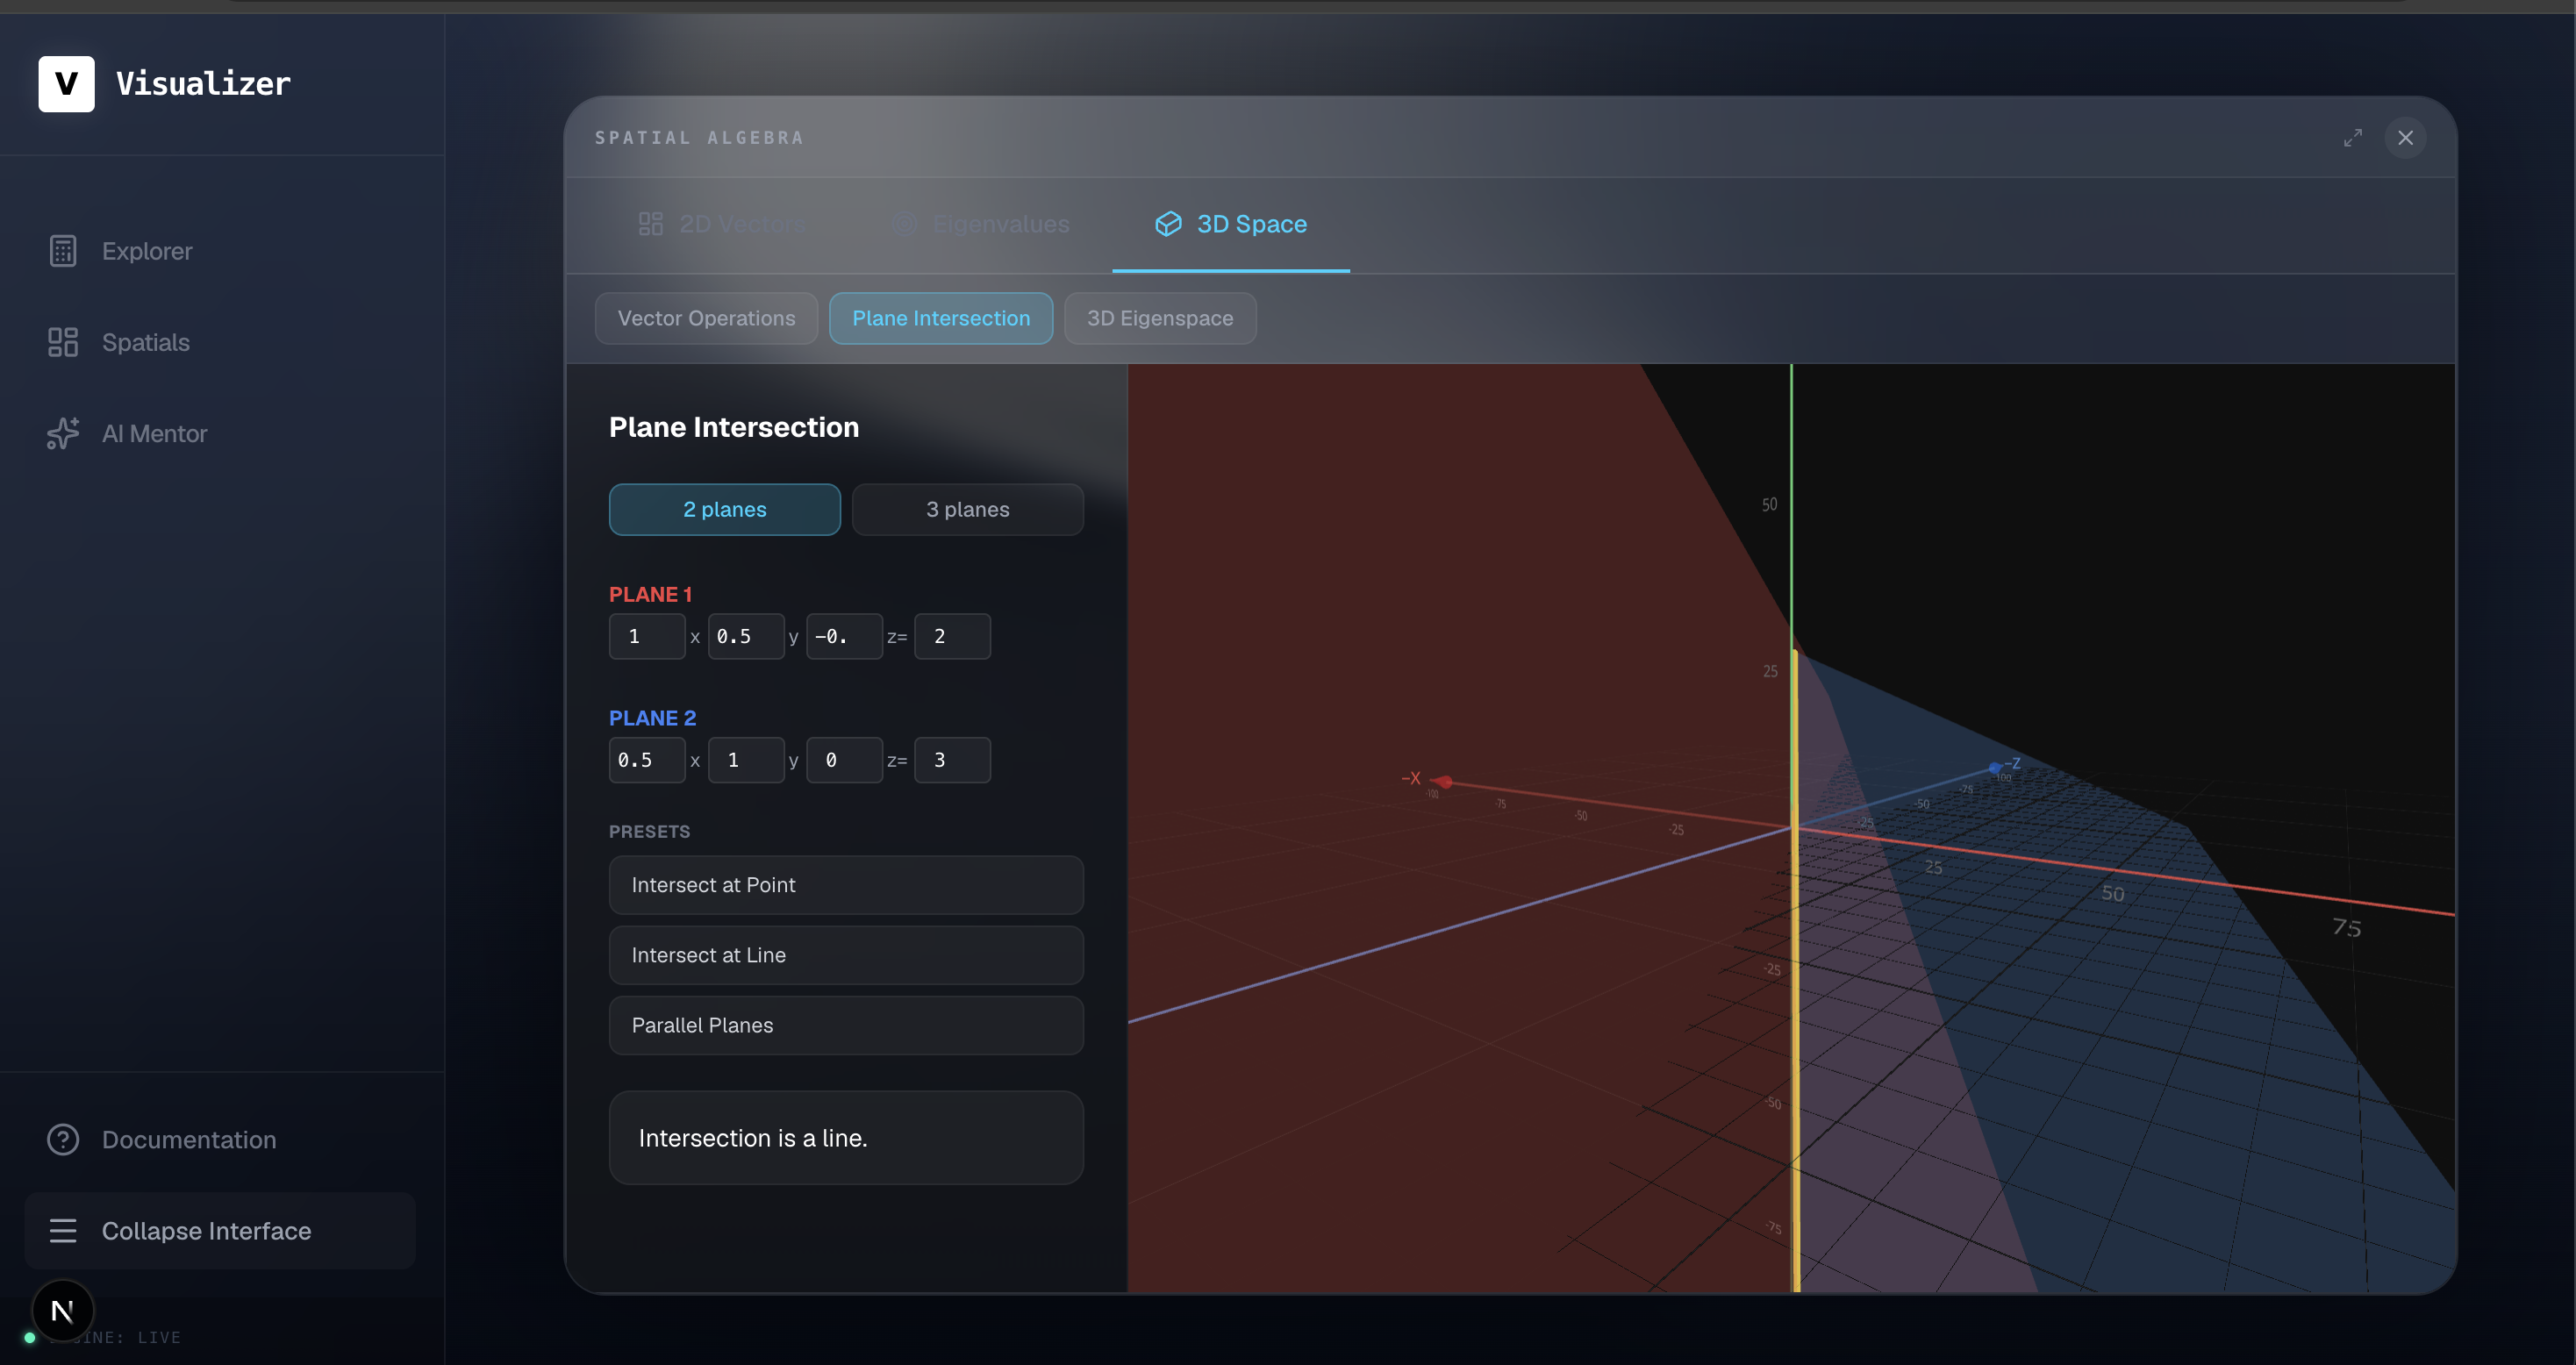
3D Space
A full \( \pm 100 \) unit 3D environment with orbit controls:
- Cross product \( \mathbf{a} \times \mathbf{b} \) with visual perpendicular arrow and parallelogram span
- Plane intersection — input planes as \( ax + by + cz = d \), rendered as transparent meshes with computed intersection lines and points
- 3D eigenspace with transformation animation
AI Mentor
A built-in Claude-powered tutor that knows exactly which visualization you're on and explains it in plain English — not textbook language. Just a direct answer to what's on your screen right now.
How I Built It
| Layer | Technology |
|---|---|
| Framework | Next.js 14 (App Router) |
| Styling | Tailwind CSS |
| 2D Visualization | Mafs.js |
| 3D Visualization | React Three Fiber + Three.js |
| Math Engine | math.js |
| AI Mentor | Anthropic Claude API (streaming) |
| Deployment | Vercel |
The AI Mentor routes through a Next.js API handler so the key never
touches the client. Responses stream token-by-token using
client.messages.stream().
Challenges I Ran Into
Hydration mismatches — Three.js and Mafs both manipulate the DOM
after mount, causing React to throw hydration errors on every load.
Fixed by wrapping all visualization components in dynamic() with
ssr: false and mounting client-only content behind a useEffect guard.
math.js breaking change — math.eigs() in v11 renamed .vectors
to .eigenvectors, and the return structure changed from a matrix to
an array of { value, vector } objects. Silent runtime crash on the
eigenvalue tab.
3D spatial calibration — Getting a \( \pm 100 \) unit scene to
feel correct required tuning camera position, fov, far clipping plane,
grid density, and OrbitControls damping.
Numerical methods — Implementing a stable derivative using central differences:
$$ f'(x) \approx \frac{f(x+h) - f(x-h)}{2h}, \quad h = 10^{-5} $$
Required careful handling of domain boundaries and discontinuities like \( \tan(x) \) and \( \ln(x) \).
What I Learned
The gap between being able to do math and actually understanding it is a design problem.
The concepts aren't too hard — they're just invisible. When you can watch \( A\mathbf{v} = \lambda\mathbf{v} \) happen in real space, when you can drag a slider and see a plane rotate and its intersection line shift, the intuition clicks in minutes instead of weeks.
What's Next for Visualize
- Calculus tab — Riemann sums, Taylor series, implicit differentiation
- 3D eigenspace animation — watch \( A \) warp the unit sphere into an ellipsoid while eigenvectors stay fixed
- Shareable links — send a specific setup directly to a classmate or professor
- Mobile support — full interactivity on the go
Built With
- framer-motion
- google-gemini-api-(@google/genai)
- katex
- mafs
- mathjs
- next.js-16
- react-19
- tailwind-css
- three.js-(react-three-fiber-+-drei)
- typescript

Log in or sign up for Devpost to join the conversation.