Inspiration
Our project was heavily inspired by bringing more awareness to what we think are interesting mathematical concepts that are also visually appealing.
What it does
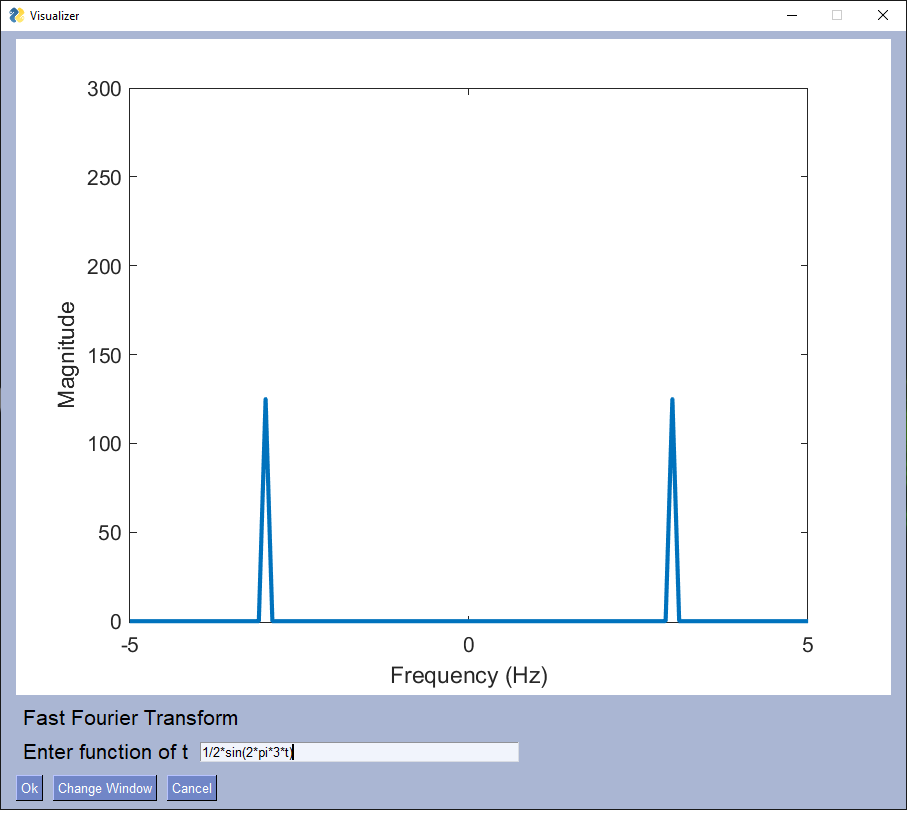
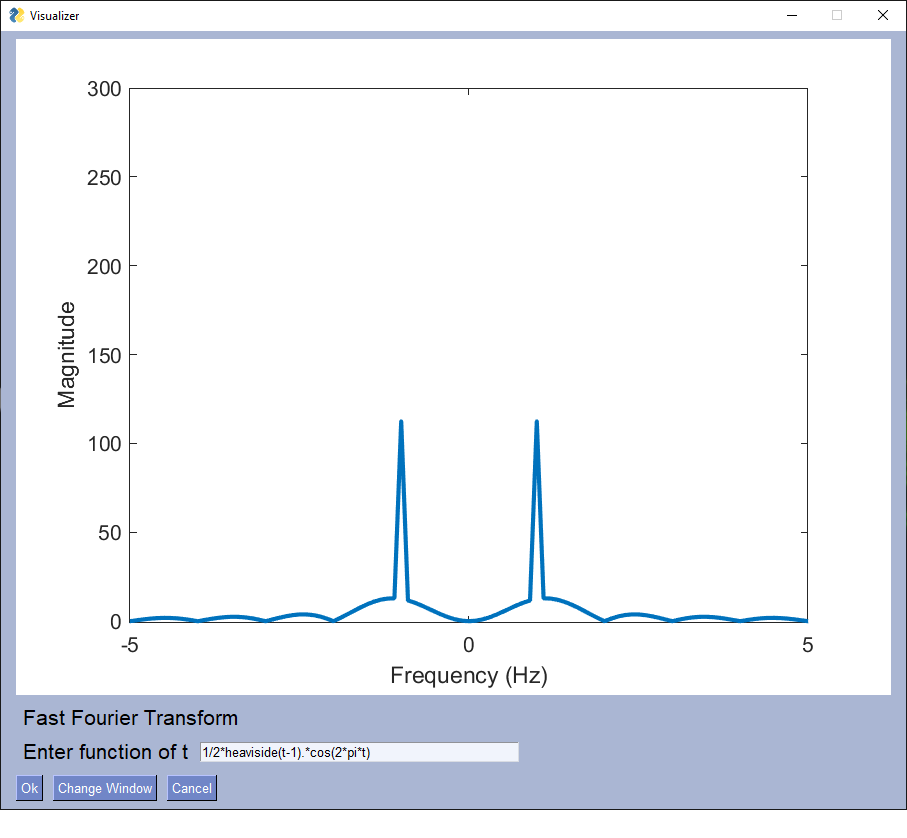
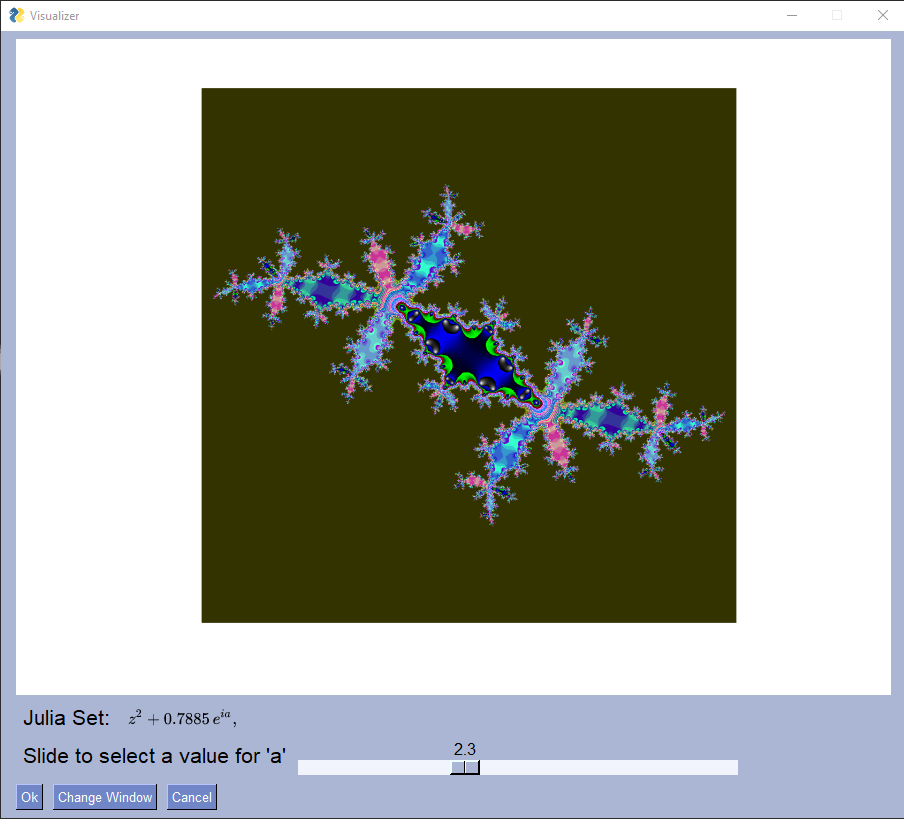
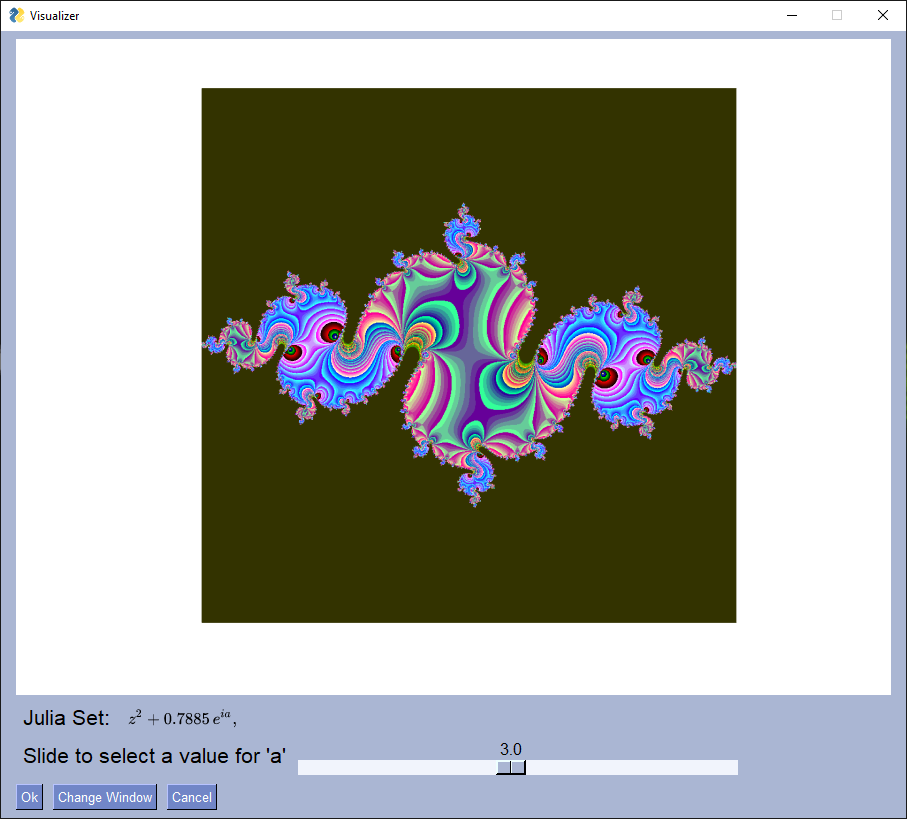
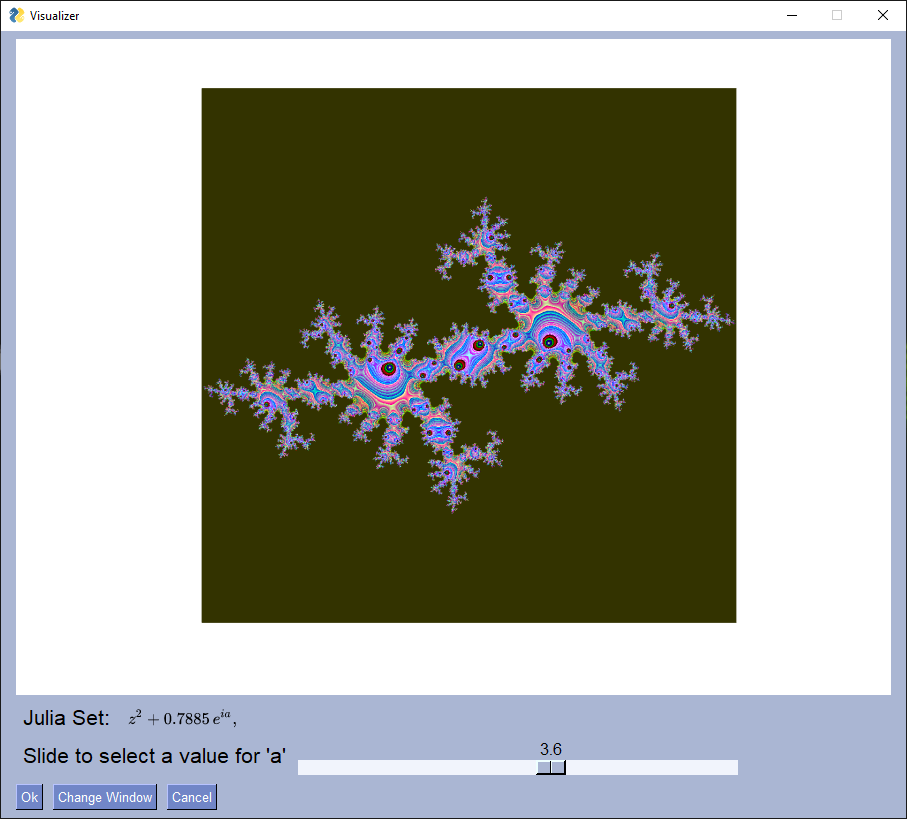
Our project is a graph visualizer for math concepts such as fractals and Fourier transforms (for now).
How we built it
We did the math computations and graphing in MATLAB and Python calls the MATLAB scripts and also takes care of the GUI through PySimpleGUI
Challenges we ran into
Neither one of us has ever built a GUI nor linked a MATLAB script within a Python one. On the theoretical side of things, we spent a bit of time looking into the math and understanding what input and output parameters we would need to get the graph and then checking to see if our results made sense.
Accomplishments that we're proud of
By the end of this, we managed to make a GUI to display MATLAB plots with the help of multi-threading and pushing data onto a queue. All of these were either completely new concepts we had to learn or concepts we learned in school but were applying for the first time outside of the classroom.
What we learned
We learned how to use PySimpleGUI and how to link a MATLAB plot and script with Python. We also learned more about fractals, in particular Julia sets which we knew little to nothing about prior to this project.
What's next for Visualizer
As a next step for this project, we would expand its functionality by including matrix multiplication, calculus, LaPlace transforms and some circuits. For the GUI, we would try to make the graphs editable by allowing the user to change the axes range and to zoom in and out of the plot.


Log in or sign up for Devpost to join the conversation.