What it does
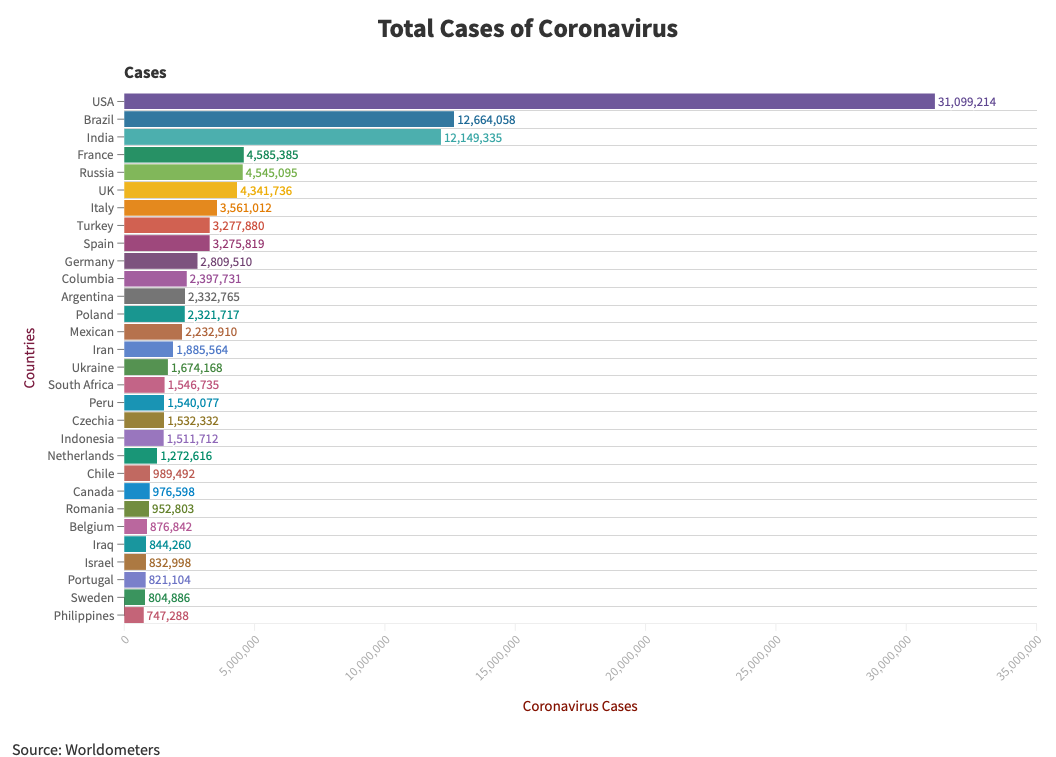
Displays the total cases of coronavirus since the pandemic start in December 2019
How we built it
I use Flourish to create this project
Challenges we ran into
Explore how to use Flourish
Accomplishments that we're proud of
I'm proud of my colourful chart
What we learned
I learned how to use Flourish and data visualization
What's next for Visualized Data of Coronavirus Cases
I'm looking forward to add more countries in the chart


Log in or sign up for Devpost to join the conversation.