-
-
Display
-
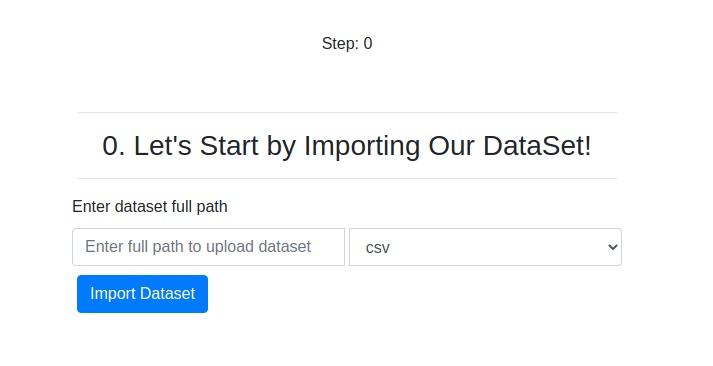
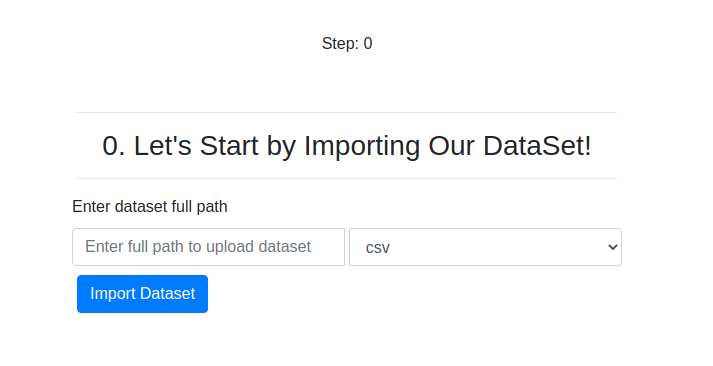
Importing dataset
-
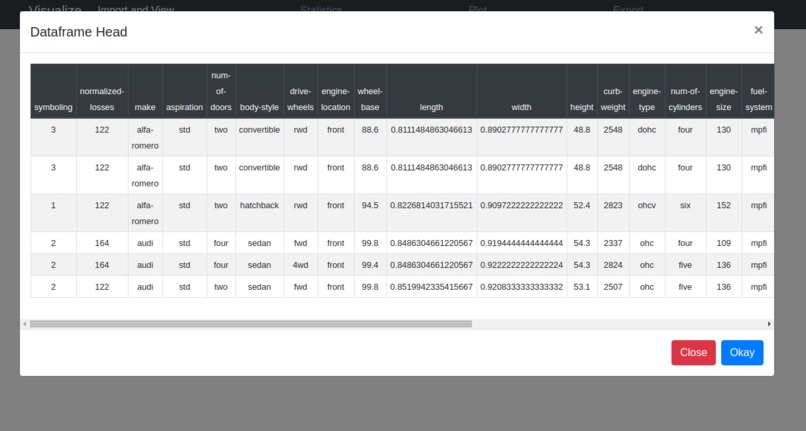
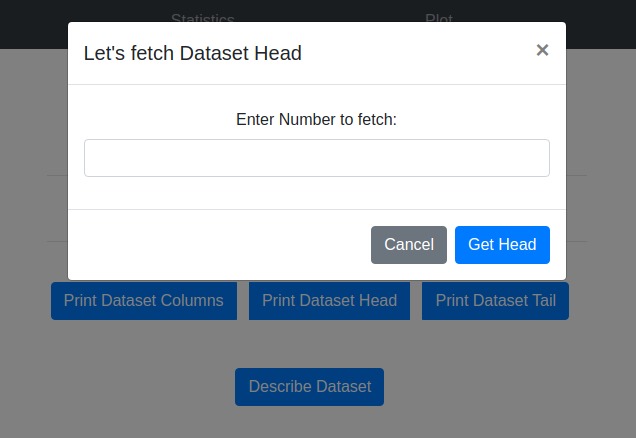
Printing Head
-
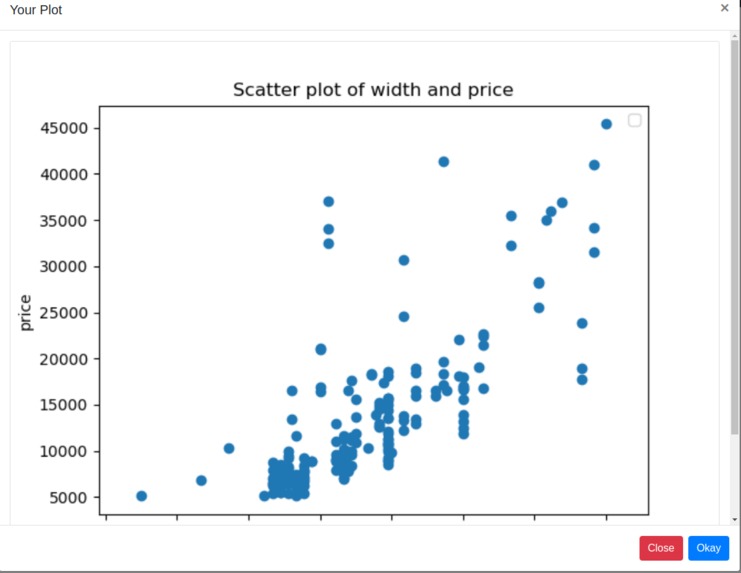
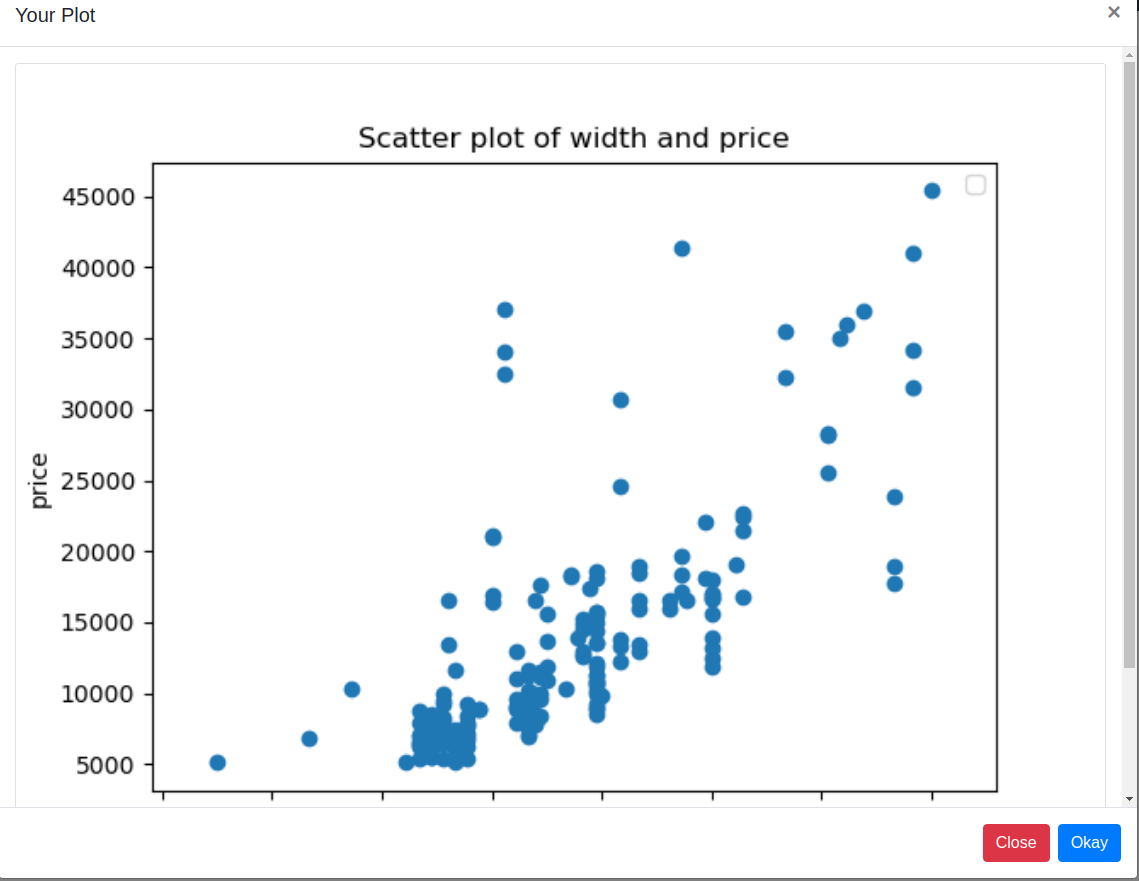
sample plot


Inspiration
Working with tools like pandas can be confusing at times from having to look up all the methods and parameters they require, I wanted this to be a little simpler.
What it does
With Visualize, all you need is just your dataset(remote or local) and you can pretty print and see all its properties, from columns, statistics, plot all sort of graphs, and even export the dataset to other formats when done
How we built it
Using Flask and a few python libraries most especially Pandas, Visualize came to live.
Challenges we ran into
- Time frame is short to get something concrete
- Displaying beautiful tables was a little tricky since it had to be universal.
- Avoiding code repetition especially on the frontend was very difficult.
Accomplishments that we're proud of
Haha to be able to format and present all types of plot :)
What we learned
A little about some pandas built-in methods I tried writing on my own not knowing they already existed.
What's next for Visualize
To probably make it a global product.


Log in or sign up for Devpost to join the conversation.