-
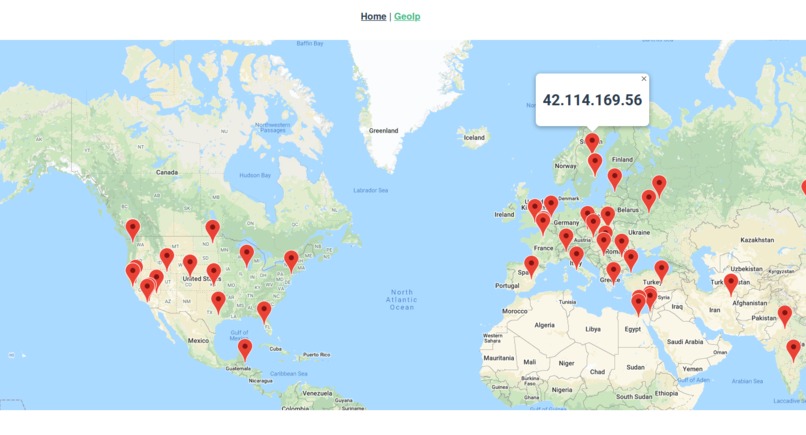
Example data
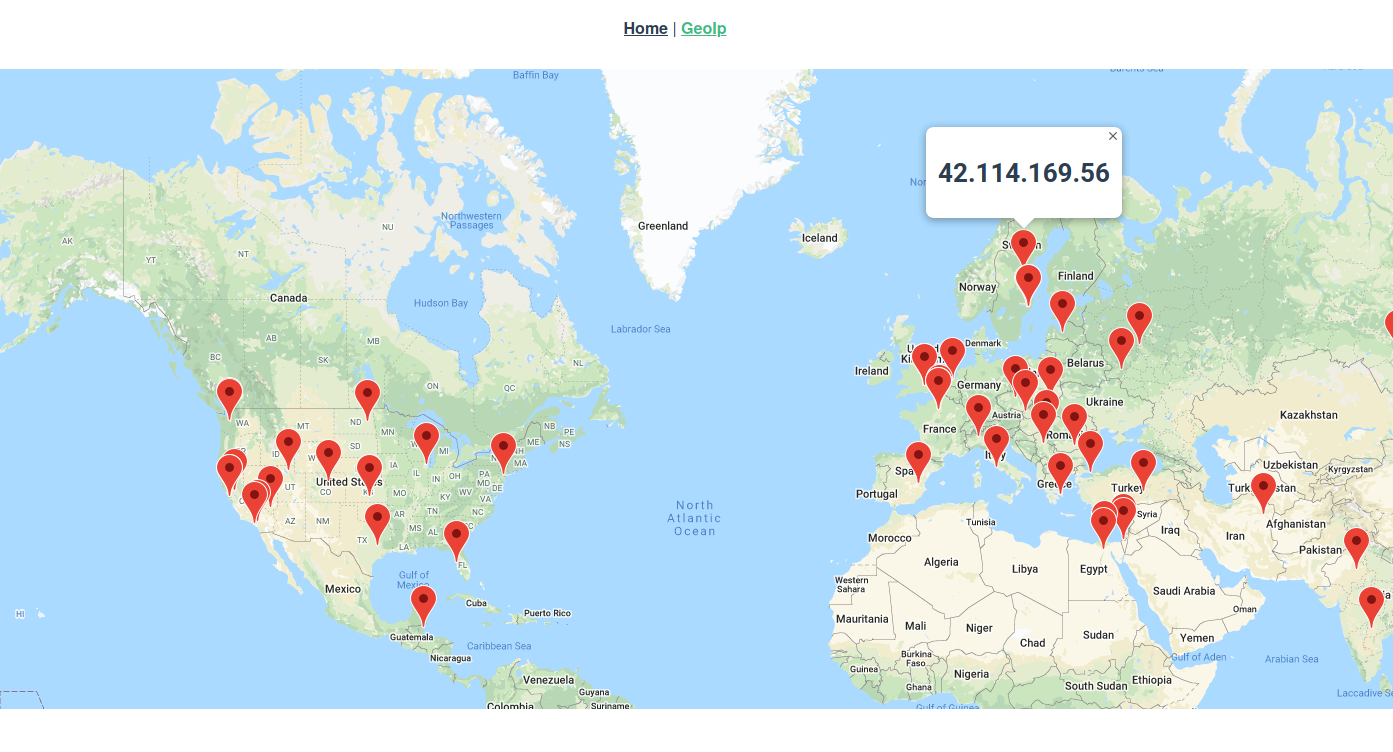
Inspiration
The mirai botnet hits every single external ip (besides GE and US-DOD) on average once every 8 seconds.
Thats a lot. Visualizing and creating awareness to the nature of botnets and network attacks/vulnerabilities becomes more important with zero days and infosec leaks looming seeemingly more and more.
What it does
Displays server logs in a managable fashion from logs collected from server requests/connections/rpc calls/shell connections
How I built it
With python and GraphQL server running an ASGI web app hosted on GCE.
Challenges I ran into
Getting deployment working in GCE
Accomplishments that I'm proud of
It has a fully fledged SQL -> ORM -> GraphQL API backend that just flies.
What I learned
GraphQL query notation
What's next for Visualize Attacks
Custom data visualization from user defined queries rather than static display.

