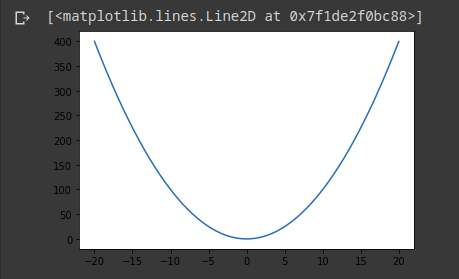
output Graph of a squared function import matplotlib.pyplot as plt import numpy as np x = np.arange(-20,20,0.01) plt.plot(x,x**2) Built With matplotlibnumpypython
Updates Yaswanth Bytasandram started this project — Jan 13, 2021 10:34 AM EST Leave feedback in the comments! Log in or sign up for Devpost to join the conversation.
Yaswanth Bytasandram started this project — Jan 13, 2021 10:34 AM EST Leave feedback in the comments! Log in or sign up for Devpost to join the conversation.

Log in or sign up for Devpost to join the conversation.