Inspiration
From the challenge mentioned in INIT 2022 Day 3
What it does
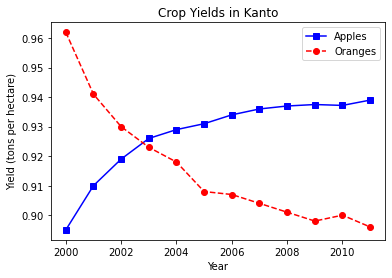
It shows how to visualize data using line chart.
How we built it
Using Python and Matplotlib.
Challenges we ran into
No as such.
Accomplishments that we're proud of
Revised data visualization.
What we learned
Line Chart
What's next for Visualization-init
Will have much more charts and graphs in future.
Built With
- matplotlib
- python

Log in or sign up for Devpost to join the conversation.