-
Interactive map
Inspiration
What it does
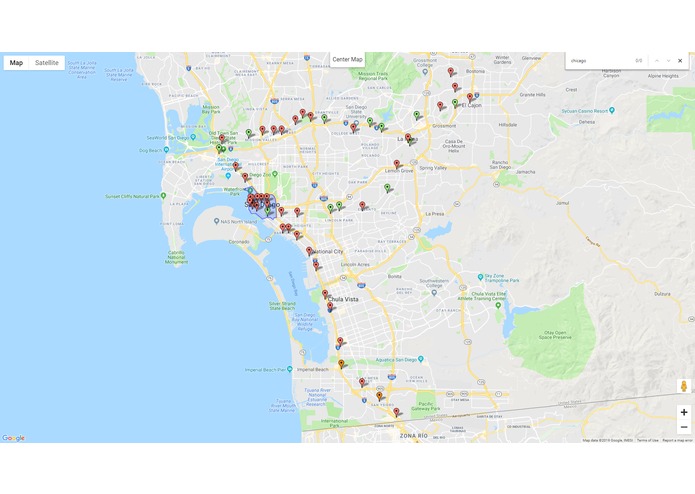
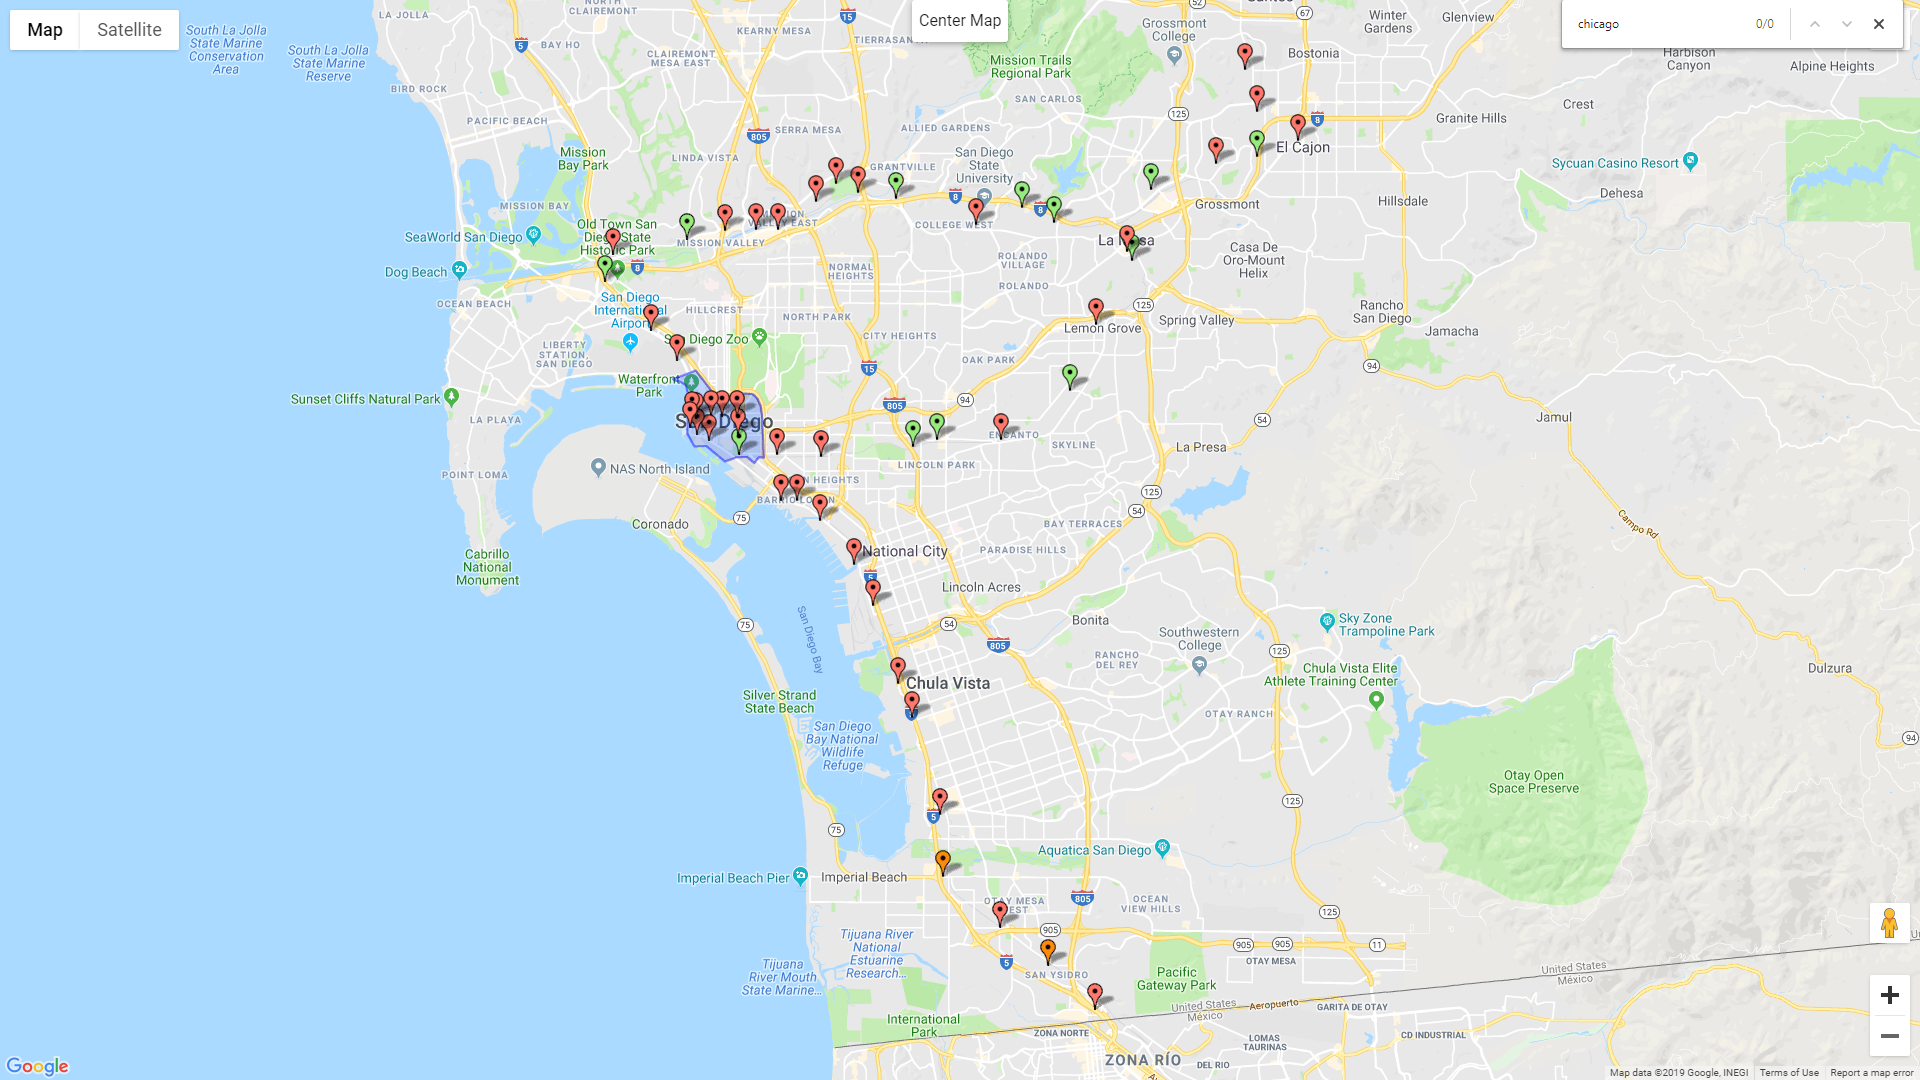
Utilize google maps and java script to pull and plot relevant data. Create an interactive map using filters and display the associated data points. Users can input their own data points to update the map
Project must include the following:
- Will not require additional software installation
- Load data from multiple data sources, e.g., City IQ, City of SD Criminal data, City of San Diego Accident data
How I built it
Using google-maps and JavaScript. the data is pulled from cityIQ as well as accident and transportation databases.
Challenges I ran into
Google maps is not free
Accomplishments that I'm proud of
It's a simple tool with a lot of applications
What I learned
There are infinite possibilities with google-maps
What's next for Visualization for the City
Adding Data tables

Log in or sign up for Devpost to join the conversation.