Inspiration
It's been a massive struggle finding good new music recently, most songs are found on TikTok and are very overplayed and repetitive. That's what sparked my idea of Visualised, a place that could help you find your music.
What it does
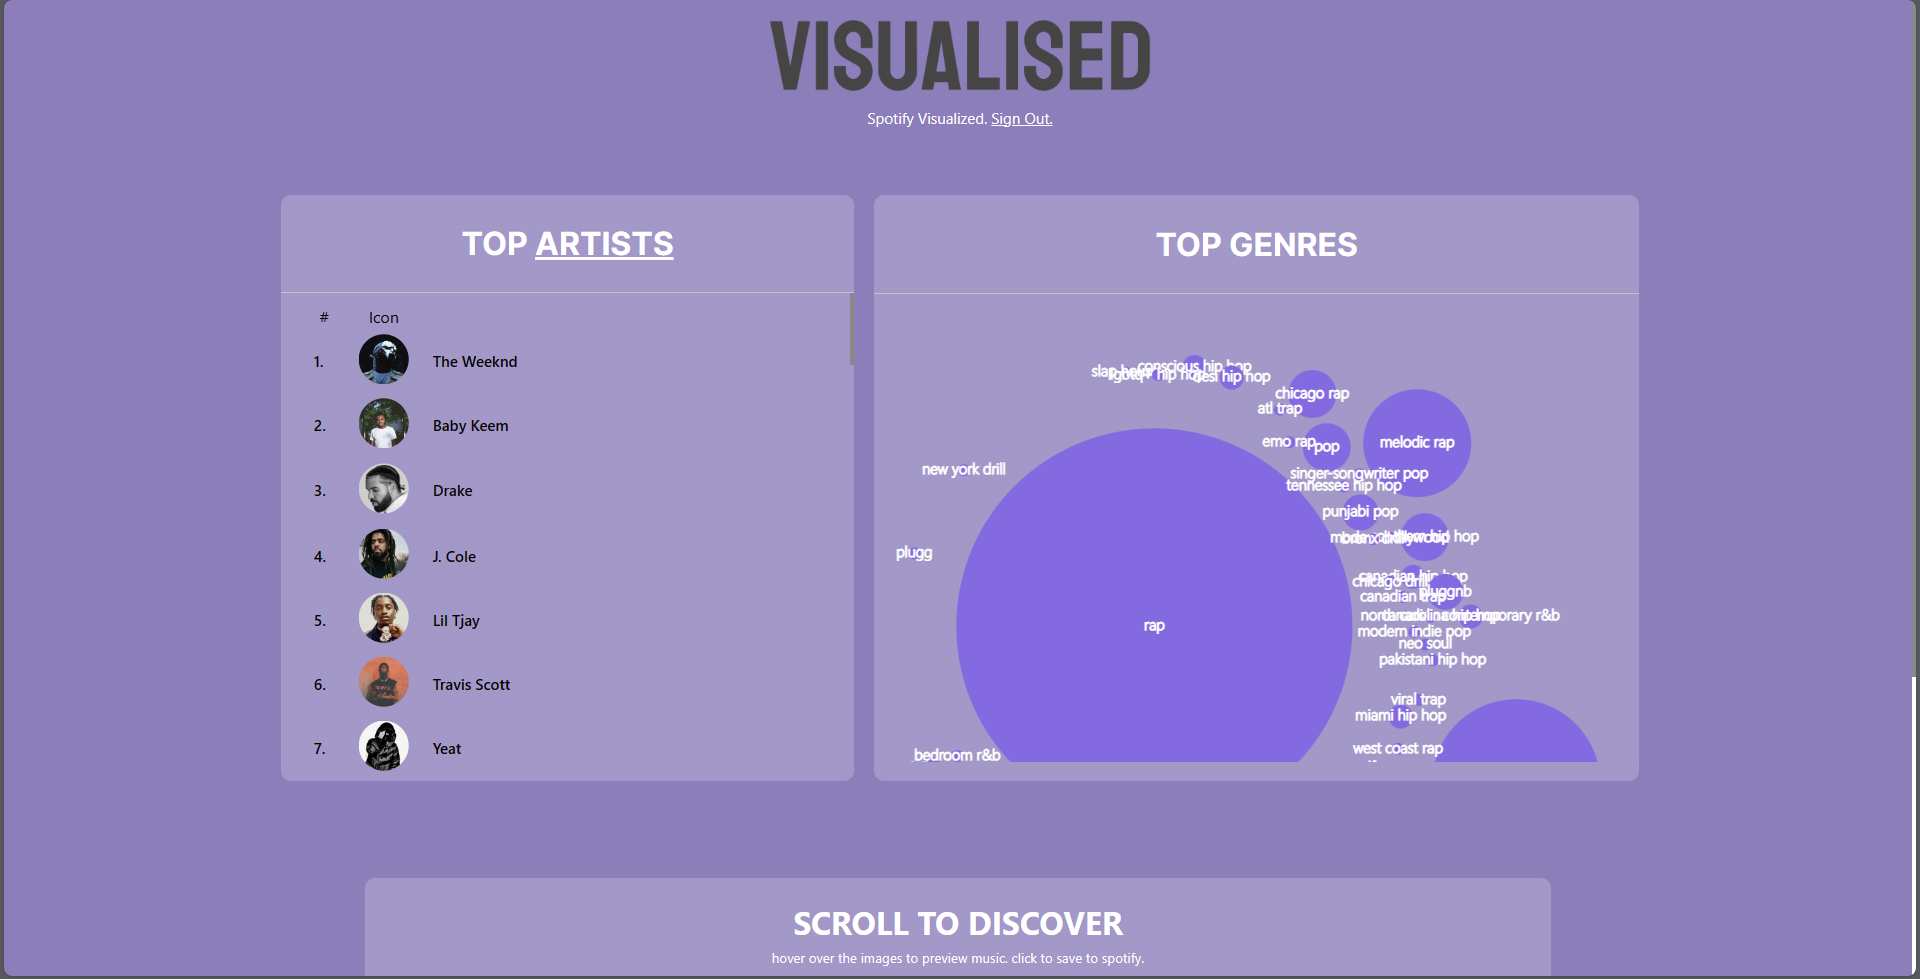
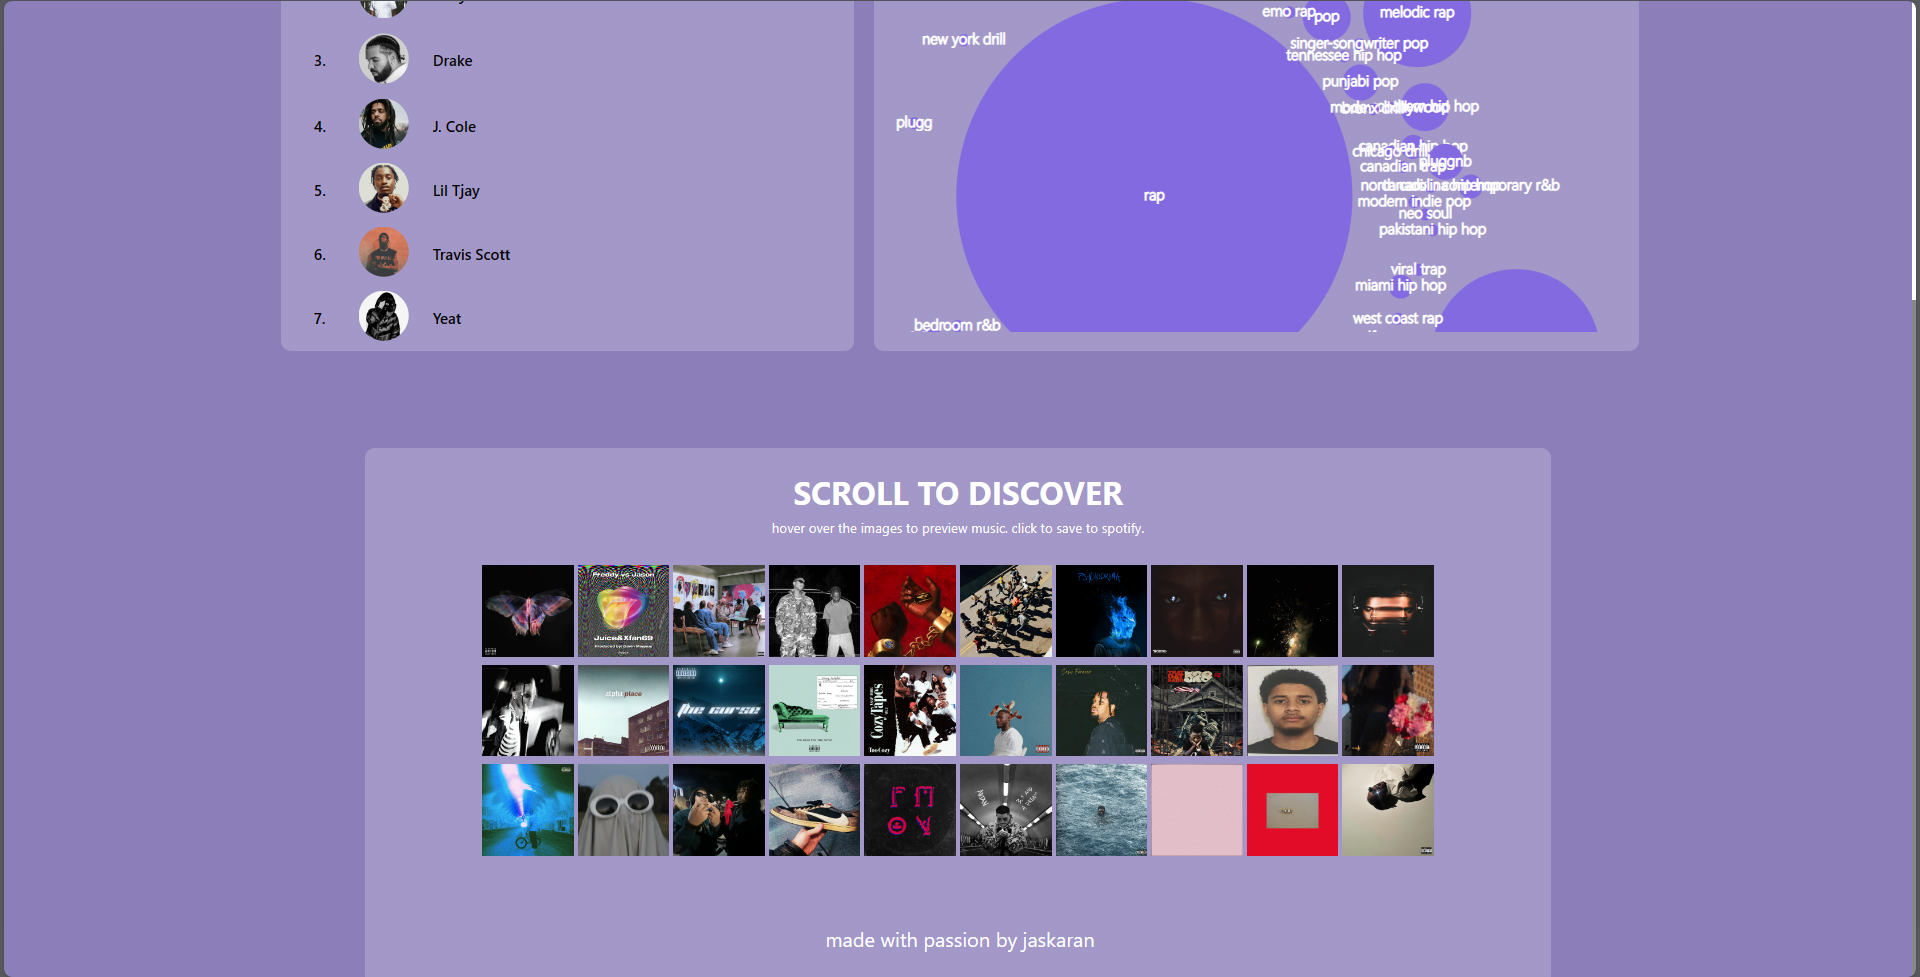
Visualised provides users with a easy way to view their Spotify data, specifically tracks, artists, and genres. It also provides an intuitive way to pick new music you like. You can listen to snippets of songs curated just for you and add it to your Spotify app with just one click.
https://visualised.tech/ (due to Spotify limitations, only invited members will be able to use it)
How we built it
I utilized the Spotify API alongside React and D3.js to build Visualised. The Spotify API was used to retrieve data and push changes to your Spotify app. React was used to create the user interface and provide a front-end for the user. D3.js was used to create a map of your most played genres.
Challenges we ran into
This was my first real project using React, I have used other frameworks but it wasn't very intensive. Learning all the ins and outs of React was very difficult and often resulted in hours of troubleshooting. Also, I am a solo hacker so time was a very big challenge as well, I had to rush a lot and stayed up for a long time too.
Accomplishments that we're proud of
I am very proud of the entire project, especially how much I learned. I used a lot of libraries that I have never used before, specially React. It was fun and rewarding finishing the project and learning the new library.
What we learned
I learned how to use React to create front-end user interfaces and I learned how to use D3.js to manage collision and create simulated charts.
What's next for Visualised
There is a lot of options for expandability on this project, however, I think creating a way to share the visualizations among users would be very cool. Also, adding more data that can be viewed


Log in or sign up for Devpost to join the conversation.