-
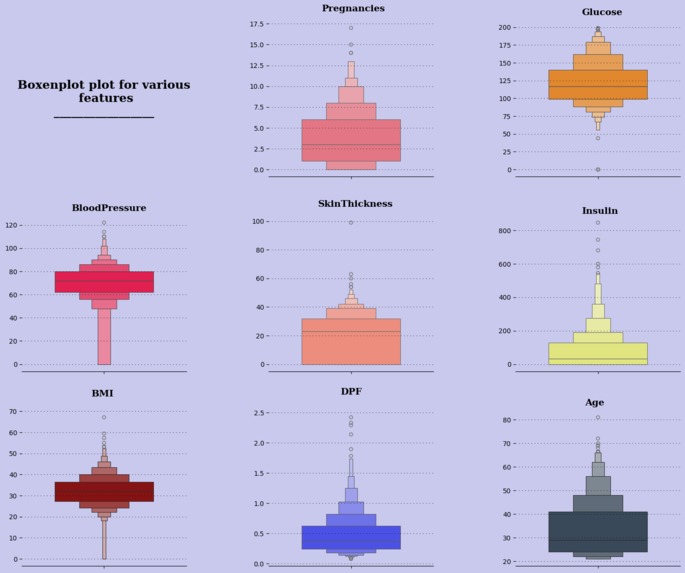
Boxen plot for features
-
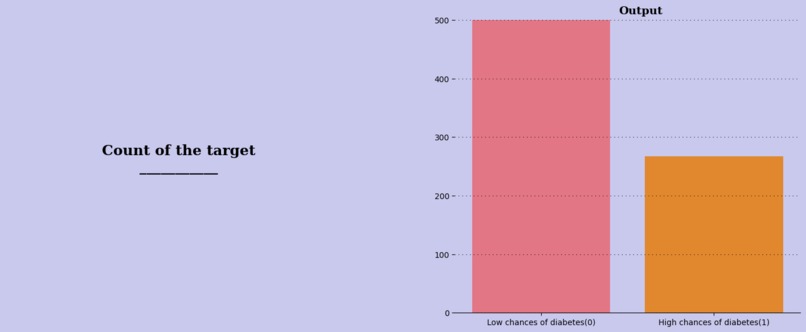
Count of the target
-
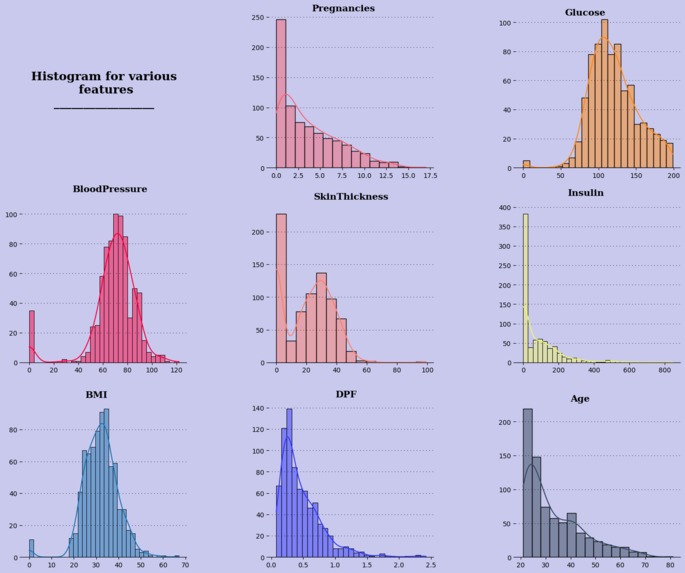
Histogram of each feature of the dataset
-
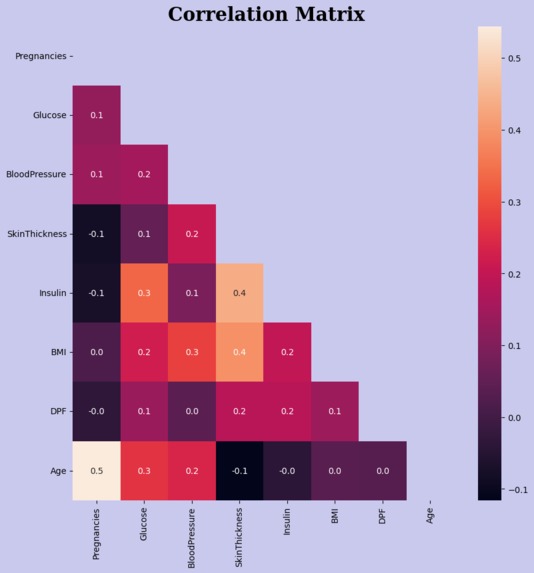
Correlation Matrix
-
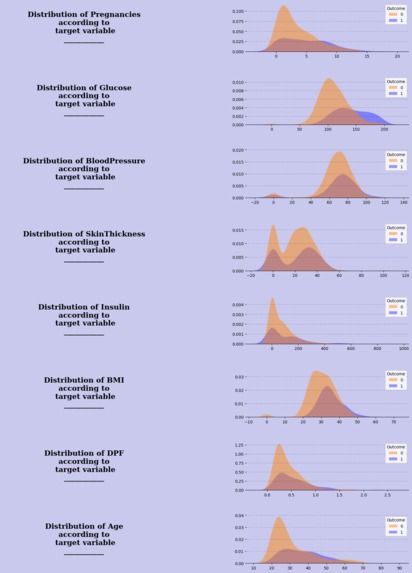
Distribution plot of the features of dataset according to target variable
-
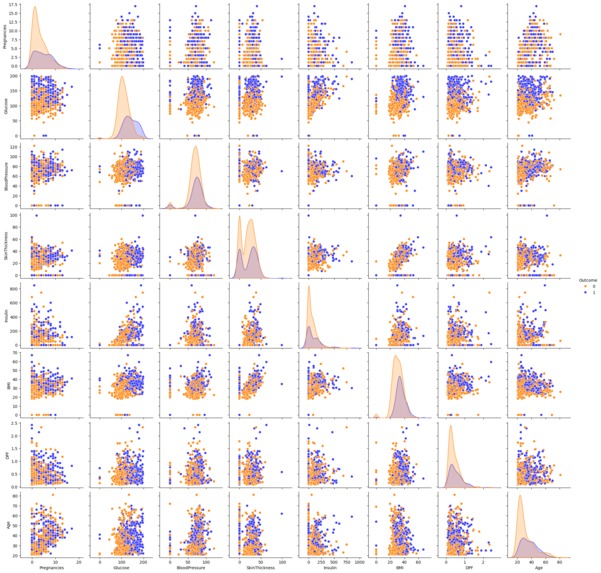
Pair plot visuals of the features of dataset
-

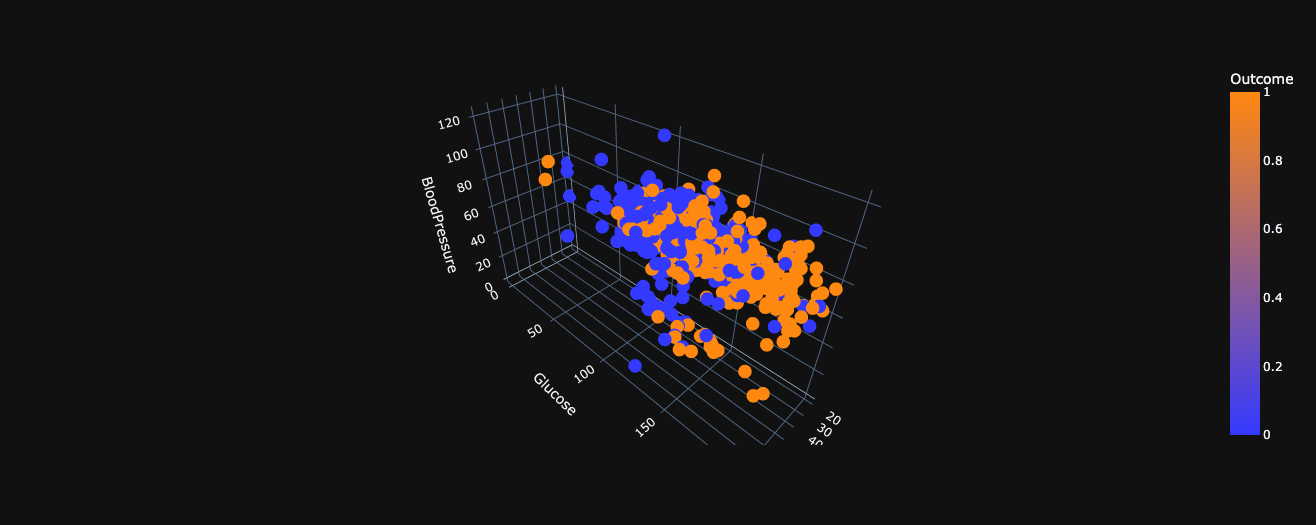
3D Scatter plot of BloodPressure vs Glucose vs Age wrt Outcome
-

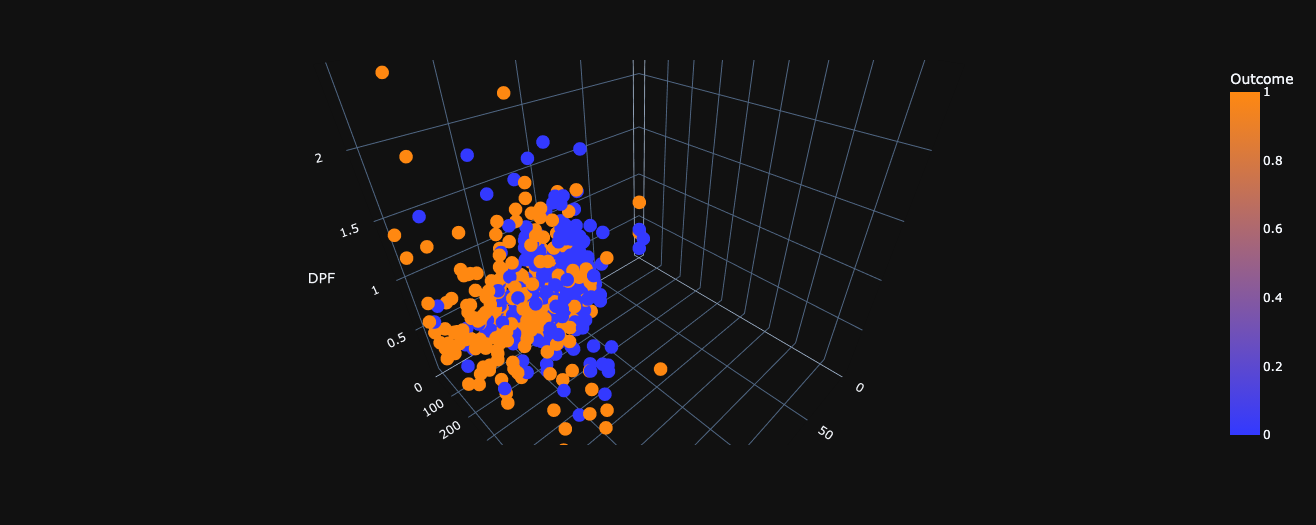
3D Scatter plot of Glucose vs Insulin vs DPF wrt Outcome
-
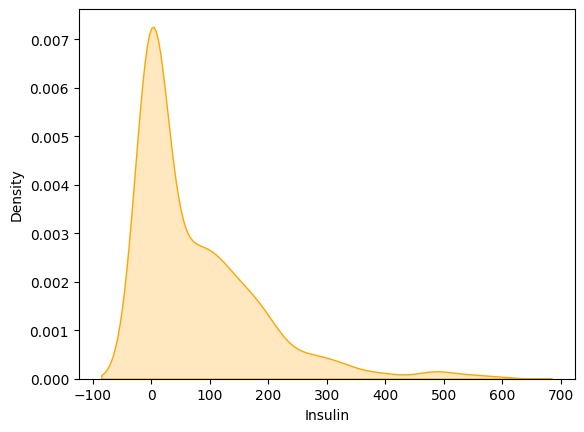
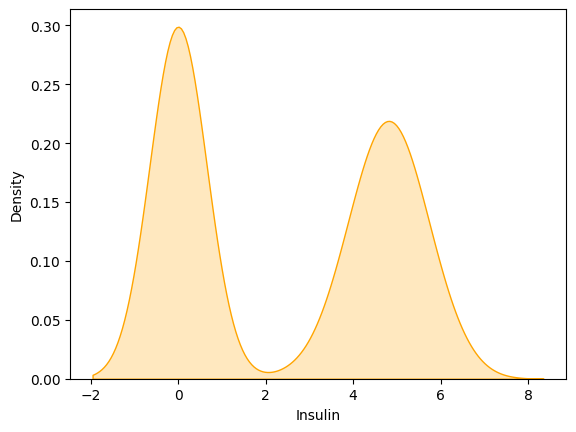
kernel density estimate (KDE) plot for insulin
-
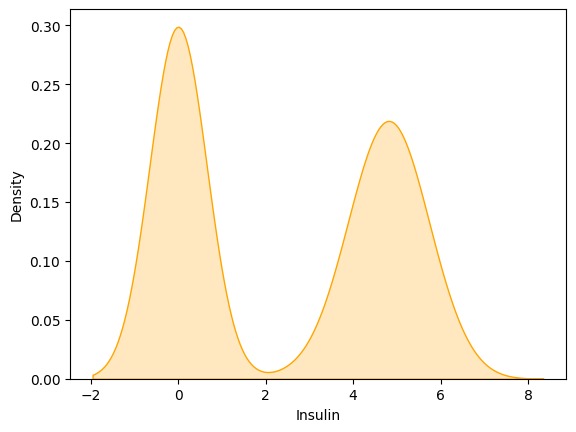
kernel density estimate (KDE) plot for insulin after Removing the skewness


Inspiration
The inspiration behind my project stems from the pressing need to address the diabetes epidemic, particularly within the Pima Indian community. Witnessing the disproportionate burden of this disease, we were driven to harness the power of data analytics to delve deeper into its underlying factors. By exploring the Pima Indians Diabetes Database, we aim to shed light on crucial insights that can inform targeted interventions, improve healthcare outcomes, and ultimately alleviate the burden of diabetes within this population. Our motivation lies in leveraging technology to make a tangible difference in public health, empowering both individuals and healthcare professionals with knowledge that can drive positive change.
What it does
Our project conducts comprehensive analysis on the Pima Indians Diabetes Database, employing advanced visualization and exploratory data analysis (EDA) techniques. It aims to uncover patterns, correlations, and risk factors associated with diabetes within the Pima Indian community. By processing and interpreting the dataset, our project generates actionable insights that can inform healthcare strategies, intervention programs, and personalized patient care plans. Through visual representations and statistical analysis, it facilitates a deeper understanding of diabetes prevalence, contributing factors, and potential avenues for prevention and management. Ultimately, it serves as a valuable resource for healthcare professionals, policymakers, and researchers in their efforts to combat diabetes and improve public health outcomes.
How we built it
To build our project, we began by acquiring the Pima Indians Diabetes Database, a renowned dataset in diabetes research. Utilizing Python as our primary programming language, we leveraged popular data science libraries such as Pandas, NumPy, and Matplotlib for data manipulation, analysis, and visualization.
The project followed a systematic approach, starting with data preprocessing to handle missing values, normalize features, and ensure data integrity. Next, we conducted exploratory data analysis (EDA) to gain insights into the dataset's characteristics, including distributions, correlations, and outliers.
For visualization, we employed Matplotlib and Seaborn to create informative charts, graphs, and heatmaps, enhancing our understanding of diabetes trends and risk factors within the Pima Indian population.
Additionally, machine learning models, such as logistic regression or decision trees, were implemented to predict diabetes occurrence based on relevant features identified during EDA.
Throughout the process, we maintained a rigorous methodology, ensuring reproducibility and reliability of our findings. Collaboration and iteration were key, as team members continuously refined code, experimented with different approaches, and validated results to ensure accuracy and robustness.
The project's success relied on a combination of technical expertise, domain knowledge in healthcare and diabetes, and a collaborative team effort dedicated to extracting meaningful insights from the data.
Challenges we ran into
As I delved into the project, several challenges emerged, testing both my skills and determination. Foremost was navigating the complexities of the Pima Indians Diabetes Database itself. Dealing with missing data, inconsistent formatting, and outliers required careful preprocessing and cleaning to ensure the integrity of our analysis.
Understanding the nuances of diabetes within the Pima Indian population posed another significant hurdle. Researching and contextualizing the cultural, genetic, and socio-economic factors influencing diabetes prevalence demanded a deep dive into relevant literature and expert consultations.
Implementing effective visualization techniques to communicate our findings proved to be a challenge as well. Balancing clarity and complexity in conveying intricate data relationships required experimentation with different visualization tools and approaches.
Moreover, grappling with the interdisciplinary nature of the project presented its own set of challenges. Bridging the gap between data science, healthcare, and public health required collaboration with experts from diverse fields, necessitating effective communication and mutual understanding.
Lastly, time management and prioritization were ongoing challenges throughout the project. Balancing the demands of data exploration, model development, and documentation while meeting deadlines required careful planning and adaptability in the face of unforeseen obstacles.
Despite these challenges, each hurdle served as a learning opportunity, fueling my growth as a data scientist and deepening my commitment to tackling complex healthcare issues through data-driven insights.
Accomplishments that we're proud of
Despite the challenges I faced, there are undoubtedly accomplishments to be proud of. Take a moment to reflect on the progress I've made and the milestones I've achieved:
Data Preprocessing Mastery: I tackled the complexities of the Pima Indians Diabetes Database with skill and precision, successfully cleaning and preprocessing the data to ensure its integrity.
In-depth Understanding of Diabetes: Through diligent research and analysis, you gained a profound understanding of diabetes within the Pima Indian community, delving into cultural, genetic, and socio-economic factors that influence prevalence.
Effective Visualization Techniques: Despite the challenges, you mastered the art of visual storytelling, employing various visualization tools and approaches to communicate complex data relationships with clarity and insight.
Interdisciplinary Collaboration: My ability to collaborate with experts from diverse fields demonstrates my adaptability and communication skills, bridging the gap between data science, healthcare, and public health.
Resilience and Perseverance: Despite setbacks, I persisted, demonstrating resilience and determination in the face of adversity. my commitment to overcoming challenges speaks volumes about your character and dedication.
What we learned
Through the challenges you encountered, I've undoubtedly gained valuable insights and skills:
Data Wrangling Proficiency: I honed my ability to handle real-world data challenges, mastering techniques for data cleaning, preprocessing, and manipulation to ensure data integrity.
Domain Knowledge Expansion: My deep dive into the intricacies of diabetes within the Pima Indian community expanded my understanding of healthcare disparities, cultural influences, and socio-economic determinants of health.
Advanced Analytics Techniques: I acquired expertise in advanced analytics methods, including exploratory data analysis (EDA), statistical analysis, and machine learning, enhancing your toolkit for extracting meaningful insights from complex datasets.
Effective Communication Skills: Through visualization and collaboration, I refined my ability to communicate complex findings and ideas to diverse audiences, bridging the gap between technical and non-technical stakeholders.
Resilience and Adaptability: The challenges I faced tested your resilience and adaptability, teaching you the importance of perseverance and flexibility in navigating complex projects and dynamic environments.
What's next for Visualisation and EDA On Pima Indians Diabetes Database
Model Development and Validation: Build predictive models to forecast diabetes occurrence within the Pima Indian population based on insights gained from visualization and EDA. Validate these models rigorously to ensure their accuracy and reliability.
Feature Engineering and Selection: Explore advanced feature engineering techniques to enhance model performance and interpretability. Select the most relevant features identified during EDA to optimize model efficiency.
Integration with Healthcare Systems: Collaborate with healthcare institutions to integrate your findings into clinical practice. Develop decision support tools or risk assessment algorithms to assist healthcare providers in diabetes prevention and management strategies.
Built With
- google-colab
- jupyter-notebook
- python

Log in or sign up for Devpost to join the conversation.