Inspiration
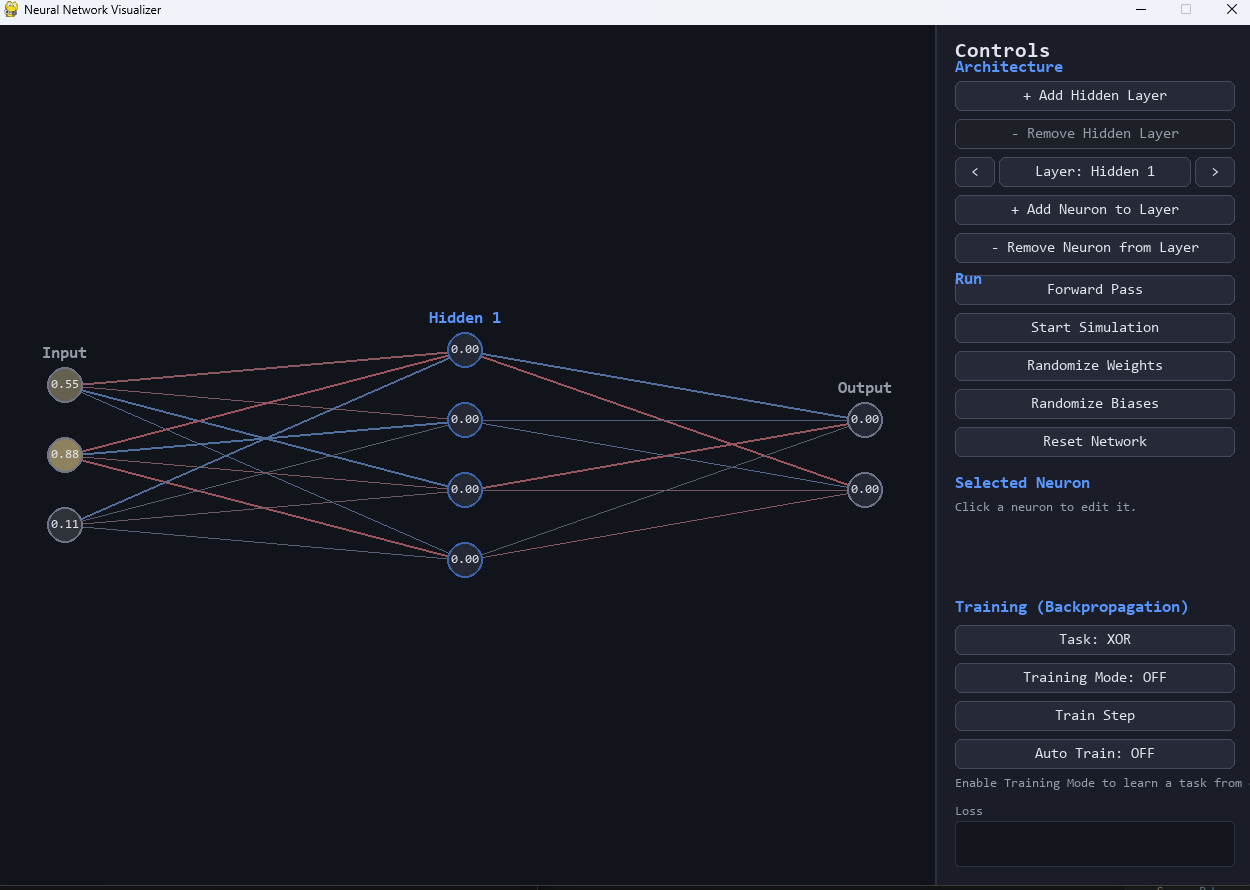
Neural networks are usually explained with static diagrams a few circles, some arrows, maybe an equation. That gap between "I can recite backpropagation" and "I've actually watched a network learn" is what this project was built to close. It started with 3Blue1Brown's neural network series after watching how a neuron actually computes its output and how backprop assigns blame layer by layer, I wanted something I could poke at myself: pull a hidden layer down to a single neuron and watch XOR become unsolvable in real time, or bump the learning rate too high and watch the loss curve spike.
What it does
Neural Network Visualizer is a standalone Pygame app that lets you build, edit, and train a neural network interactively:
Dynamically add or remove hidden layers and neurons, with the network re-laying itself out and preserving existing weights wherever possible Click any neuron to hand-edit its activation or bias with sliders and watch the effect ripple outward Run a Forward Pass and watch the computation animate as pulses traveling layer by layer, left to right Flip on Training Mode and watch the network actually learn XOR, AND, or OR from scratch via real backpropagation live loss graph, live predictions, adjustable learning rate Every connection is color- and thickness-coded by its weight: blue = positive (amplifies the signal), red = negative (inverts it), thickness = magnitude so the network's internal state is always visible, not hidden behind a black box. Hover any line for its exact value. How I built it
I started by watching the 3Blue1Brown deep-learning series and building a throwaway demo just to get a feel for how a single neuron turns inputs, weights, and a bias into an activation. Once that clicked, I built the real project in two passes:
Visualization pass: the Neuron / Connection / Layer / NeuralNetwork data model and the Pygame UI (buttons, sliders, hover/select states, pulse animation), built around a network that only ever ran inference. Weights and biases were random or user-set, so it could display a forward pass but had no way to improve. Learning pass: added real backpropagation on top of the same model: per-neuron delta values, a backpropagate() / apply_gradients() pair implementing the chain rule and gradient descent, and the UI to drive it (Training Mode, Train Step, Auto Train, a learning-rate slider, a live loss graph, live predictions).
The forward pass, for every neuron in layer l+1:
$$z = bias + \sum_i (activation_i \times weight_i)$$ $$activation = \sigma(z) = \frac{1}{1 + e^{-z}}$$ python def forward_pass(self): for i in range(len(self.layers) - 1): src_layer, dst_layer = self.layers[i], self.layers[i + 1] sums = [n.bias for n in dst_layer.neurons] for c in self.connections[i]: sums[dst_layer.neurons.index(c.dst)] += c.src.activation * c.weight for n, s in zip(dst_layer.neurons, sums): n.activation = sigmoid(s)
I later split the single file into modules (config, utils, model, widgets, app) so the math and the UI aren't tangled together.
Challenges I ran into
Getting backpropagation actually correct, not just visually plausible, took care: the sigmoid derivative a(1-a), propagating error deltas backward through an arbitrary number of hidden layers, and making sure the architecture can change mid-training without crashing or leaving a dangling reference to a deleted neuron. I tested this headlessly (SDL_VIDEODRIVER=dummy), scripting every button, slider, and edit, and separately verified training actually converges XOR loss dropping ~100x over a few thousand steps rather than just checking the code runs.
Accomplishments that I'm proud of
Watching a from-scratch, sub-500-line implementation reliably solve XOR the textbook example of a problem that requires a hidden layer and being able to prove that visually by shrinking the hidden layer to one neuron and watching it fail.
What I learned
How much of "making a neural network legible" comes down to timing and staging in the UI, not the math itself, the math is a few dozen lines, making it readable as it happens is the harder design problem.
What's next for Neural Network Visualizer
- More tasks (small 2D classification datasets, not just boolean logic)
- A decision-boundary view that shades the canvas by live prediction as training happens
- Alternative activations (ReLU, tanh) and optimizers (momentum, Adam) to compare convergence visually

Log in or sign up for Devpost to join the conversation.