Inspiration
Authorities need for a comprehensive idea of crowds flow and danger spots.
What it does
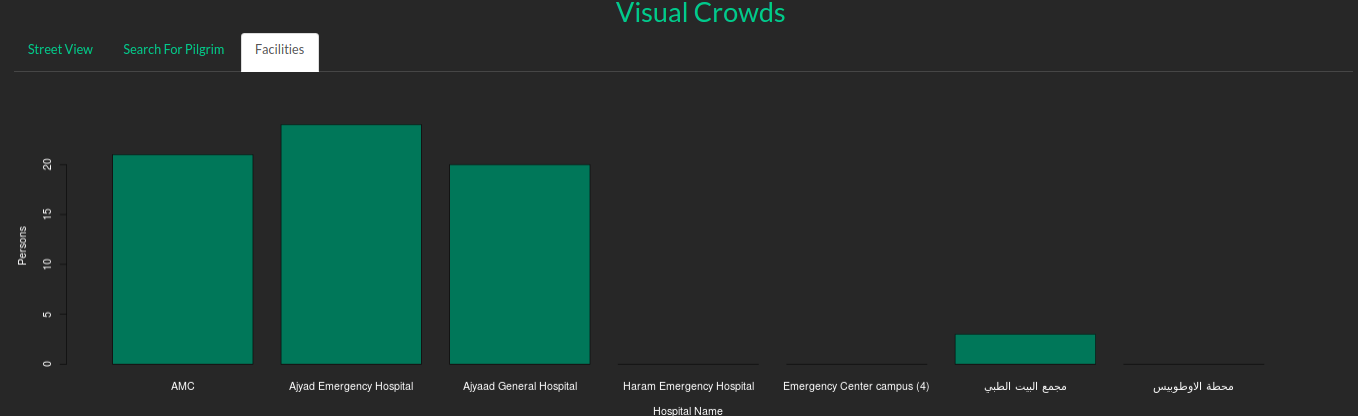
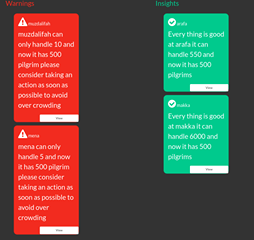
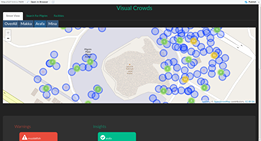
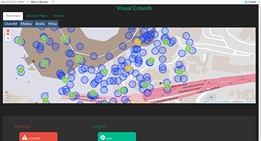
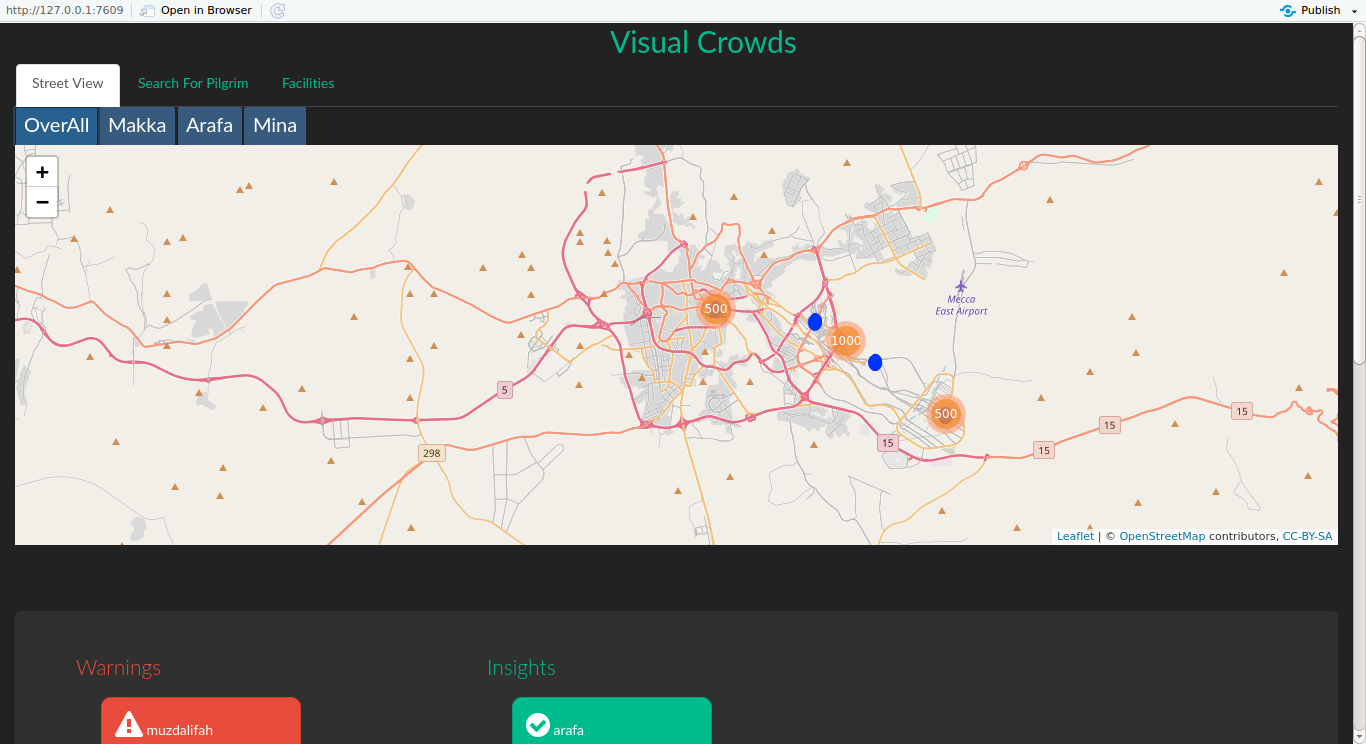
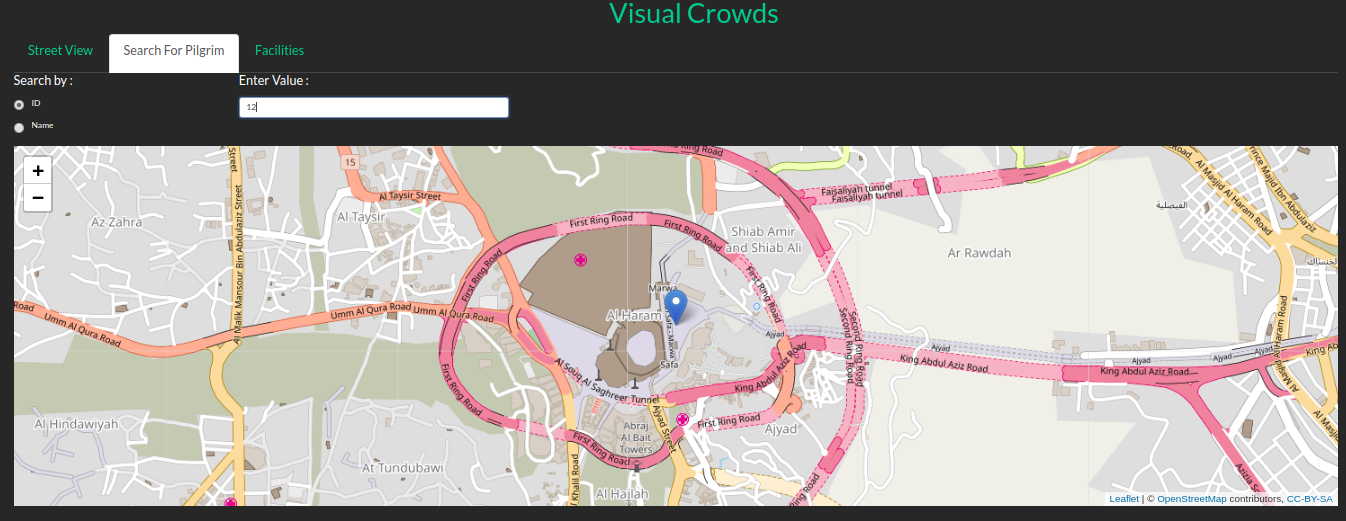
It gives authorities concerned with crowd and traffic management visual and statistical insights. It highlights places with jam spots and illustrates crowds flow in streets. It simply offers a powerful dashboard for monitoring all pilgrims during Hajj process. Through visual crowds, authorities can locate outliers and lost pilgrims.
How we built it
We have built a web application to avoid limitations when installing the app on any device. We are using (R, shiny and leaflet) for visualization and (Python, Pandas and Google Maps API) for gathering data and getting insights.
Challenges we ran into
We first tried using Plotly visualization library for R programming Language, but we couldn't manage to get help with the problems and limitations we faced with it. We then tried using p5.js but it couldn't offer the interface we were seeking.
We eventually decided to use leaflet library for visualization and Python for the backend processes and accessing googleMaps API.
Accomplishments that we're proud of
Building the app with both R and Python and using libraries we weren't previously familiar with.
What we learned
We deepened our knowledge in data science and data visualization in particular.
What's next for E24 Visual Crowds
We are aiming for Visual Crowds to be a completely dynamic, sleek and real-time service. Along getting access to real pilgrims locations.


Log in or sign up for Devpost to join the conversation.