-

Screenshot of dashboard
-
Screenshot of dashboard
Inspiration
Having access to data doesn't do much if we cannot use it in the right way.
What it does
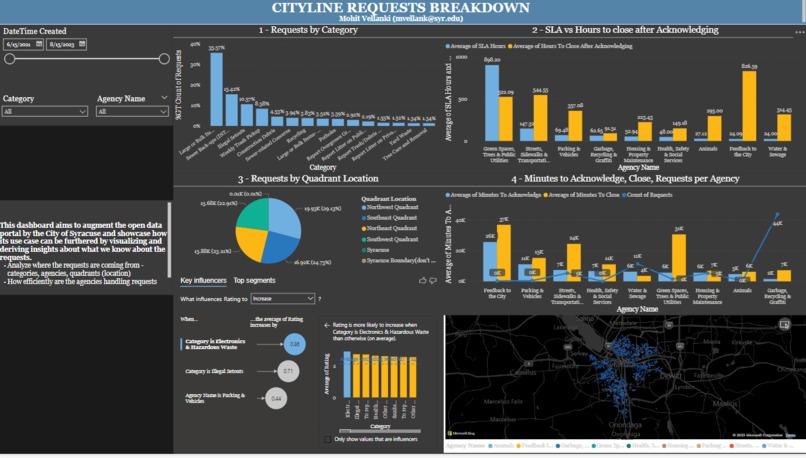
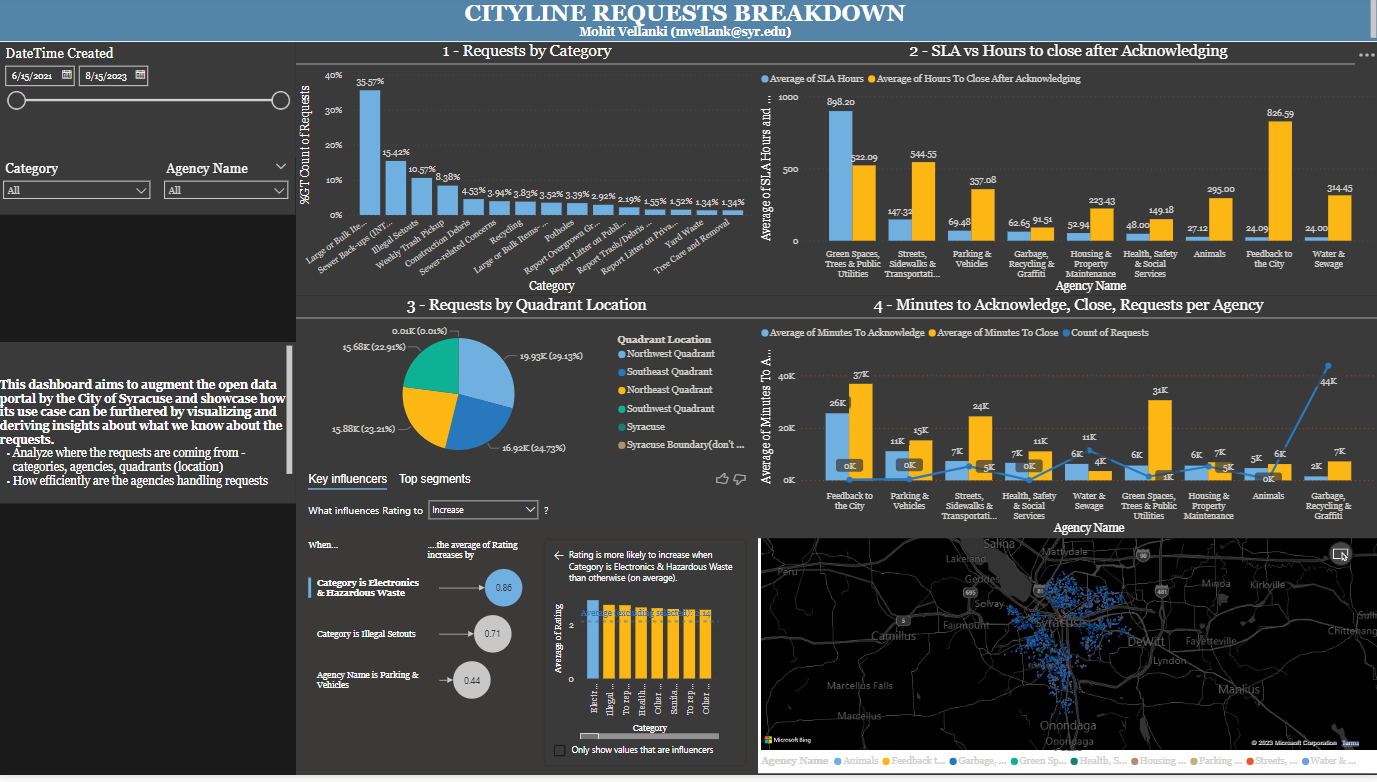
This dashboard aims to derive insights from data available on Syracuse Open data portal and Open data available about Syracuse city
How we built it
Dashboard was built in PowerBi
Challenges we ran into
Accomplishments that we're proud of
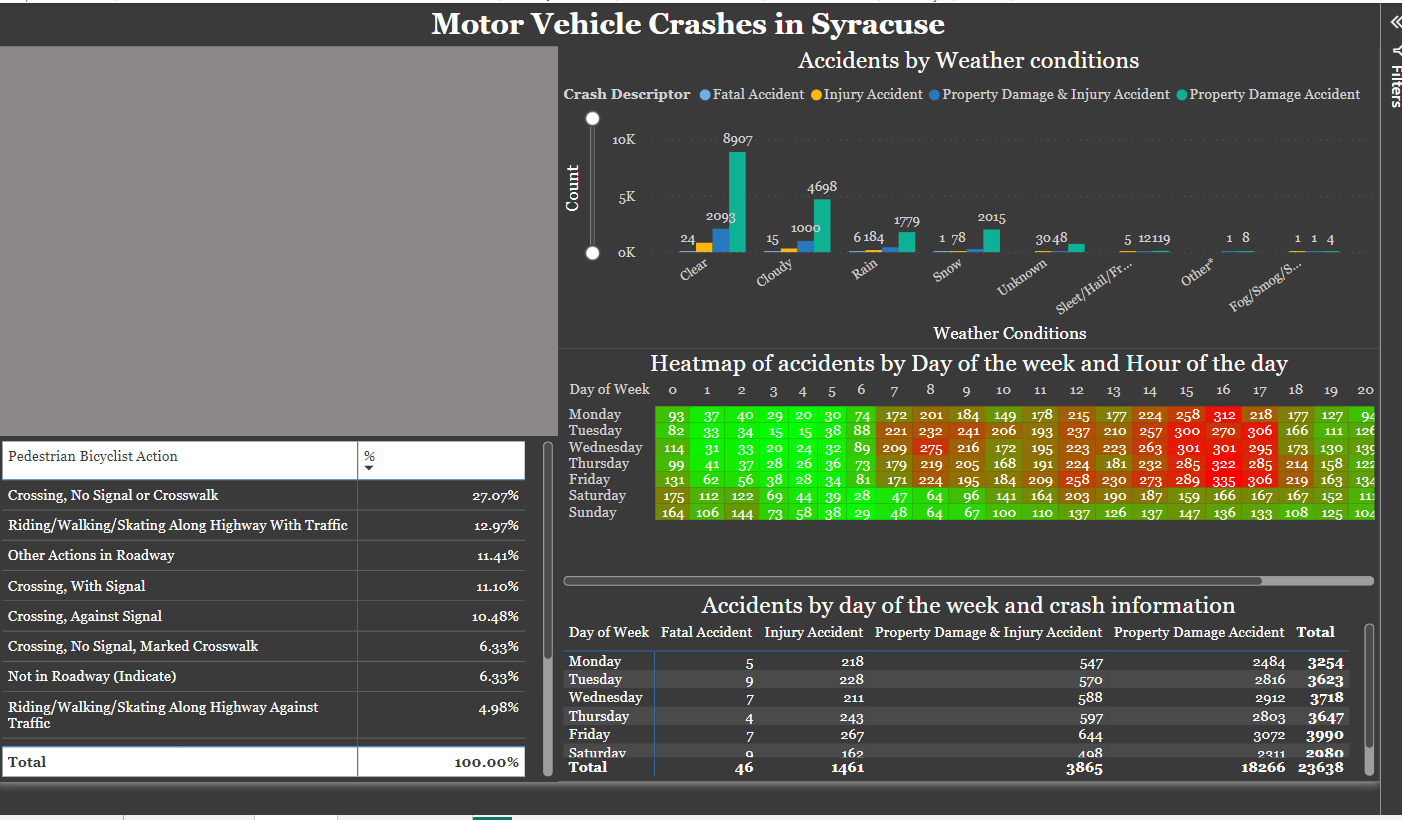
Realization that motor vehicle crashes are not as correlated to weather conditions as I thought. Improvements in technology and infrastructure perhaps?
What we learned
Improving a lot of issues like turnaround time for requests or reducing the number of crashes seems a bit simple after visualizing the data
What's next for Visual analysis of Syracuse
Connect it to live data and deploy it hoping city authorities of Syracuse can implement or change policies to improve safety and quality of living in Syracuse
Built With
- powerbi

Log in or sign up for Devpost to join the conversation.