-
-
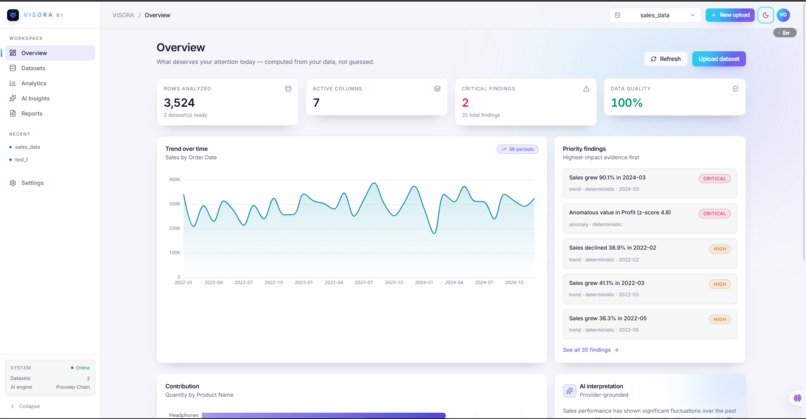
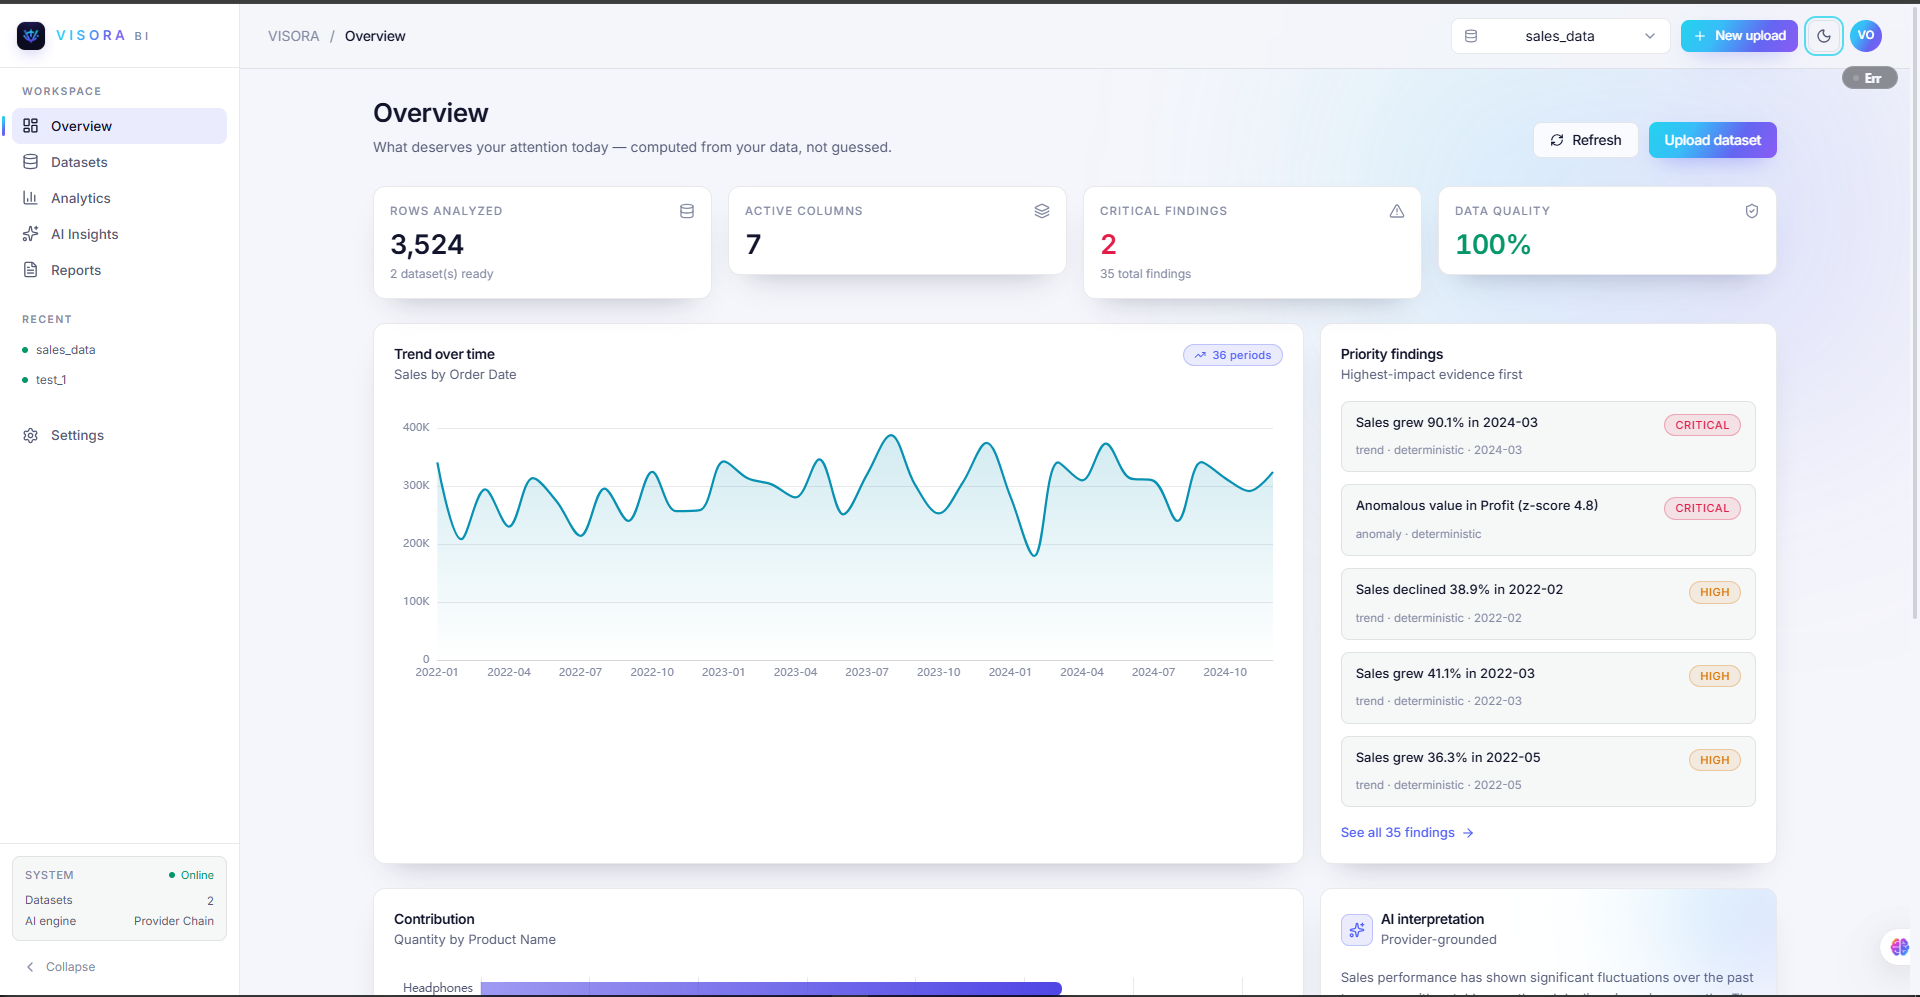
Overview page in light theme
-
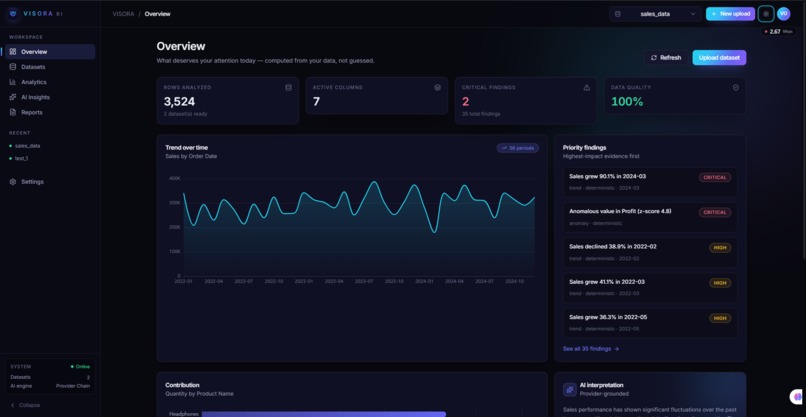
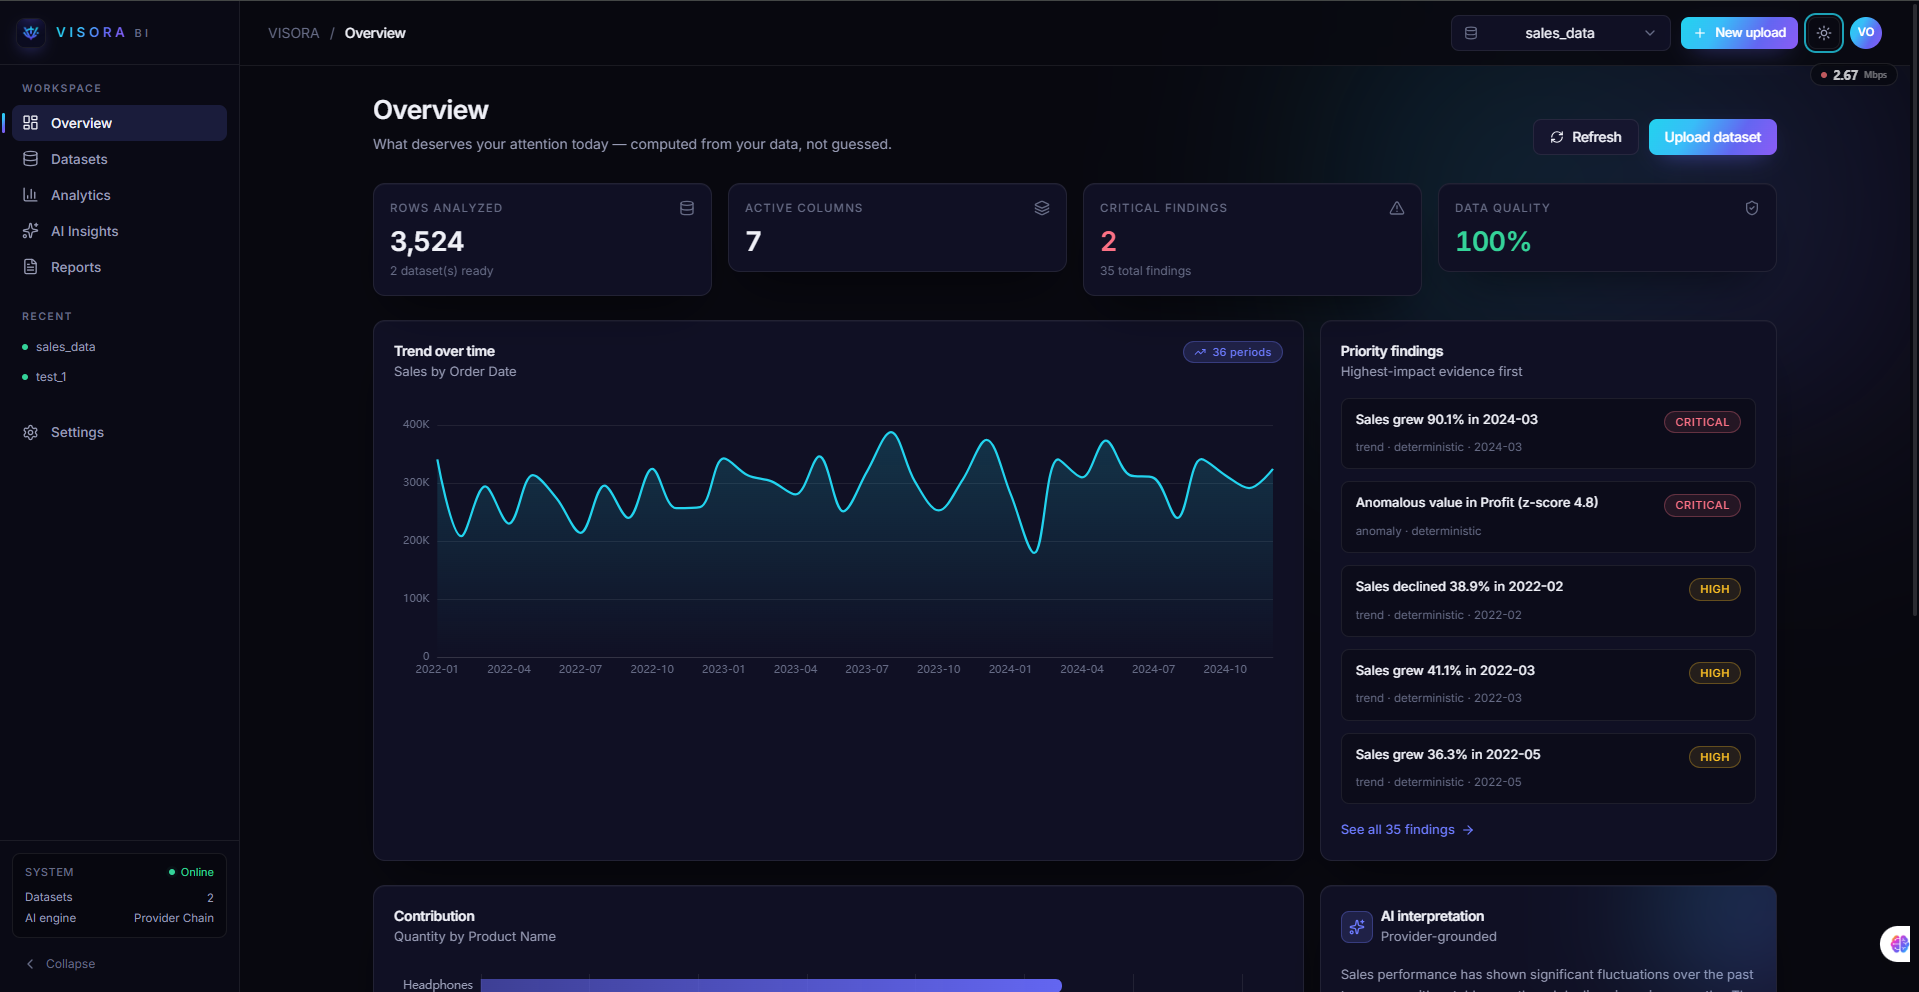
Overview page in dark theme
What is VISORA BI?
VISORA BI is a local-first business intelligence platform that turns messy business datasets into evidence-backed insights. Instead of making users build dashboards and interpret every chart manually, VISORA guides the workflow from data upload to analysis, anomaly detection, explanation, and prioritization.
Core flow: Upload → Clean → Analyze → Visualize → Detect → Explain → Prioritize
The Problem
Small teams often have business data but lack the time or expertise to turn it into reliable decisions. Traditional BI tools can require significant manual dashboard building, while AI-only analysis can produce explanations without making the underlying evidence clear.
VISORA focuses on the gap between raw data and understandable business decisions.
What We Built
- Multi-format ingestion: CSV, XLSX, and XLSM datasets.
- Data quality analysis: structural checks, missing values, types, and dataset health.
- Deterministic analytics: metrics, trends, contribution analysis, and other calculations are generated by the backend rather than by the AI model.
- Anomaly detection: unusual business patterns are detected and connected to supporting evidence.
- Evidence-backed explanations: insights are tied to the numbers and calculations that produced them.
- Prioritization: findings are organized so users can focus on the most important issues first.
- Optional AI interpretation: AI providers can turn verified analytical results into natural-language explanations, with a deterministic local fallback.
- Visual reporting: charts and reports help users move from exploration to communication.
How It Works
The backend is the source of truth. A dataset is ingested and analyzed first. VISORA then produces structured analytical results, detects relevant patterns, and builds evidence around those findings. Only after that can the optional AI layer interpret the verified results.
This separation is intentional: numbers first, interpretation second.
Technical Execution
VISORA uses a Python analytics/backend layer exposed through a FastAPI API, with a React 19 + TypeScript frontend.
The frontend handles presentation and user interaction. The backend owns ingestion, analytics, detection, evidence generation, prioritization, and report logic. This keeps business calculations out of the UI and gives the application a consistent analytical source of truth.
The AI layer supports multiple provider styles, including OpenAI-compatible, Anthropic, Gemini, and Nemotron-compatible configurations, while preserving a local deterministic fallback when external AI is unavailable.
AI Usage
AI was used as a development and interpretation aid rather than as the source of truth for business calculations. The analytical pipeline remains deterministic, while AI is optional for turning verified findings into clearer natural-language explanations.
During development, AI assistance was also used for brainstorming, debugging, implementation guidance, and reviewing technical decisions. The project was continuously validated through automated backend and frontend checks.
Challenges & Learning
A major challenge was designing the system so that AI could add value without making the analytical results a black box. This led to a stronger separation between deterministic computation, evidence generation, and AI interpretation.
The project also required learning how to structure a real end-to-end BI product: dataset ingestion, analytical services, API boundaries, frontend state and visualization, anomaly detection, testing, and multi-provider AI integration.
Testing
The project includes automated validation for the analytical services, AI services, backend integration, checkpoint functionality, and frontend verification/E2E flows.
Who Is It For?
VISORA is aimed at small teams, analysts, developers, and business users who want to move from raw business datasets to understandable, evidence-backed insights without manually building every analytical step.
Project
Public source code: https://github.com/bilal-dev-0x/Visora-BI
Demo
A short 3–5 minute demo will show the complete workflow, how the architecture works, the technologies used, the challenges overcome, and what was learned while building VISORA.
VISORA BI: turning messy business data into explainable, prioritized insight.
Built With
- ai
- fastapi
- numpy
- pandas
- python
- react-19
- typescript