-
AI Visual Analyzer
-
Landing Page
Inspiration
In manufacturing, infrastructure, and even marketing, the cost of "unseen" change can be enormous. A micro-fracture in an engine part, a tiny bit of corrosion on a bridge, or a brand's logo being slightly distorted on a digital ad—these small deviations are incredibly difficult for humans to track consistently and objectively.
Our inspiration came from this gap. We realized that while most AI focuses on identifying objects, a more powerful industrial application is quantifying change over time. We wanted to build a single, general-purpose engine that could answer a simple, critical question for any industry: "What's different here, and does it matter?"
What it does
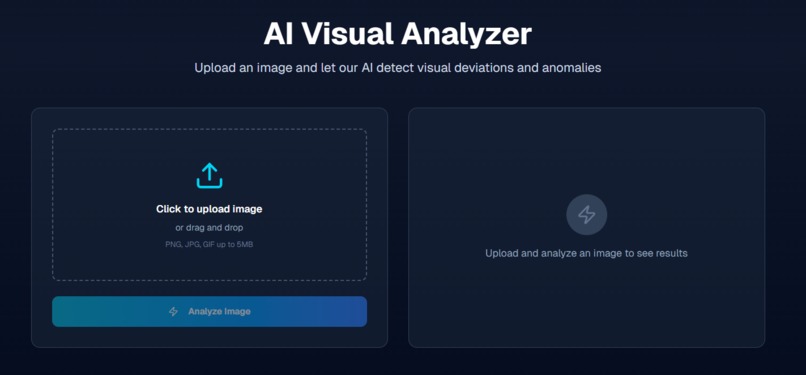
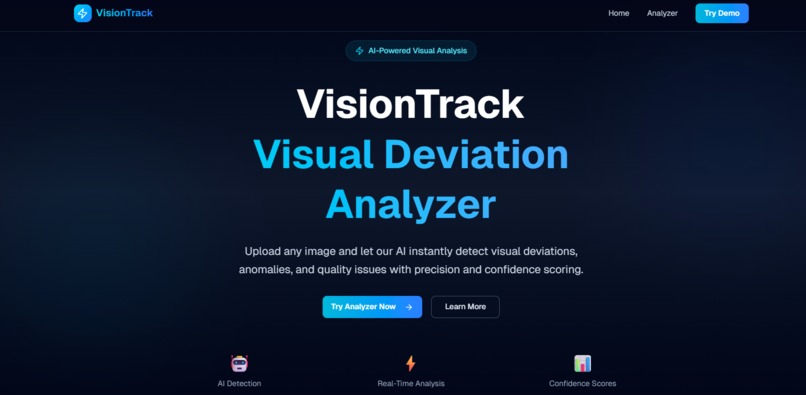
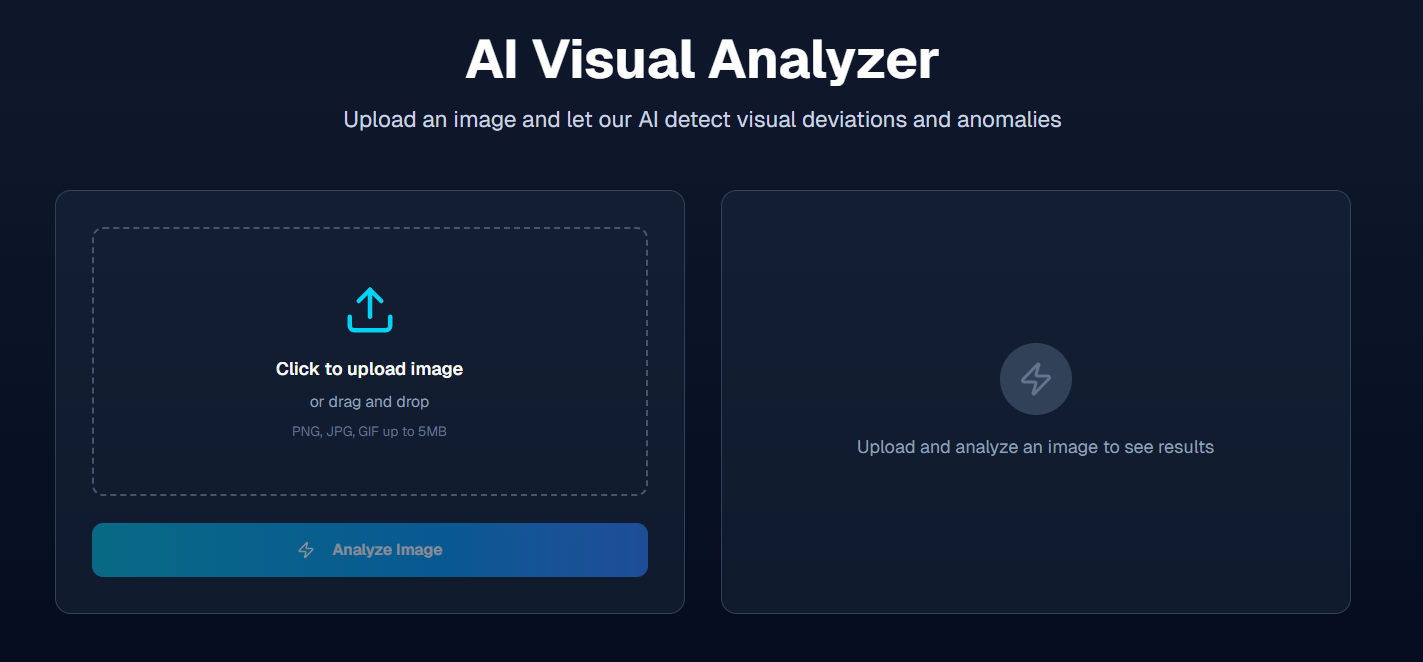
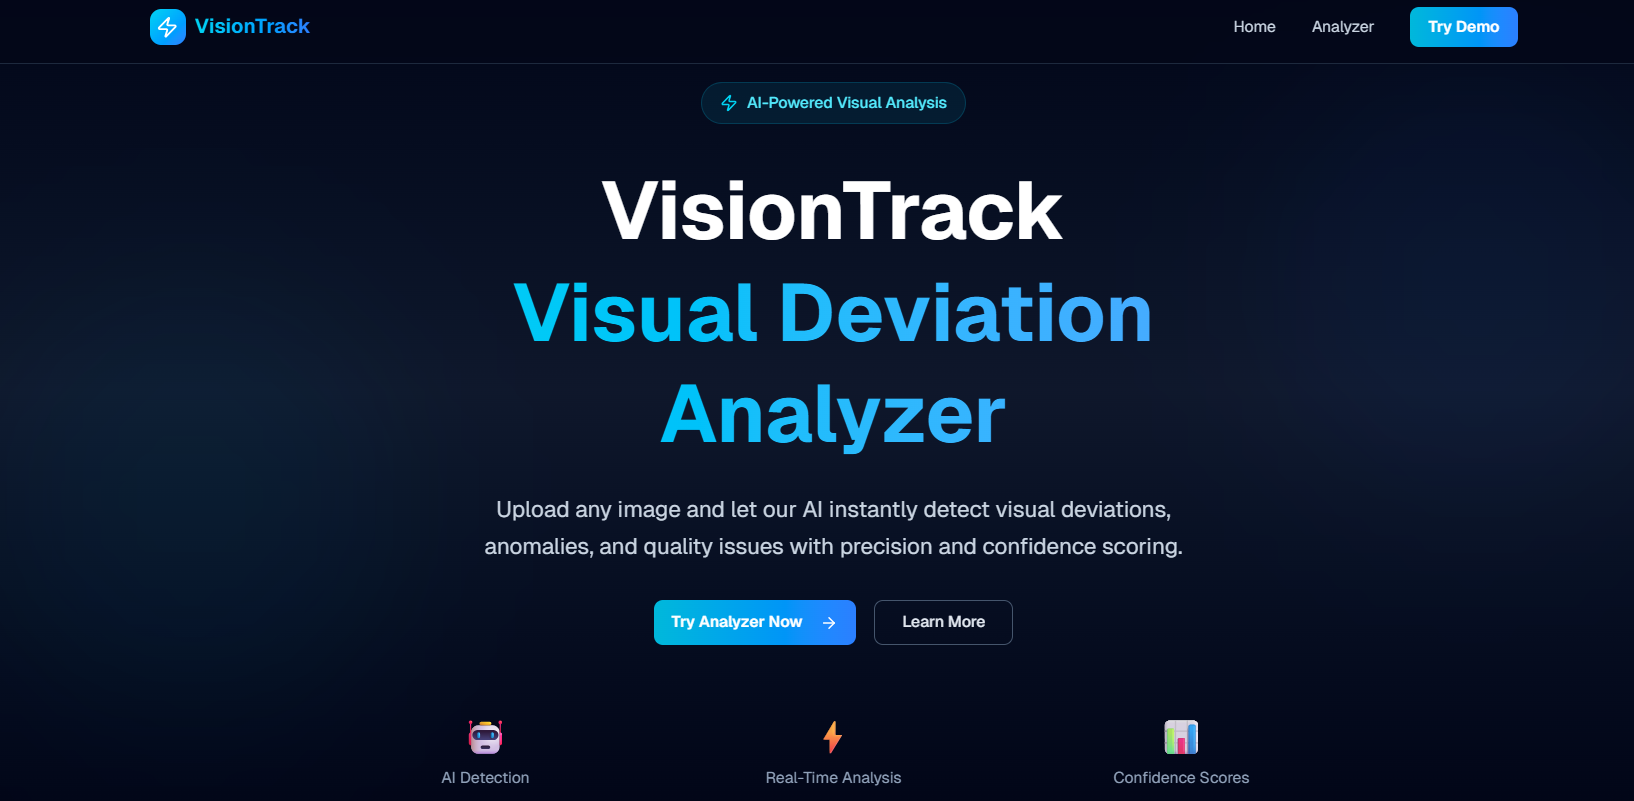
VisionTrack is an AI-powered visual difference engine designed to automatically detect, classify, and track changes across time-series images.
Users (or automated systems like drones) upload two or more images of the same object or scene taken at different times. The system then:
- Aligns the images to correct for slight changes in camera angle or perspective.
- Compares the images using a deep learning model to find both pixel-level (e.g., color fade) and semantic-level (e.g., missing part) differences.
- Generates a visual heatmap overlay that pinpoints the exact location and intensity of the change.
- Outputs a textual report that classifies the change (e.g., "Crack Detected," "Corrosion Started," "Logo Misaligned") and its severity, providing actionable insights for maintenance, quality control, or compliance audits.
How we built it
As this is an idea-phase project, this describes our proposed architecture and technology stack.
- Processing Pipeline:
- Input & Preprocessing: Images are uploaded via a web dashboard or API. We use OpenCV for image registration and alignment to ensure an accurate comparison, correcting for noise and perspective shifts.
- AI Core Engine: We propose using a Siamese Network with a CNN (like ResNet) backbone. Instead of just comparing pixels (which is fooled by shadows), a Siamese Network learns to understand the content of the images. It compares the deep feature maps from both images to identify meaningful, semantic changes.
- Output & Classification: The difference map from the network is converted into a human-readable heatmap. A separate classification model analyzes the detected regions to label them (e.g., "crack," "rust").
- Proposed Technology Stack:
- AI Framework: PyTorch or TensorFlow
- Computer Vision: OpenCV
- Backend & API: Python (with FastAPI or Flask)
- Frontend Dashboard: React.js or Vue.js
- Cloud: AWS or Google Cloud (for S3/GCS storage and EC2/Compute Engine for model training)
- AR Extension: ARKit (iOS) and ARCore (Android)
Challenges we ran into
In conceptualizing this project, we identified several significant challenges we will need to overcome during development:
- Data Scarcity: The biggest hurdle is sourcing high-quality, labeled time-series datasets. It's difficult to find public datasets showing, for example, 12 months of photos of a bridge as it cracks. We plan to mitigate this by using synthetic data generation and advanced data augmentation.
- Real-World "Noise": Our model must be robust enough to ignore irrelevant changes. It must tell the difference between a harmless shadow, a rain droplet on the lens, or a change in daylight, versus a critical structural crack. This requires extensive, varied training.
- Scalability: Processing thousands of high-resolution images or video feeds for large-scale industrial clients will require a highly optimized, scalable cloud infrastructure to manage the computational load efficiently.
Accomplishments that we're proud of
As this is an idea submission, our accomplishments are in the design and conceptualization:
- Designing a General-Purpose Engine: We are proud of designing a horizontal solution. Instead of building just a "crack detector," we've conceptualized a flexible engine that can be trained for manufacturing, infrastructure, compliance, and even environmental monitoring.
- Integrating a Forward-Thinking Roadmap: We didn't just stop at the AI. We are proud of integrating AR (for on-site inspectors) and Cloud/Drone automation (for autonomous monitoring) directly into the core project vision.
- Focusing on a Robust AI Strategy: Our proudest technical decision was to move beyond simple pixel comparison. By planning to use Siamese Networks, we are tackling the problem at a semantic level, which is a far more robust and intelligent approach to change detection.
What we learned
During the ideation and research phase, we learned three critical lessons:
- "Noise" is the Real Enemy: We learned that "change detection" is easy, but "relevant change detection" is hard. The biggest challenge isn't finding differences; it's filtering out the 99% of differences (lighting, shadows, camera angle) that don't matter.
- Semantics > Pixels: This led us to our main insight: the system must understand what it's looking at. A simple pixel comparison can't tell a shadow from a rust spot. A semantic model (like a Siamese Network) can, making it the only viable approach for a real-world tool.
- Data Must Be Actionable: A report that says "something is different" is useless. We learned the system's output must be an actionable insight. This is what inspired the classification (e.g., "crack") and the AR overlay ("the crack is right here").
What's next for VisionTrack – AI Visual Change Analyzer
Our roadmap is planned in distinct phases to build from a core product to a predictive powerhouse.
- Phase 1: Build the Core Engine (MVP): Focus on developing the AI pipeline (alignment, Siamese network, heatmap generation) for a single, high-impact use case, such as manufacturing quality assurance or concrete crack detection.
- Phase 2: Launch Cloud & AR Extensions: Integrate the engine with cloud storage (like AWS S3) to automatically process images from drones and fixed cameras. Simultaneously, build the AR mobile app (for iOS and Android) that allows inspectors to overlay damage heatmaps on the real-world view.
- Phase 3: Introduce Predictive Analysis: The true power of time-series data is prediction. By analyzing the rate of change (e.g., how fast a crack is growing), we will develop a new model to predict potential failure points, moving from detection to prevention.
- Phase 4: Expand to New Verticals: With the core engine proven, we will expand by training it on new datasets for industries like environmental monitoring (tracking deforestation or coastline erosion) and even medical imaging (comparing MRIs or X-rays over time).
Built With
- amazon-web-services
- arcore
- arkit
- convolutional-neural-networks
- fastapi
- flask
- google-cloud
- mongodb
- opencv
- postgresql
- python
- pytorch
- react.js
- scikit-image
- siamese-networks
- tensorflow
- vue.js
