-
-

Introduction Track no 1
-
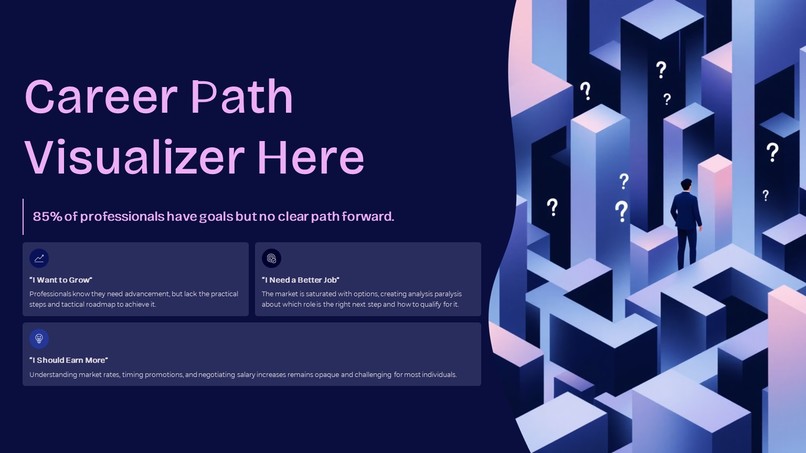
Career Path Visualizer Here Track no 1
-

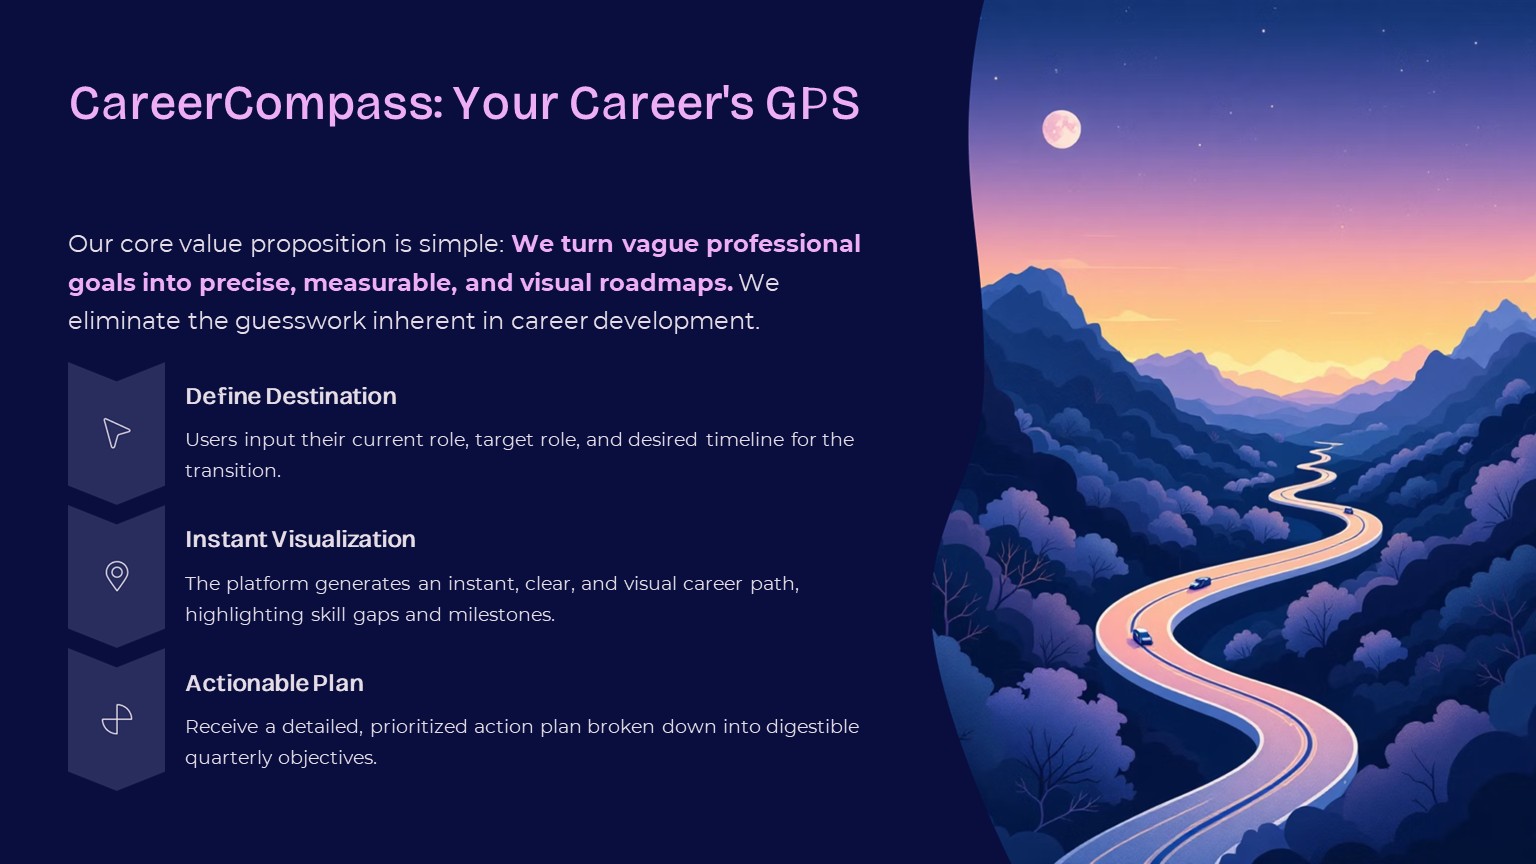
CareerCompass: Your Career's GPS Track no 1
-

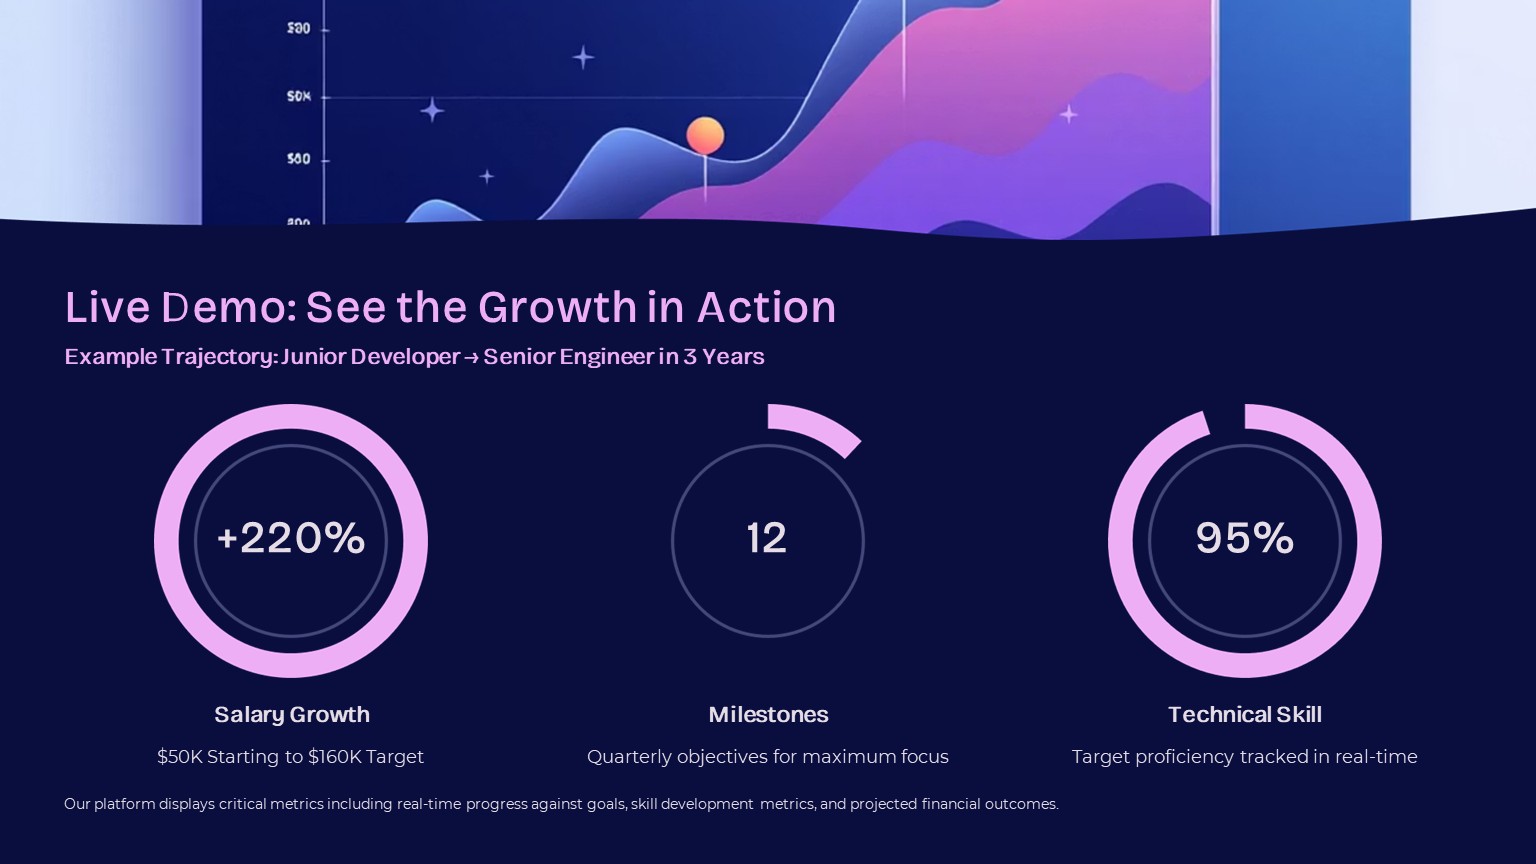
Live Demo: See the Growth in Action Track no 1
-

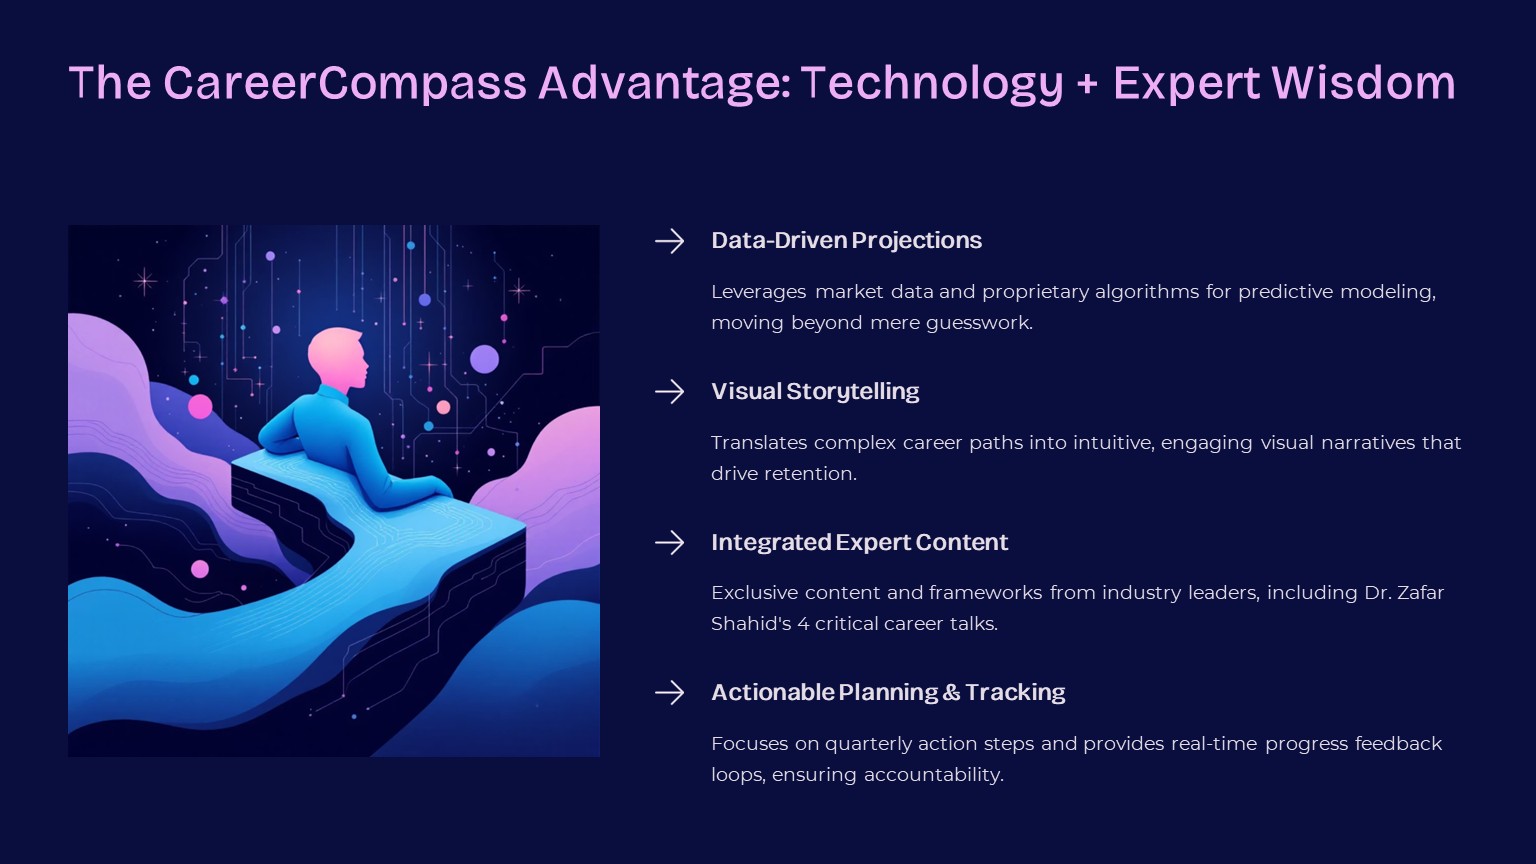
The CareerCompass Advantage: Technology + Expert Wisdom Track no 1
-
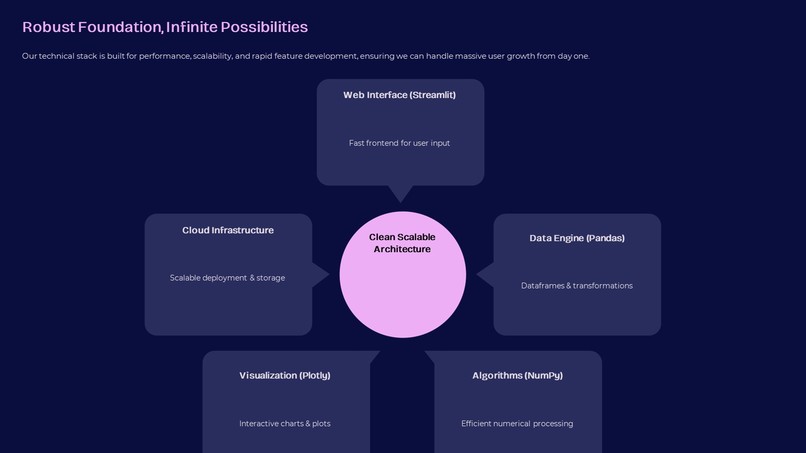
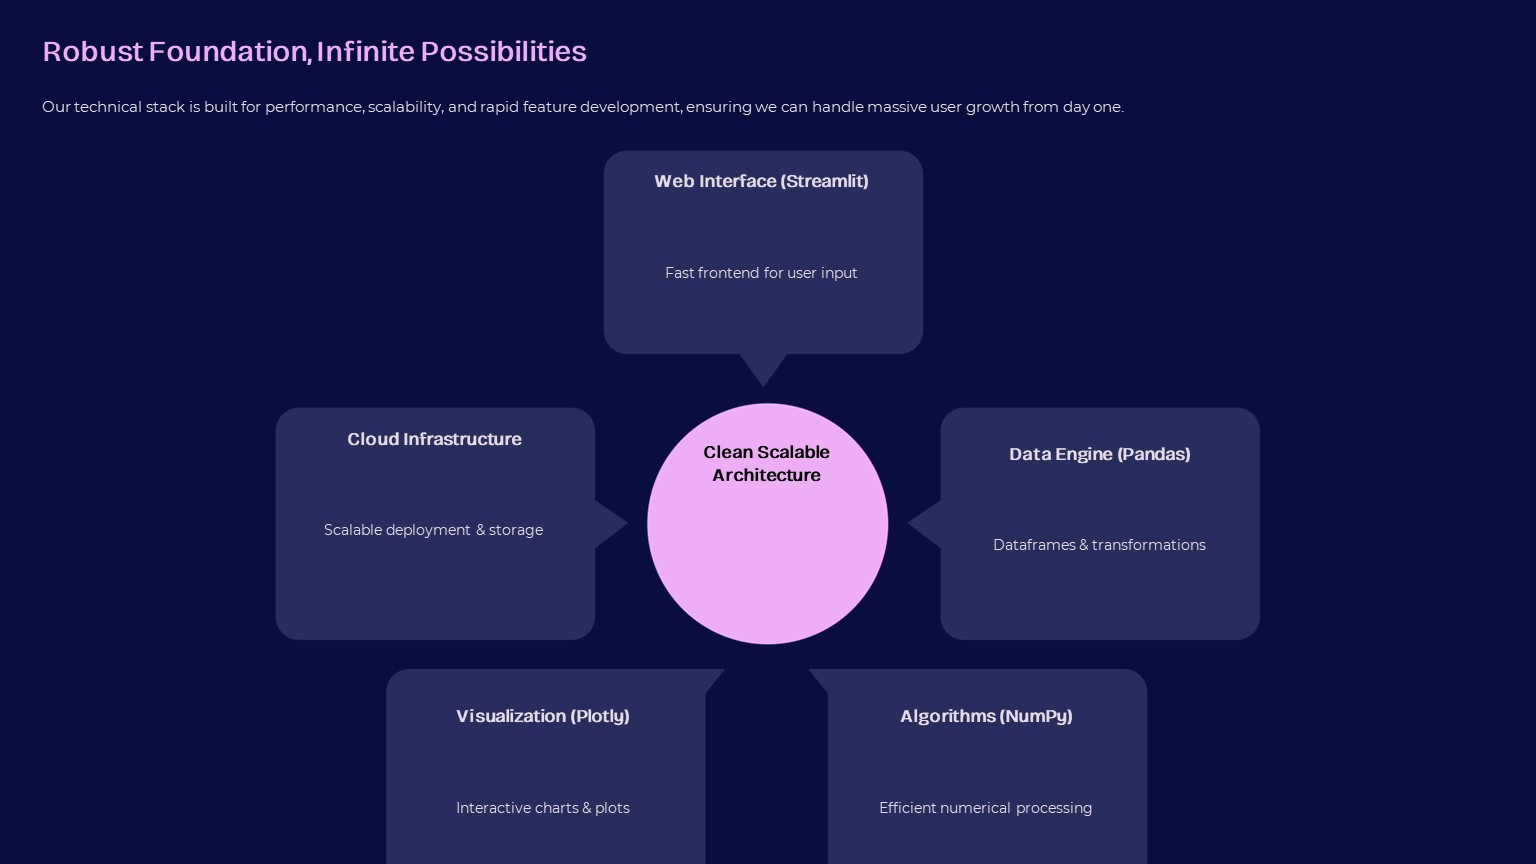
Robust Foundation, Infinite Possibilities Track no 1
-
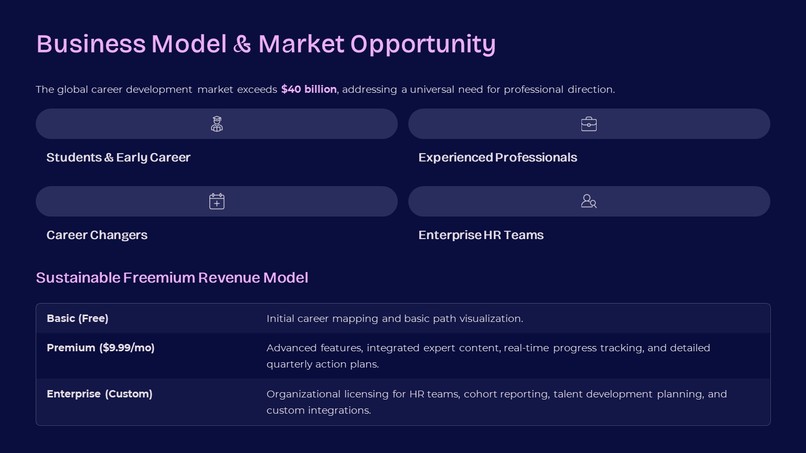
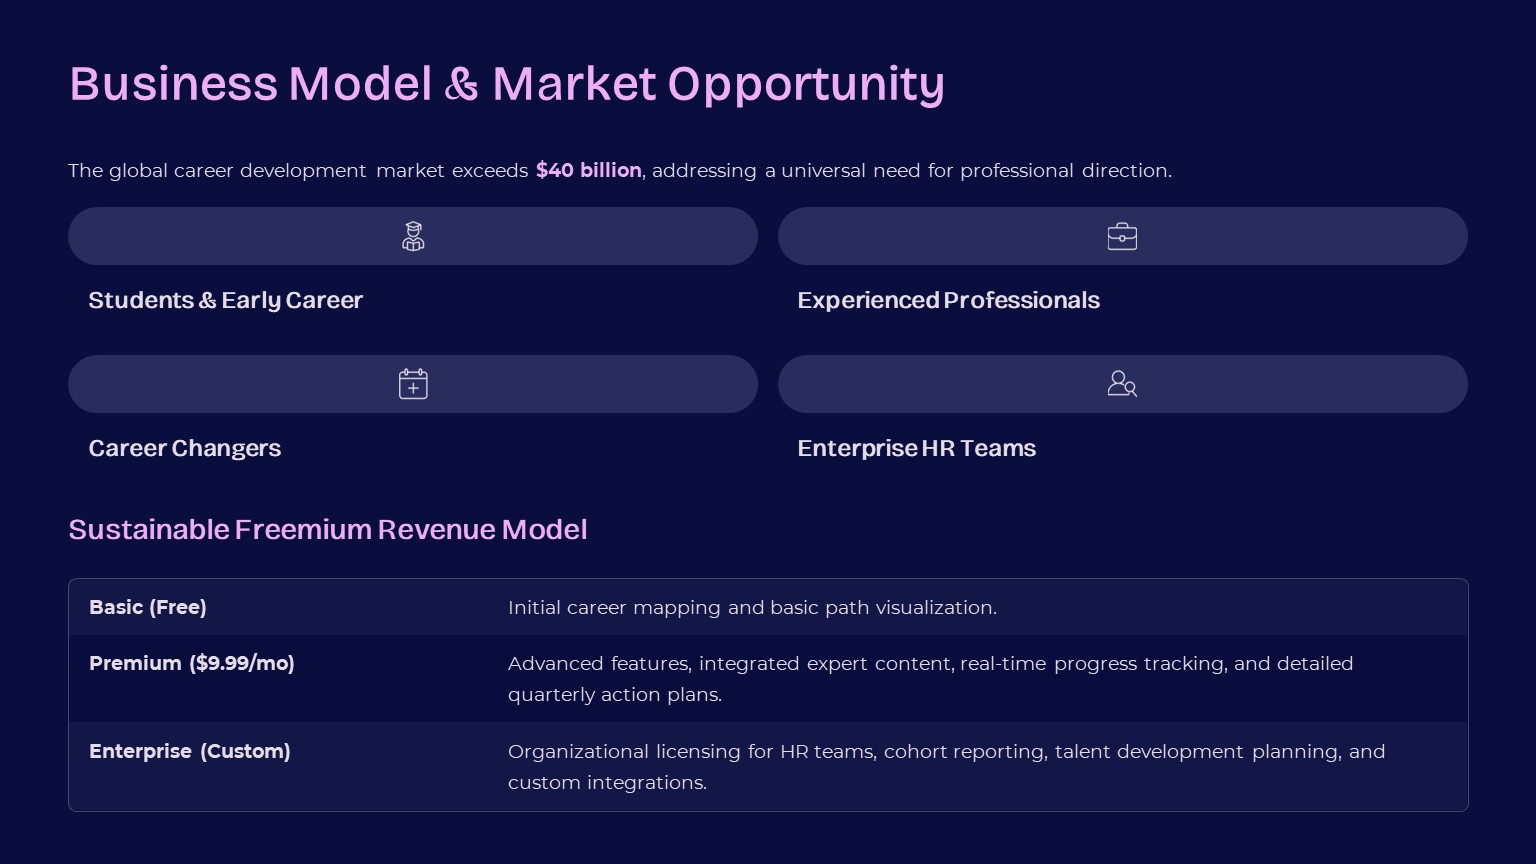
Business Model & Market Opportunity Track no 1
-
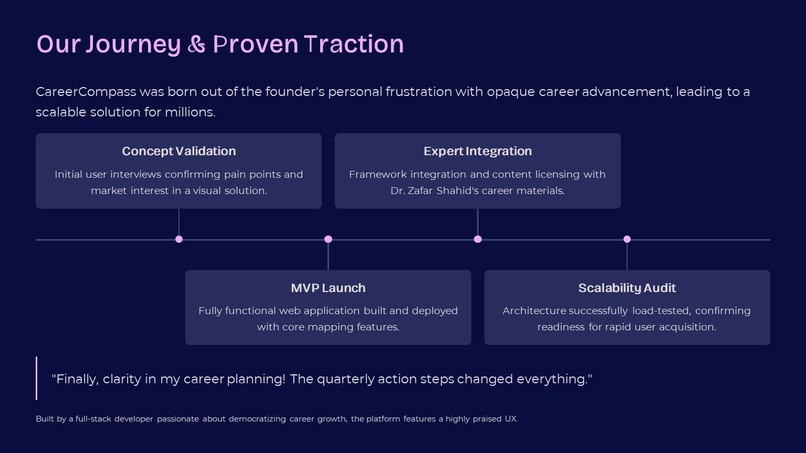
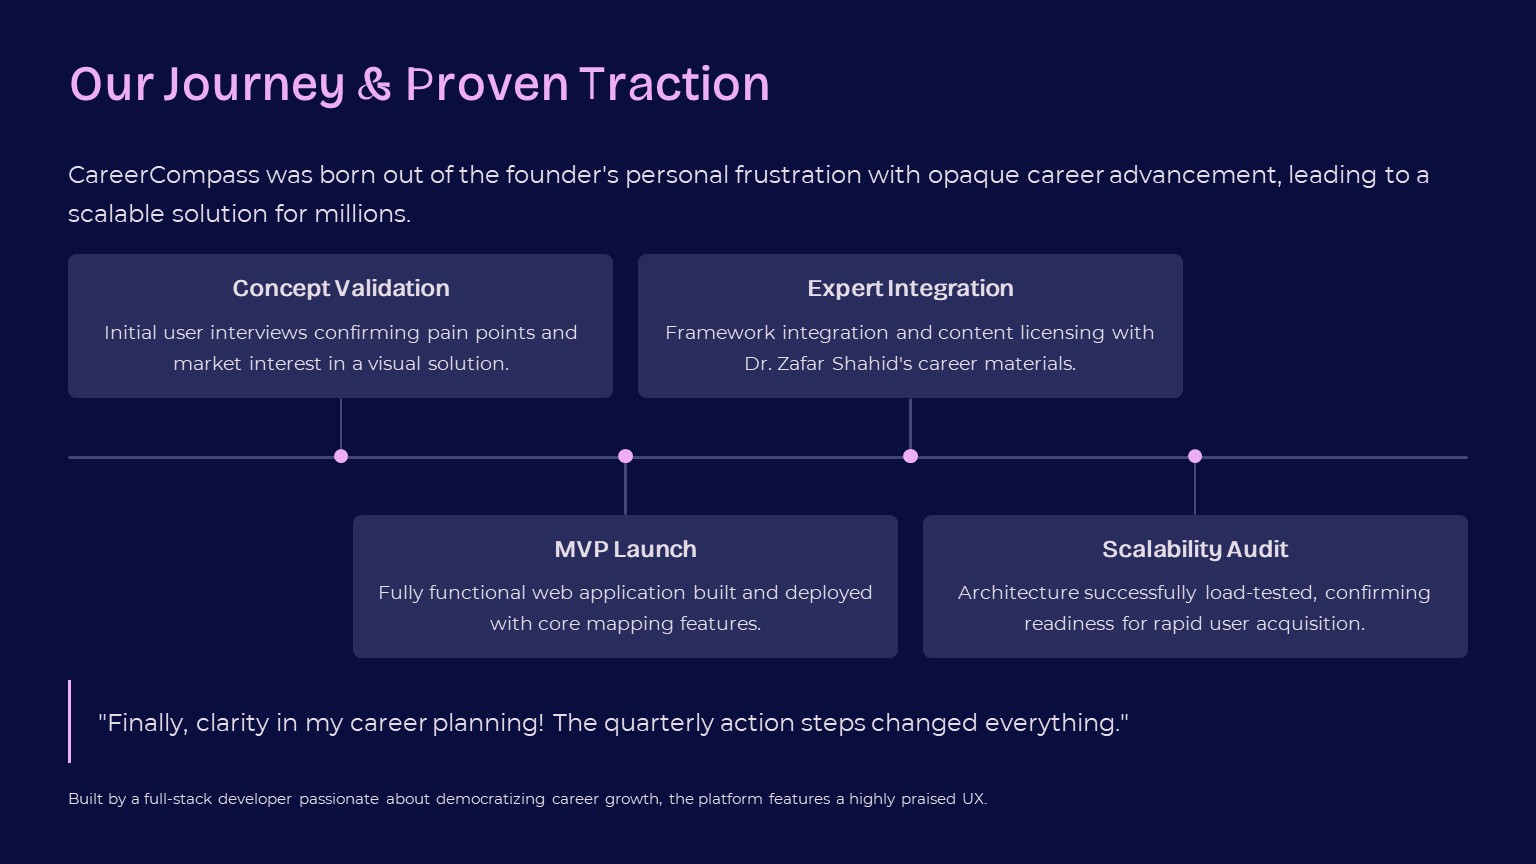
Journey & Proven Traction Track no 1
-

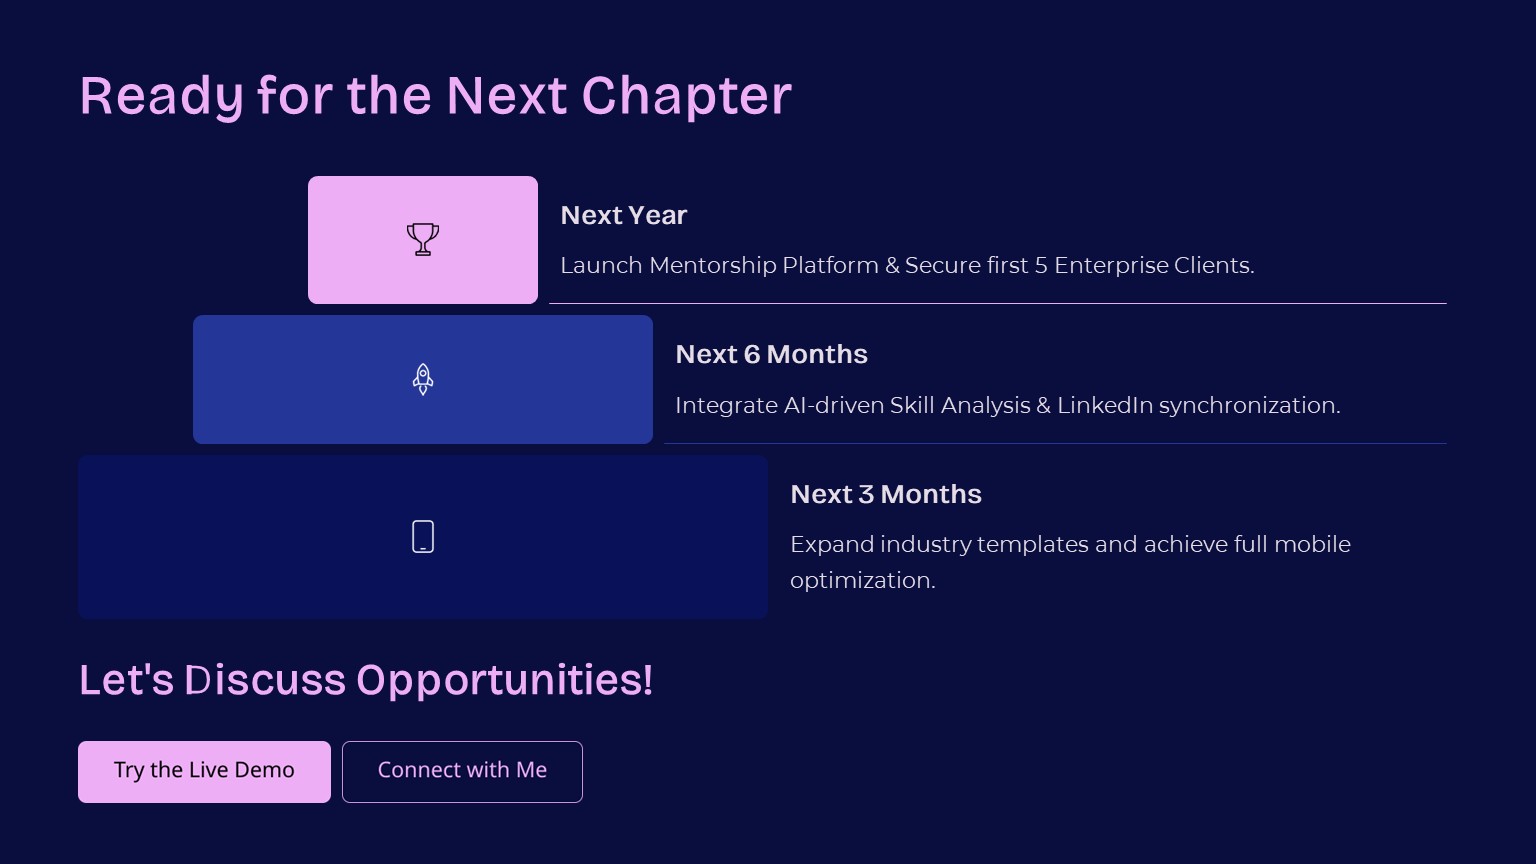
Ready for the Next Chapter Track no 1
-

screenshot of reimagine.web


Track no 01: Participate as solo
My Journey Building VisionPath: From Career Confusion to Clarity Inspiration It all started when I watched Dr. Zafar Shahid's career talks and had a lightbulb moment. 🤔 I realized that most professionals (including myself!) have big career dreams but no clear roadmap to achieve them. We all say things like:
"I want to become a senior developer" "I need to grow in my career" "I should be earning more"
But nobody shows us the exact path - what skills to learn, how long it will take, or what salary growth to expect. I wanted to build something that would turn these vague ambitions into clear, visual roadmaps that anyone could follow.
What it does VisionPath is like Google Maps for your career 🗺️. Here's how simple it works: You tell it: "I'm a Junior Developer who wants to become a Senior Engineer in 3 years" It instantly shows you: A visual growth chart with your salary progression (from $50K → $160K) A skills roadmap showing exactly what to learn each quarter
How we built it: I built VisionPath using a simple but powerful tech stack: Frontend: Streamlit (for the web interface) Visualization: Plotly (for interactive charts) Data Processing: Pandas + NumPy Backend Logic: Pure Python
Challenges we ran into: Oh boy, this journey wasn't smooth sailing! 🚢 I faced some tough challenges: The Session State Monster 😈: Getting the app to remember user inputs was harder than I expected. The data kept disappearing like socks in a dryer! Visualization headaches 📊: Making the charts look professional and interactive took countless iterations. At one point, my growth chart looked like a toddler's crayon drawing. Realistic projections 📈: How do you create salary estimates that are optimistic but still realistic? I spent days researching industry data to get this right. PowerShell problems ⚡: Remember that activation error? I almost gave up when my virtual environment refused to cooperate!
What we learned: This project taught me more than any tutorial ever could: Technical skills: Session state management, data visualization, web deployment Design thinking: How to make complex data simple and beautiful Problem-solving: When code doesn't work, take a break and come back with fresh eyes User experience: Little things like good error messages make a huge difference
What's next for VisionPath: This is just the beginning! Here's what's coming: 🚀
Short-term: Add more industries and job roles Include real-time salary data from job markets Create PDF export for career plans
Long-term dreams: AI-powered skill gap analysis Mentorship matching features Mobile app version Integration with LinkedIn profiles
I believe everyone deserves a clear path to their dream career, and I'm committed to making VisionPath the go-to tool for career planning.

Log in or sign up for Devpost to join the conversation.