-
-
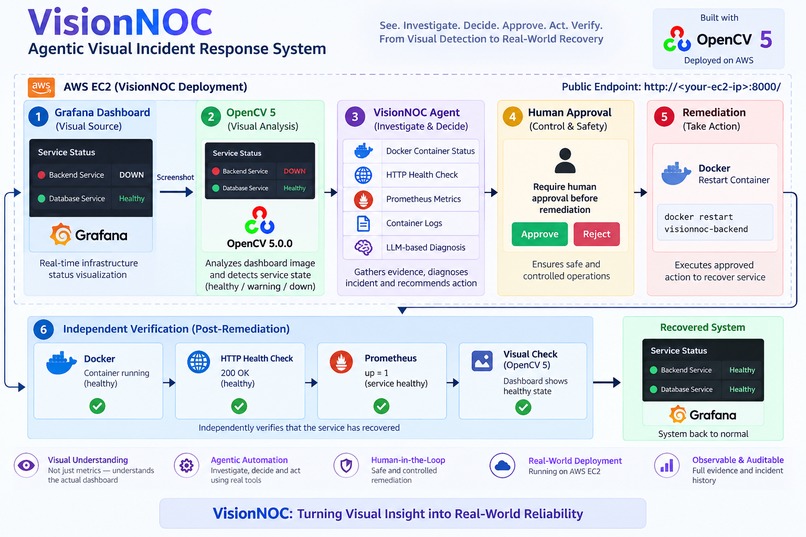
Architecture
Inspiration
In a real NOC, engineers often start with a monitoring dashboard. They see a panel turning red, open logs, check the server, investigate the cause, and then decide whether a recovery action is safe.
We wanted to explore a different question:
What if an AI agent could start from the same visual evidence an engineer sees and carry the investigation forward?
That idea became VisionNOC. Instead of treating a Grafana dashboard as just a visualization, we use OpenCV 5 to understand the dashboard image, identify the incident state, and pass that evidence to an agent that can investigate the underlying system.
The goal was not simply to detect an outage. We wanted to build the complete loop:
SEE → UNDERSTAND → INVESTIGATE → DECIDE → HUMAN APPROVAL → ACT → VERIFY
What it does
VisionNOC is an agentic visual incident response system for infrastructure monitoring.
A typical incident works like this:
- A Grafana monitoring dashboard shows a backend failure.
- VisionNOC captures and analyzes the dashboard using OpenCV 5.
- The vision layer determines whether the system appears healthy, degraded, or down and produces a confidence score.
- The agent investigates multiple signals, including:
- Docker container state
- HTTP health
- Prometheus metrics
- Container logs
- The agent forms a diagnosis and decides whether a remediation action is appropriate.
- Before changing the infrastructure, VisionNOC pauses for human approval.
- After approval, the agent performs the controlled remediation.
- The system independently verifies recovery using multiple signals.
For example, when the backend container is stopped, VisionNOC can detect the visual failure, confirm the Docker and monitoring state, identify the stopped backend, request approval, restart the real Docker container, and then verify that the application and monitoring signals recover.
How we built it
We built VisionNOC as a combination of computer vision, agentic investigation, infrastructure tools, and a human-in-the-loop control layer.
Visual detection
OpenCV 5 is the first stage of the system. It processes the monitoring dashboard image and extracts visual evidence about the incident state.
This makes the dashboard itself part of the incident input instead of requiring the system to directly consume structured monitoring data from the beginning.
Agentic investigation
After visual detection, the agent investigates the system using dedicated tools.
The investigation can check:
- Docker container status
- HTTP health endpoints
- Prometheus metrics
- Container logs
- Visual evidence
The agent combines these signals to form an incident diagnosis rather than relying on a single monitoring value.
Human approval
Remediation is intentionally separated from diagnosis.
The agent can recommend an action such as:
restart_backend
but it does not immediately execute the action. The incident enters an awaiting approval state and requires an operator to approve the remediation.
Real remediation
For the AWS deployment, VisionNOC uses the Docker SDK to interact with the actual running container.
The remediation is therefore not just simulated in the live demonstration. After approval, the backend container can actually be restarted.
Independent verification
After remediation, VisionNOC checks the system again.
Recovery is evaluated using independent signals such as:
- Docker state
- HTTP health
- Prometheus
- visual state
The system reports the recovery only after the verification stage.
Deployment
The complete system was deployed on an AWS EC2 instance with Docker Compose.
The stack contains the VisionNOC API, demo backend, Grafana, and Prometheus.
Challenges we ran into
One of the biggest challenges was making the project behave differently in development, testing, and the real AWS environment without hiding failures.
Initially, the test environment and the real Docker environment behaved differently. The CI runner had Docker available, but it did not have our specific demo container. This caused the tests to try real Docker operations instead of using the simulated backend used by the test suite.
We fixed this by making the infrastructure tools fall back to the simulated cluster when the real target container is unavailable, while keeping the real Docker path active on AWS.
Another challenge was verification timing. Prometheus does not necessarily observe a container recovery immediately after a restart. A verification performed too early could therefore report an incorrect state.
We addressed this by adding a short verification delay before the second Prometheus check.
We also had to make sure that remediation was not triggered automatically just because the vision model detected a failure. This led us to separate detection, diagnosis, approval, remediation, and verification into distinct stages.
Accomplishments that we're proud of
We are especially proud that VisionNOC goes beyond a visual classification demo.
The system demonstrates a complete incident-response loop where:
- OpenCV 5 provides the initial visual understanding.
- An agent investigates the underlying infrastructure.
- Multiple monitoring signals are correlated.
- A remediation decision is generated.
- A human must approve the action.
- The approved action can modify a real Docker container.
- Recovery is independently verified afterward.
We also built automated regression tests and configured GitHub Actions CI. The final CI run passed successfully after fixing the environment-specific Docker behavior.
Most importantly, we were able to demonstrate the complete flow on AWS:
Dashboard failure → visual detection → investigation → diagnosis → human approval → real Docker restart → recovery verification.
What we learned
We learned that building an agentic infrastructure system is much more than connecting an LLM or an AI model to a few tools.
The difficult part is designing the boundaries between the stages.
A reliable system needs to answer:
- What evidence does the agent actually have?
- How confident is the initial detection?
- Which tools can the agent use?
- What actions is it allowed to perform?
- Which actions require human approval?
- How do we know the remediation actually worked?
We also learned that verification should be treated as a separate stage, not simply as the result of the remediation command.
A successful docker restart does not automatically mean that the application has recovered. That is why VisionNOC checks the system again using multiple independent signals.
What's next for VisionNOC — Agentic Visual Incident Response System
The current version focuses on a controlled backend incident and a small set of infrastructure tools.
Next, we want to expand VisionNOC toward more realistic NOC environments.
Potential next steps include:
- Supporting more incident types beyond backend failures.
- Adding richer visual understanding for complex Grafana dashboards.
- Adding log and metric correlation across multiple services.
- Supporting Kubernetes-based remediation.
- Adding more safe remediation policies.
- Improving confidence calibration and incident classification.
- Building a richer incident timeline and audit trail.
- Expanding the evaluation dataset with more healthy, degraded, failed, noisy, and visually corrupted dashboard cases.
- Adding additional human approval policies based on the risk of the proposed action.
The long-term goal is to make VisionNOC a human-supervised visual operations agent that can observe infrastructure the way an engineer does, investigate it systematically, take carefully controlled actions, and prove whether the system actually recovered.
Built With
- agentic
- agents
- ai
- amazon
- amazon-web-services
- compose
- computer
- docker
- ec2
- fastapi
- grafana
- opencv
- prometheus
- python
- vision

Log in or sign up for Devpost to join the conversation.