-
-
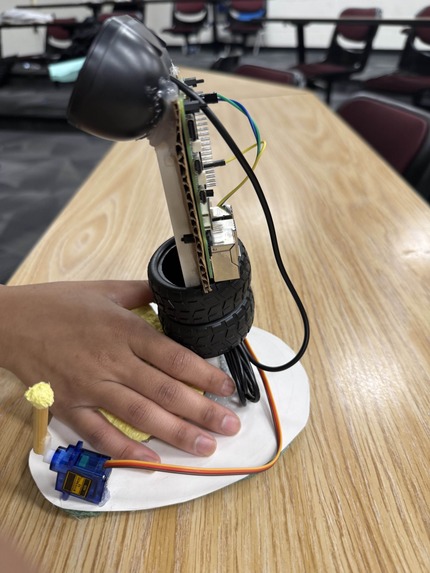
Vision Mouse Prototype - Photo 1
-
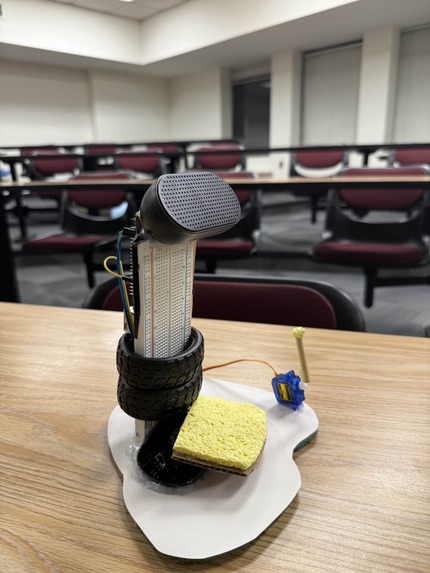
Vision Mouse Prototype - Photo 2
-
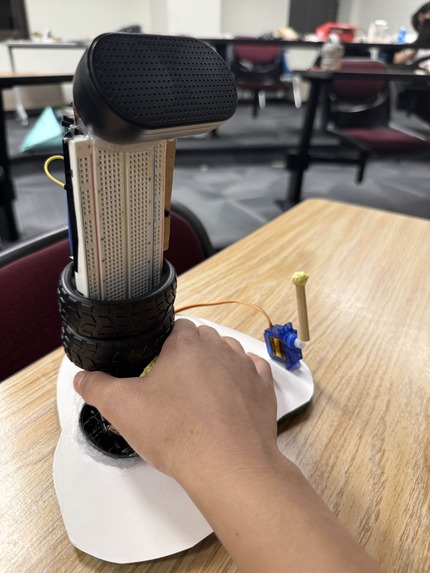
Vision Mouse Prototype - Photo 3
-

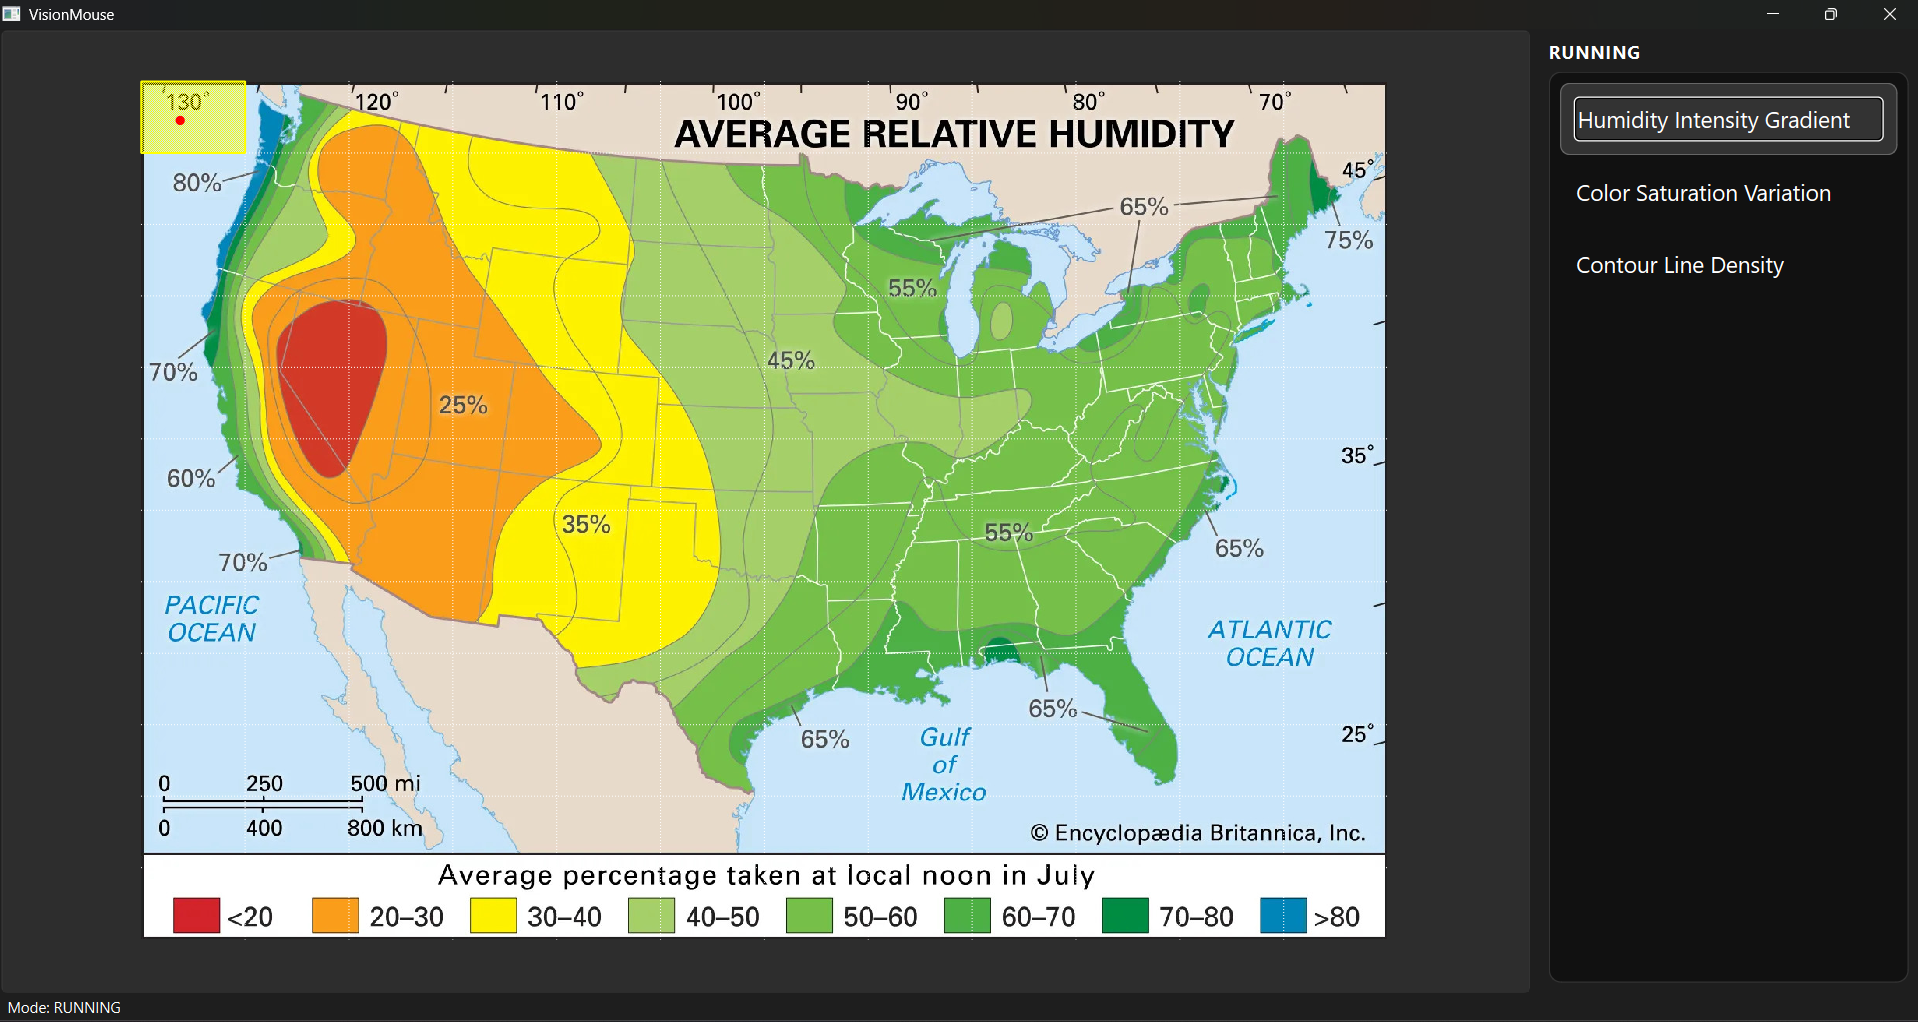
Desktop tool to connect VisionMouse and additional options
-

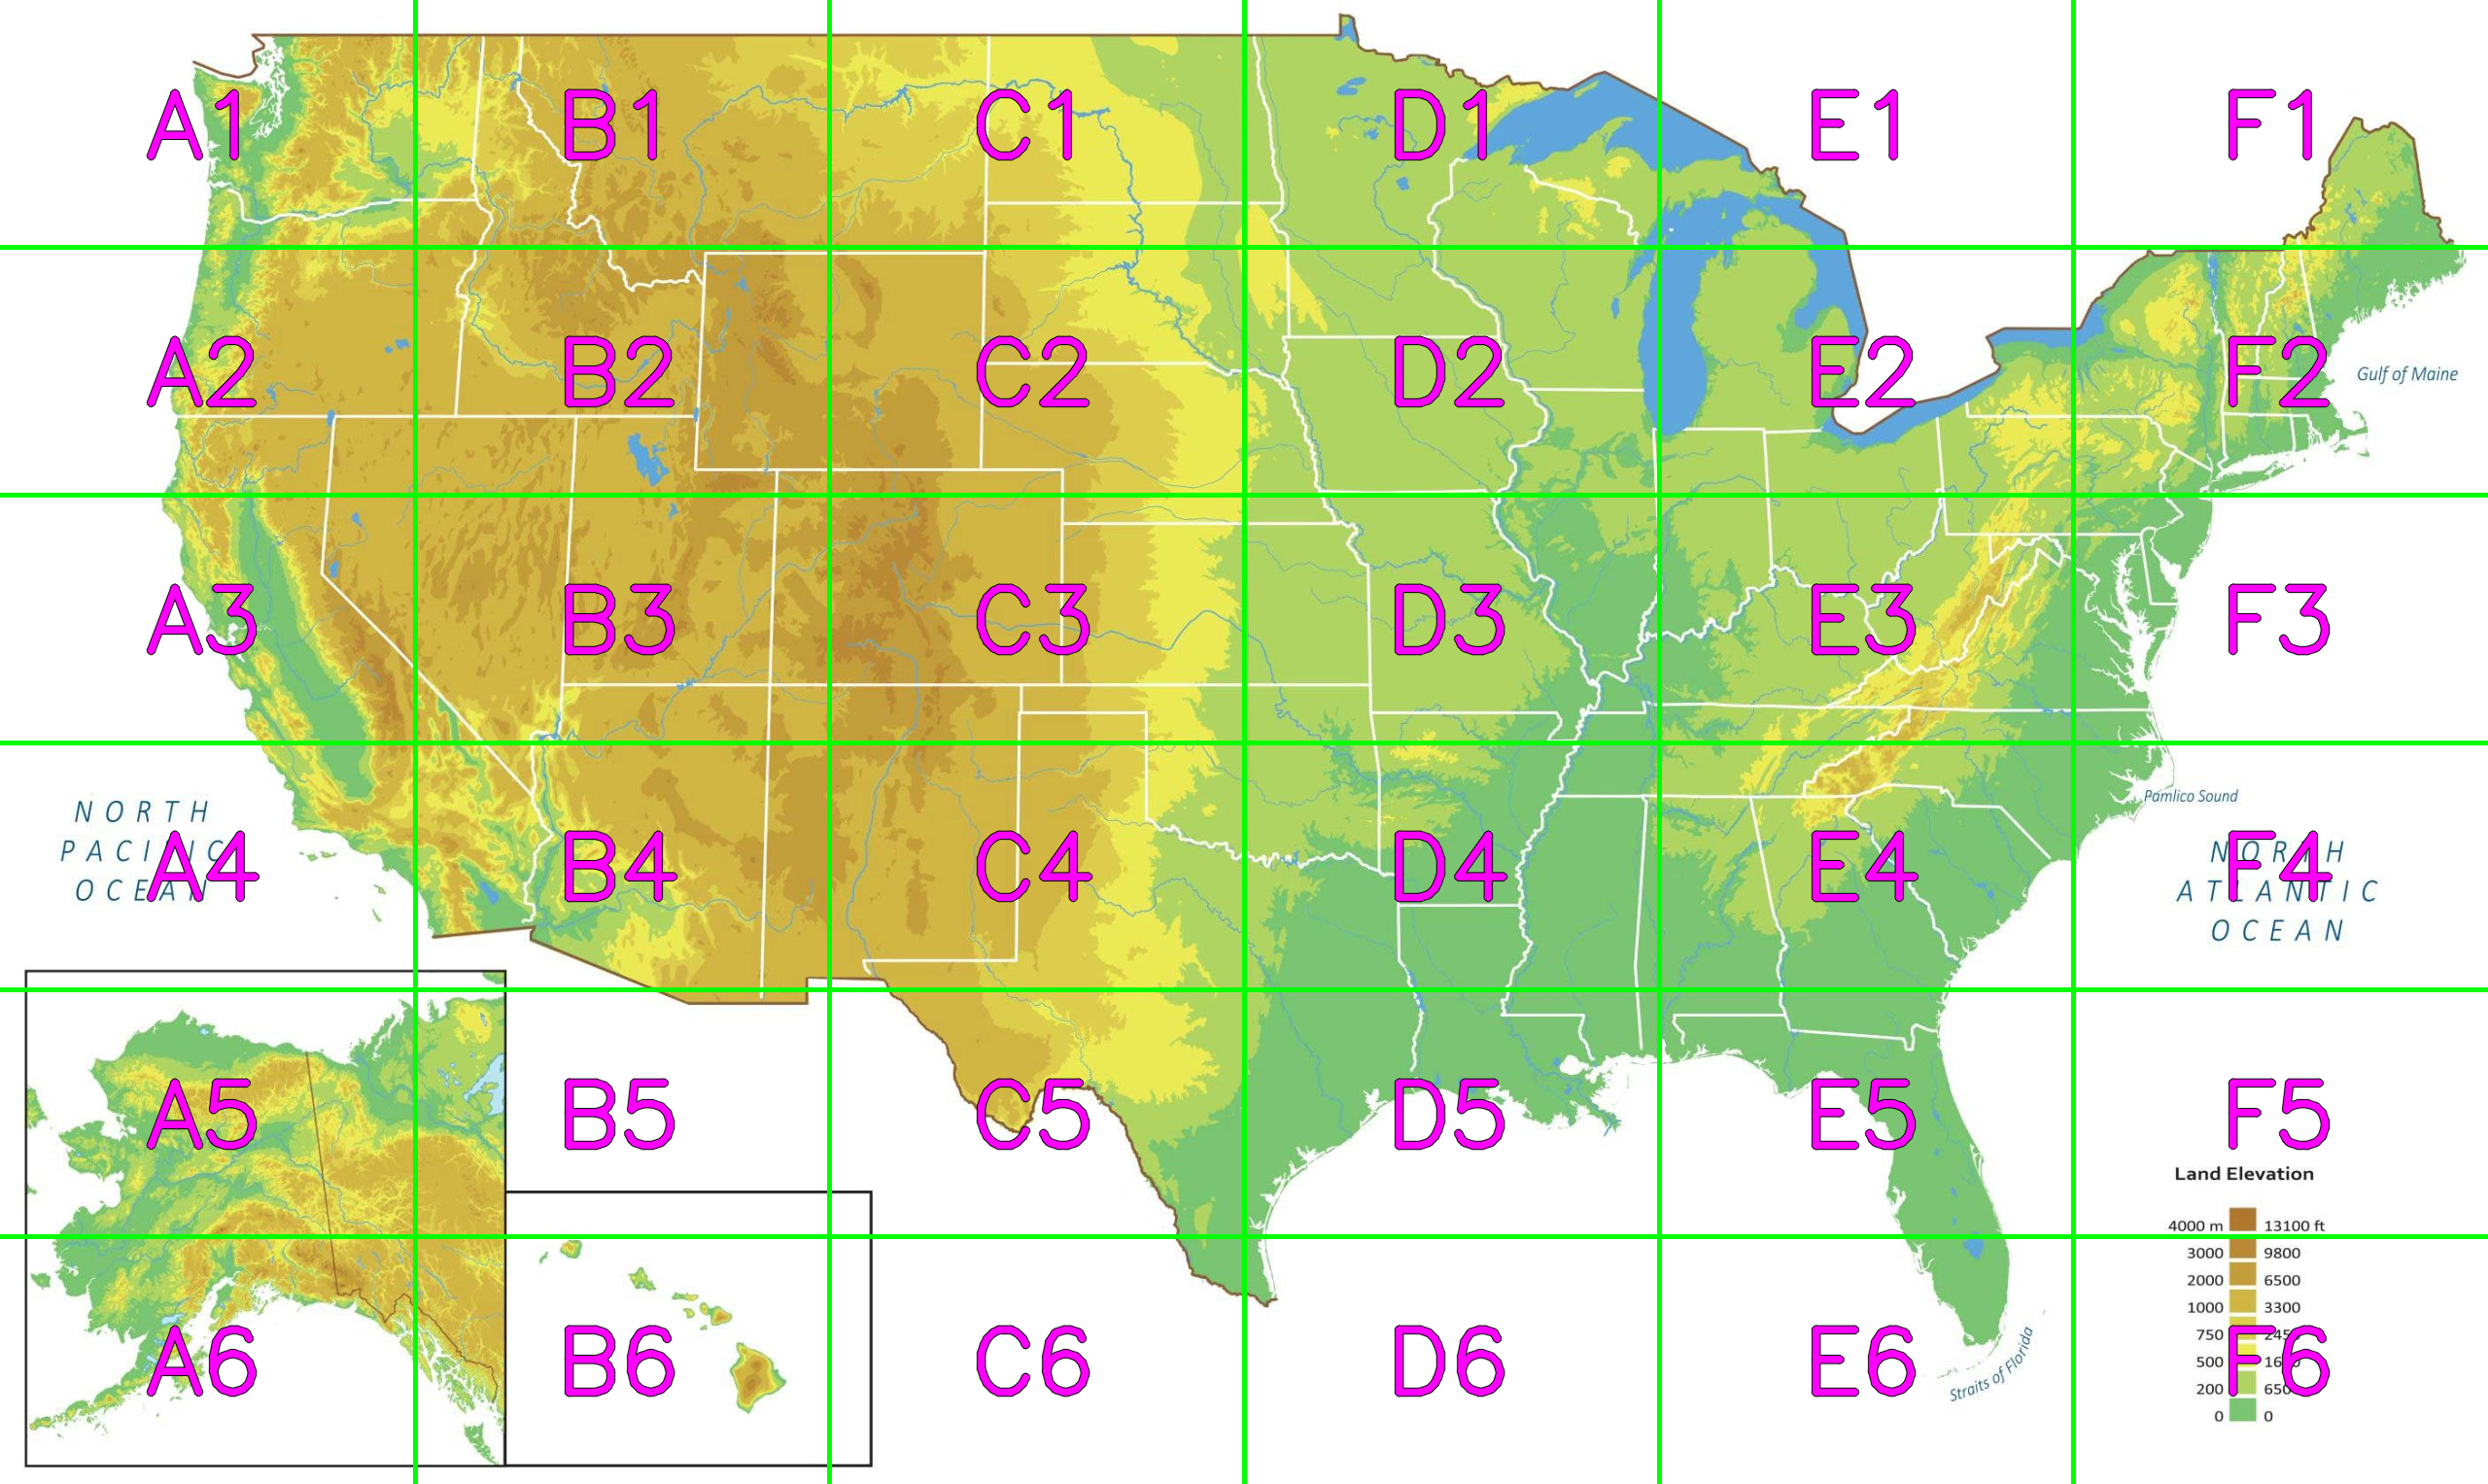
Splitting images into sections for LLM


VisionMouse — Spatial AI Mouse for Visual Data Access
Inspiration
Modern workplaces are increasingly visual: financial analysts scan heatmaps and candlestick charts, architects inspect CAD blueprints, and engineers review dense schematics and tolerances. For visually impaired professionals, traditional screen readers are fundamentally mismatched to this reality. They force slow, linear navigation through complex interfaces just to find a single chart — or they fail entirely when critical elements are unlabeled, reading only “image.”
This creates a visual data lockout that reduces productivity, independence, and career mobility. We built VisionMouse to restore workflow autonomy by translating spatial, visual information into intuitive audio + tactile feedback that can be explored as quickly as sighted users scan a screen.
What It Does
VisionMouse is a custom, AI-powered office mouse designed for visually impaired professionals.
It combines a comfortable vertical form factor with optical motion tracking, tactile servo feedback, and contextual spatial audio so users can explore visual data non-linearly — by “scanning” it in a natural, spatial way.
Core workflow
- Snapshot any visual content (chart, map, UI panel, CAD drawing) with a button press.
- Gemini-powered multi-agent analysis identifies what matters in the image and proposes “factors” a user might want to explore.
- The user selects a factor using keyboard shortcuts while VisionMouse reads options via high-quality TTS.
- The user then moves the mouse to explore the image as a virtual spatial field:
- Audio intensity / pitch / SFX density changes continuously to match the chosen factor.
- A servo tap / touch marks areas that are irrelevant (e.g., outside borders, background, ocean, empty margins).
- On-demand, the user can request a precise textual description of the region under the pointer.
Example: U.S. Humidity Map
After the snapshot, VisionMouse can propose factors such as:
- Humidity intensity
- Land vs. ocean
- State borders / boundaries
- Labels (cities, legends, axes)
If the user selects humidity intensity, moving across the map produces a rain-like sound whose intensity rises and falls with humidity. If the pointer moves over the ocean or outside the border, the mouse provides a distinct servo touch and a separate cue indicating “no valuable information here.”
The result is a fast, spatial interaction loop: users can locate patterns, edges, hotspots, and outliers without hunting line-by-line.
How We Built It
Hardware
- Raspberry Pi 5 as the core compute node
- Optical motion detection / trackball sensor for precise movement
- Servo motors for tactile “contact” feedback (e.g., boundary/irrelevant zones)
- Haptic vibration motor for secondary tactile signals
- Speaker for TTS and generated sound effects
Software
- Built in Python
- A multi-agent pipeline that converts a single snapshot into:
- image context
- factor options for the user
- relevance masks (where information is meaningful vs. irrelevant)
- a grid of intensities for real-time audio/tactile rendering
How We Use Gemini (Uniquely)
Gemini is the system’s “visual reasoning engine.” We use it for more than captioning — we use it to produce structured, spatially grounded outputs that drive real-time feedback.
1) Multi-agent vision reasoning
Instead of one monolithic prompt, our pipeline uses specialized agents, for example:
- Context Agent: determines what the image is (map, chart, blueprint, UI panel).
- Factor Discovery Agent: proposes 1–6 continuous, scannable factors the user might care about (e.g., density, intensity, risk, tolerance tightness, temperature).
- Grid Scoring Agent: assigns factor intensity values across a fixed grid overlaid on the image.
- Relevance Agent: flags cells as relevant vs. irrelevant (e.g., outside borders, empty whitespace, background regions).
This modular approach makes the system adaptive to different professions and tasks without rewriting the whole application.
2) Position markers / “grid embedding” prompting
To keep latency low, we avoided sending dozens of cropped sub-images to the model. Instead, we:
- overlay a fixed coordinate grid on the snapshot (e.g., A1–F6),
- add location markers and explicit coordinate references,
- and instruct Gemini to output cell-level intensity + relevance in one response.
This dramatically reduces API round-trips while still producing spatially useful information for continuous scanning.
3) Precision descriptions on demand
When the user pauses or clicks, Gemini produces a targeted explanation of exactly what’s under the pointer (e.g., “You are near the humidity boundary between moderate and high levels, close to the legend scale”). This supports both fast scanning and deep inspection.
How We Use ElevenLabs
ElevenLabs is not just our TTS engine — it is how we make complex data feel intuitive.
1) High-quality TTS for navigation and factor selection
Users can quickly choose factors and modes via keyboard, guided by natural, low-fatigue voice output suitable for long work sessions.
2) Context-matched SFX generation
We use ElevenLabs’ sound-generation capabilities to create contextual sound effects that match the image domain:
- rain-like texture for humidity
- wind-like texture for pressure gradients
- mechanical/metallic cues for CAD tolerances
- sonar-like sweeps for spatial “search” mode
This matters because sound design is comprehension: the more intuitive the sound metaphor, the faster a user can build a mental model of the visual space.
3) Multi-channel audio cues
We separate “value intensity” cues from “irrelevant area” cues so the user never confuses data absence with low intensity.
Challenges We Ran Into
We initially attempted to run a small vision model fully locally on the Raspberry Pi to maximize privacy. In practice, small local models struggled with real professional documents (dense charts, cross-sections, small text, tight tolerances).
We pivoted mid-hackathon to an edge-to-cloud architecture:
- Pi handles capture, control, and feedback in real-time
- Gemini handles high-level spatial reasoning and OCR
- Outputs are structured so the device can respond immediately
This gave us the expert-level intelligence we needed without sacrificing speed.
Accomplishments We’re Proud Of
- Built a working prototype that bridges hardware feedback and cloud AI reasoning with near-zero interaction friction.
- Designed an interaction model that replaces linear screen reading with spatial exploration.
- Implemented a fast, structured pipeline using grid-based inference (not dozens of crops).
- Mapped a realistic manufacturing path to reduce COGS from ~$200 to ~$50 at scale (custom PCB + injection molding).
What We Learned
Technical
- How to route physical inputs (motion + GPIO + buttons) into a multi-agent cloud pipeline
- How to design structured model outputs that can drive real-time feedback
- How much difference sound metaphors make for speed and intuition
Product / business
- Hardware economics: scale, BOM discipline, and retail markup requirements
- The importance of designing for long-session comfort in office workflows
What’s Next
- Transition from a Pi 5 prototype to an industrial Compute Module design in a compact SLS-printed shell.
- Run pilot programs with visually impaired professionals (finance, architecture, engineering).
- Expand the agent system to support more domains (dashboards, spreadsheets, UI automation).
- Upgrade to real-time video understanding so VisionMouse can guide users through moving 3D renders, live dashboards, and presentations.
Why This Matters (Equity & Autonomy)
VisionMouse is built to reduce workplace friction and discrimination caused by inaccessible visual tools. Instead of requiring extra accommodations or constant assistance, users can:
- locate meaningful regions in seconds,
- extract precise details on demand,
- and navigate visual workflows independently.
Our goal is simple: end visual data lockout and restore full professional autonomy.


Log in or sign up for Devpost to join the conversation.