-
-
color blindness contrast
-
demo contrast
-
demo dashboard
-

Reimagine Analysis
-
Report


Track 3: Visual Experience Analytics 🧠 Inspiration
We were inspired by the growing need for digital accessibility and inclusivity on the web. Many websites still fail to meet WCAG (Web Content Accessibility Guidelines) standards, making them difficult to use for individuals with visual or cognitive impairments. We wanted to create a tool that not only detects accessibility issues but also educates developers and designers about improving readability, color contrast, and content clarity — all in one place.
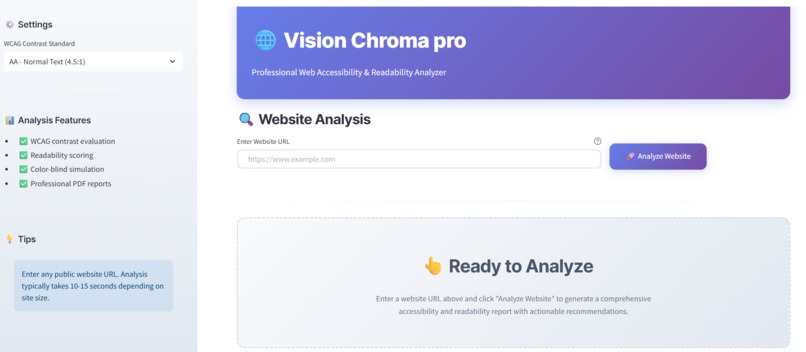
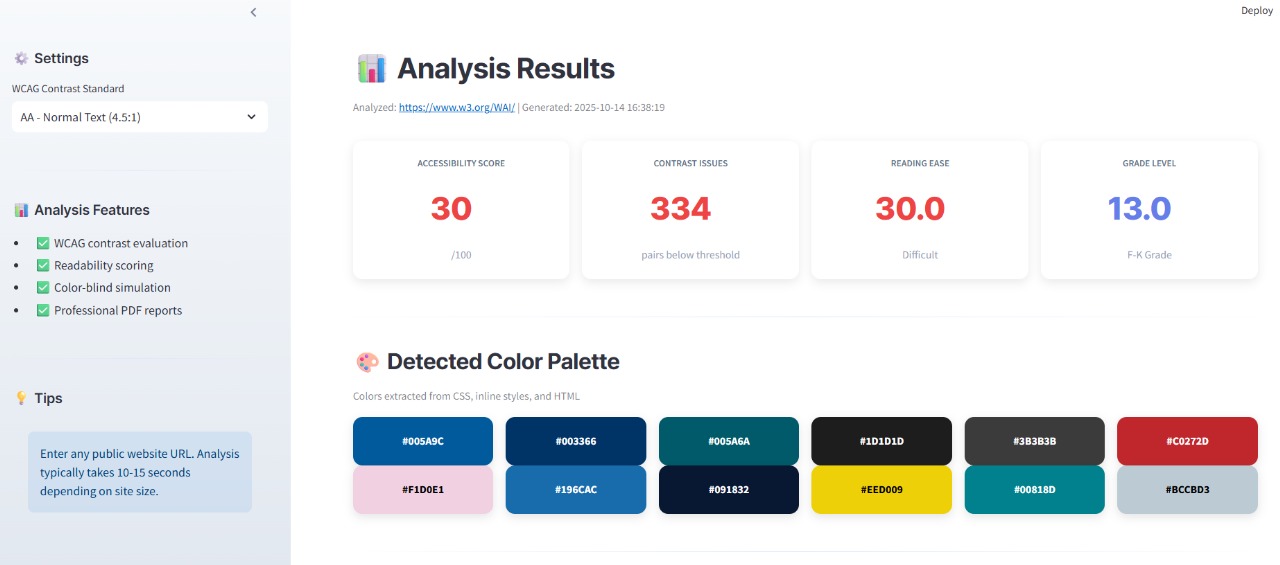
💡 What it does
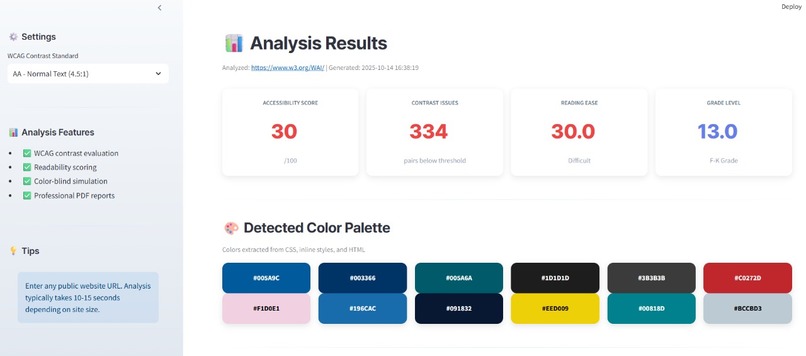
Vision Chroma Pro is a web accessibility and readability analyzer that evaluates websites for:
WCAG compliance (AA/AAA levels)
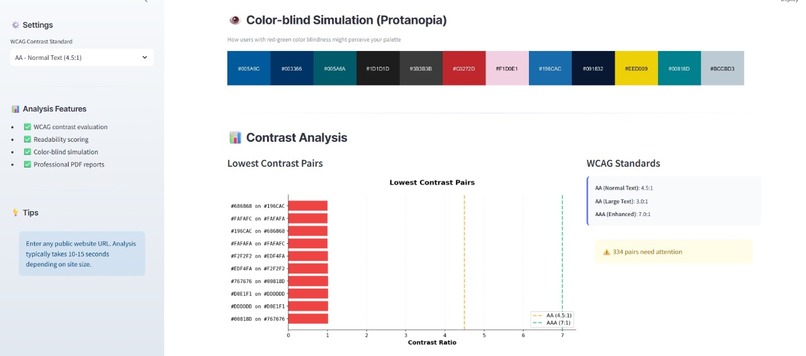
Color contrast issues
Color-blind accessibility
Typography hierarchy
Readability and content complexity
User attention heatmaps
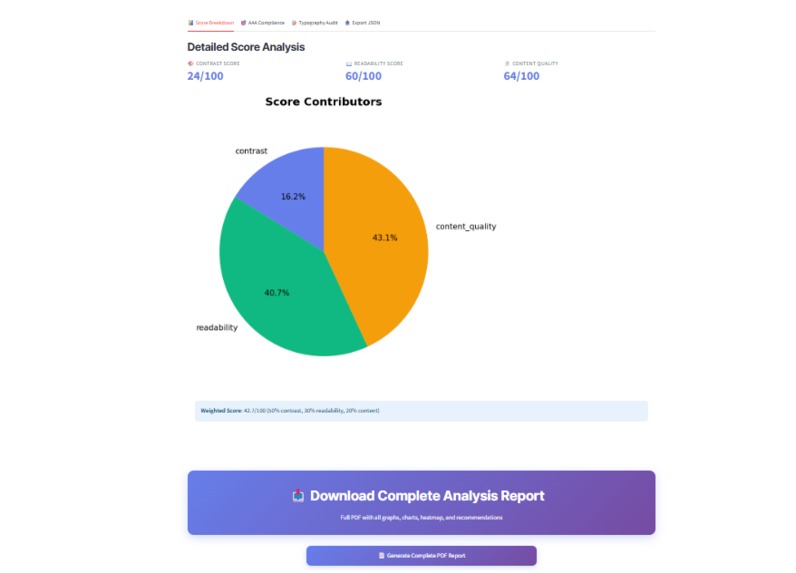
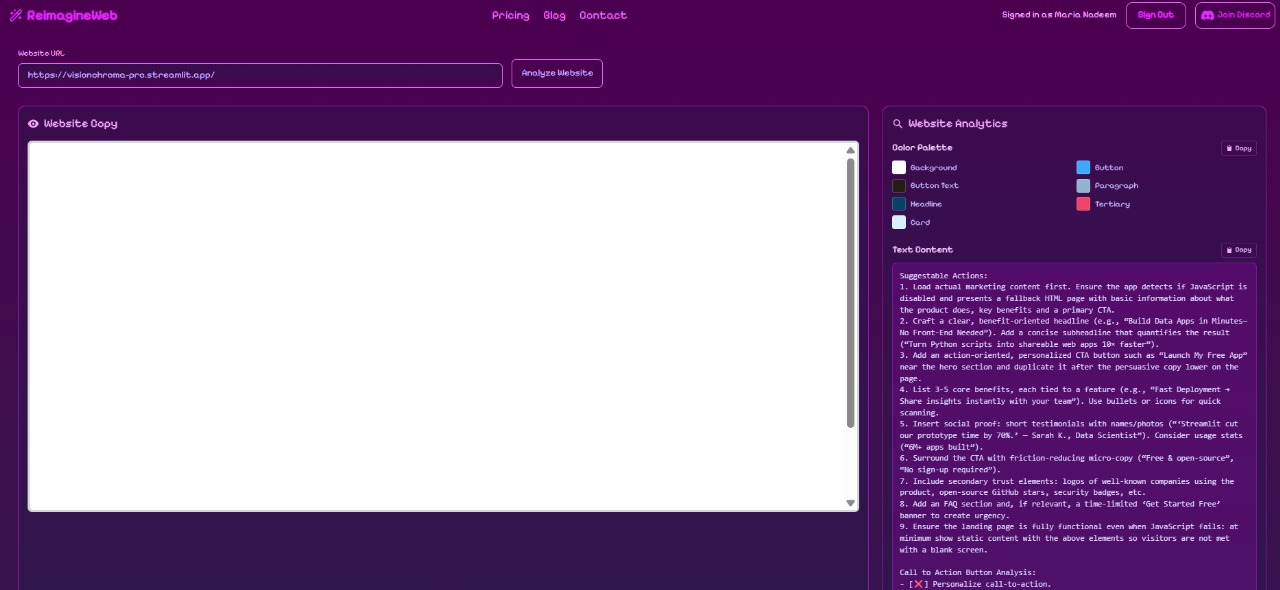
It generates interactive visual analytics, detailed PDF reports, and AI-driven improvement recommendations to help developers build more inclusive, user-friendly websites.
🛠️ How we built it
We built Vision Chroma Pro using:
Streamlit for an interactive and responsive web interface
Python as the core engine
BeautifulSoup & Requests for website scraping and content extraction
Textstat for readability scoring
Colorspacious, CSSUtils, and Pillow for color analysis and simulation
Matplotlib & Seaborn for contrast charts, heatmaps, and visual analytics
ReportLab for automated PDF report generation
We structured the system into modular components (in /modules) — handling color extraction, WCAG evaluation, heatmap generation, and report compilation — making the project scalable and easy to extend.
⚙️ Challenges we ran into
Handling dynamic CSS and inline styles from multiple sources while maintaining accuracy in color extraction.
Ensuring WCAG contrast calculations were precise for all possible combinations of foreground/background colors.
Implementing realistic color-blind simulations that match human visual perception using both advanced (Colorspacious) and fallback modes.
Optimizing performance for large, content-heavy websites without exceeding Streamlit’s runtime limits.
Designing clear, actionable reports that non-technical users can easily interpret.
🏆 Accomplishments that we're proud of
Achieved end-to-end accessibility auditing with both visual and textual reporting.
Implemented real-time color-blind simulations and contrast validation.
Created an automated PDF report generator with data visualizations, summaries, and recommendations.
Designed a streamlined and interactive UI that simplifies a typically complex auditing process.
Built a tool that empowers developers to make the web more inclusive and accessible for everyone.
📚 What we learned
In-depth understanding of WCAG 2.1 accessibility standards and color contrast principles.
How to integrate multiple analysis techniques — readability, contrast, and typography — into one coherent workflow.
The importance of human-centered design in accessibility tools.
The power of modular architecture for scalable and maintainable AI + data analysis applications.
🚀 What's next for Vision Chroma Pro
Integrating AI-driven code suggestions for automatic accessibility fixes.
Adding live website monitoring for continuous WCAG compliance tracking.
Expanding multi-page and batch analysis for enterprise users.
Building a browser extension for quick, one-click accessibility checks.
Incorporating speech and auditory contrast analysis to enhance inclusivity for all users.
Built With
- api
- beautiful-soup
- cloud
- cssutils
- github
- javascript
- matplotlib
- numpy
- pandas
- pil)
- pillow
- python
- reimagineweb
- reportlab
- seaborn
- streamlit


Log in or sign up for Devpost to join the conversation.