-
-
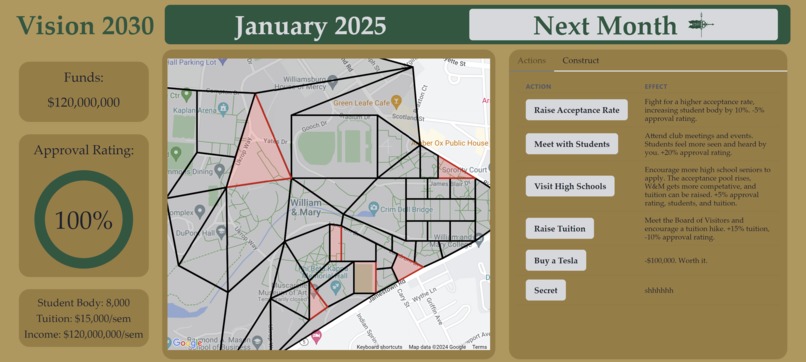
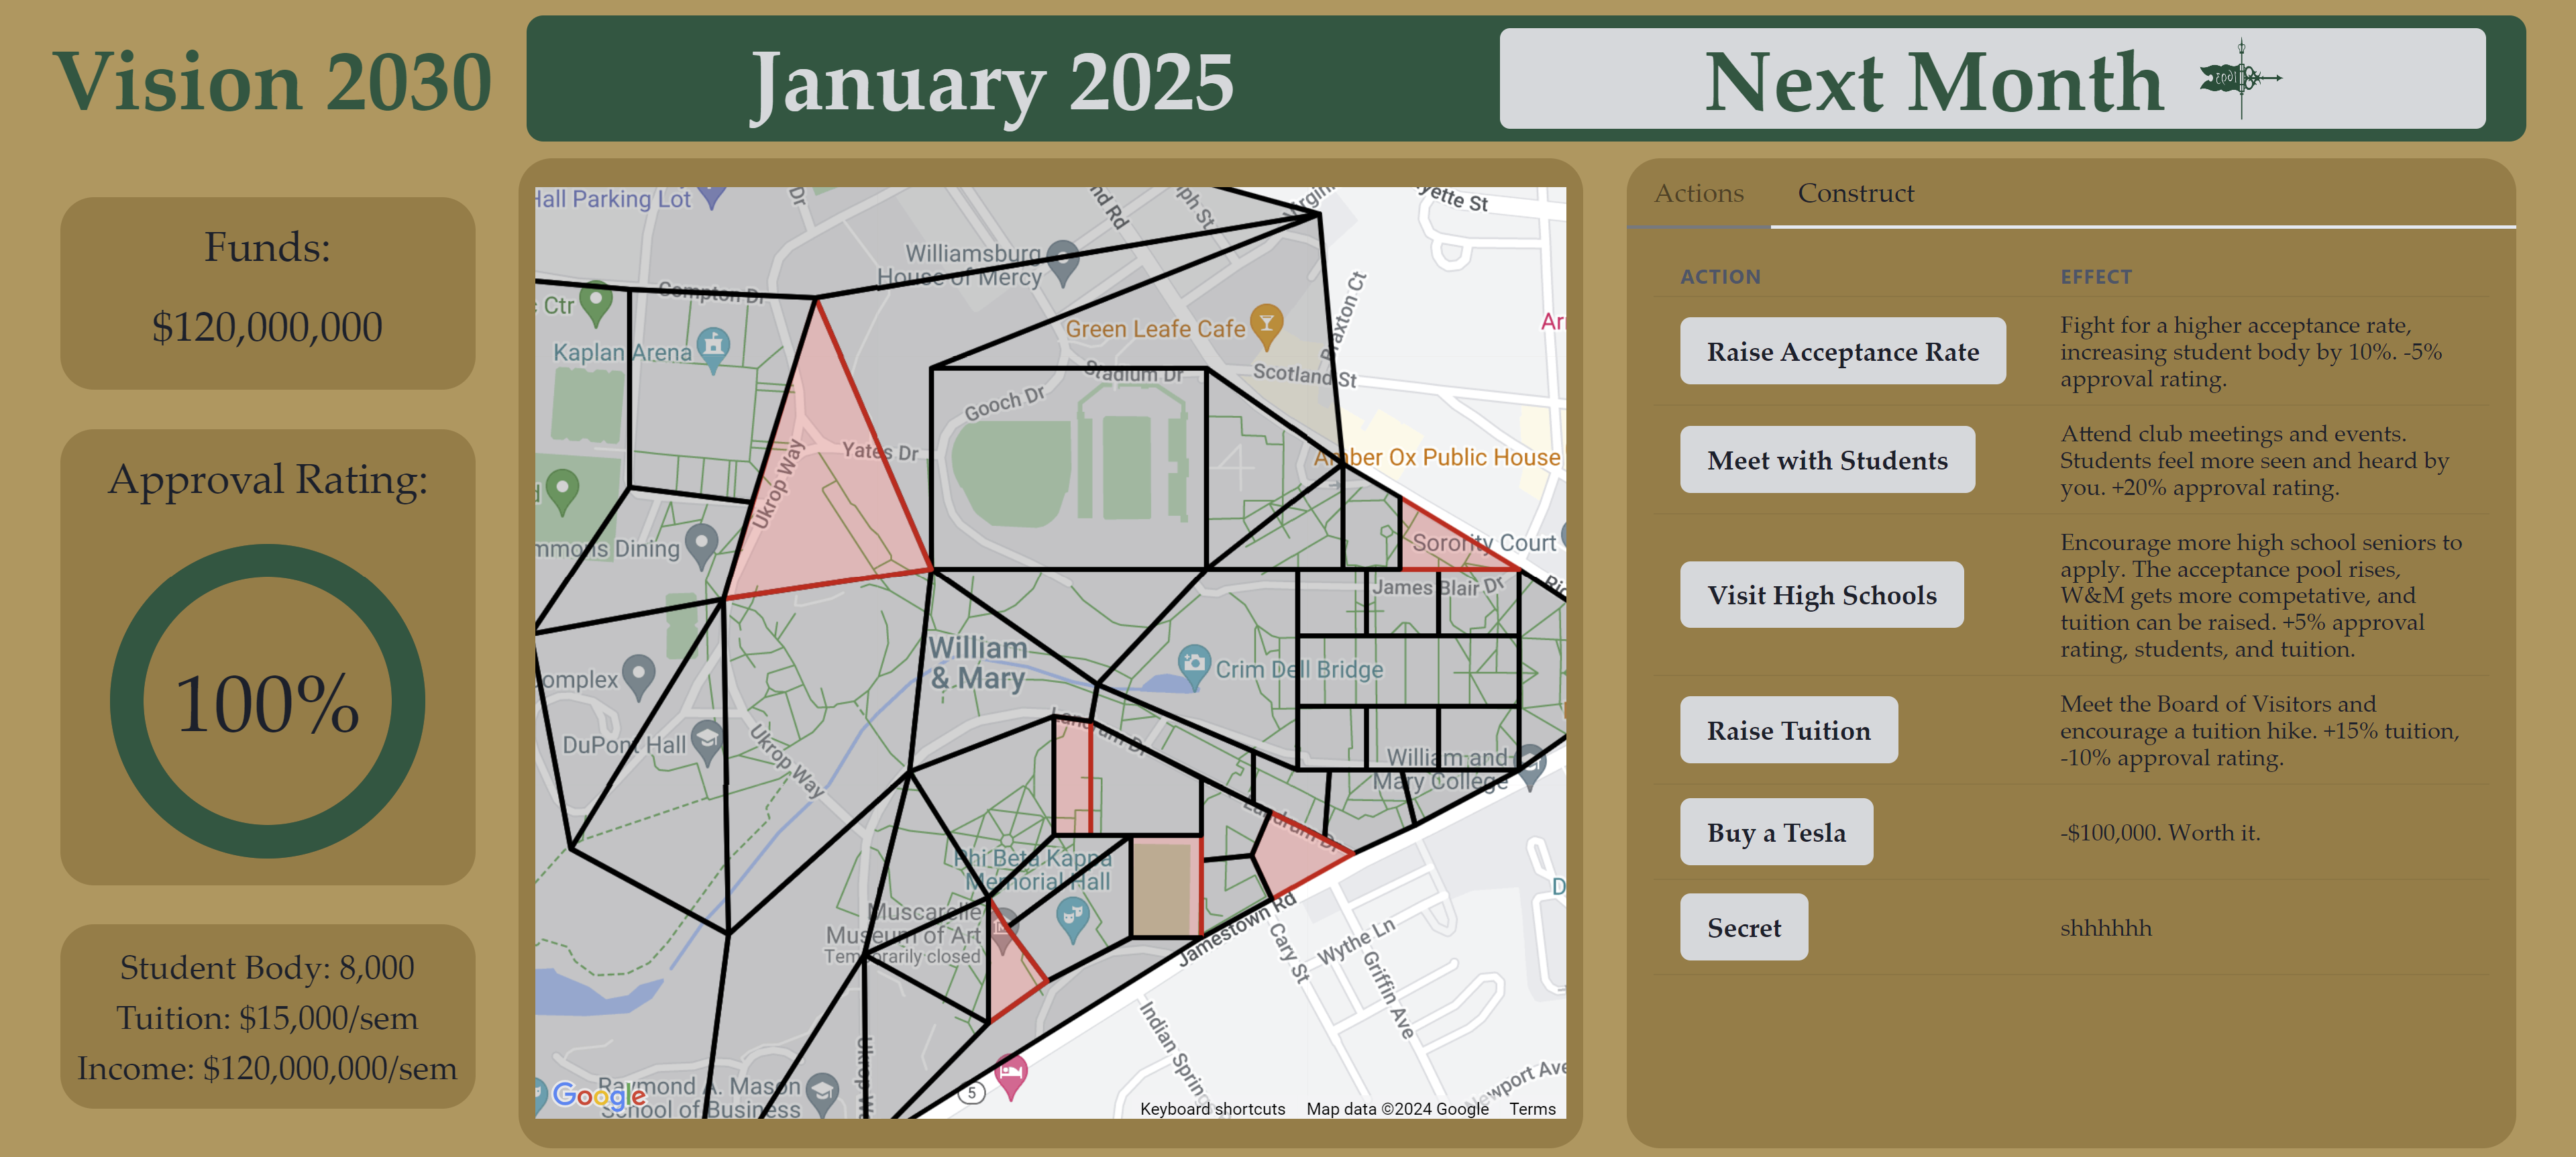
Beginning Screen
-
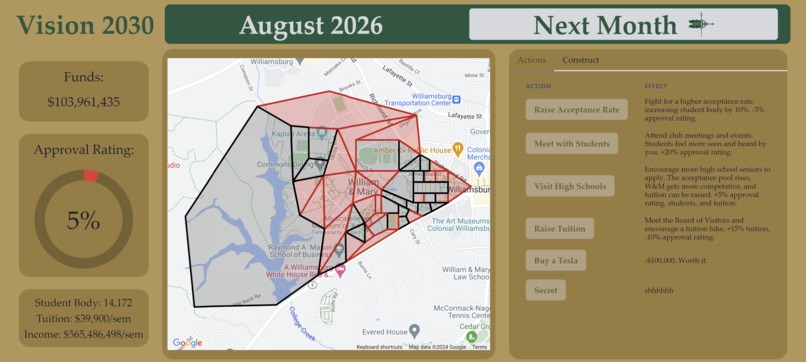
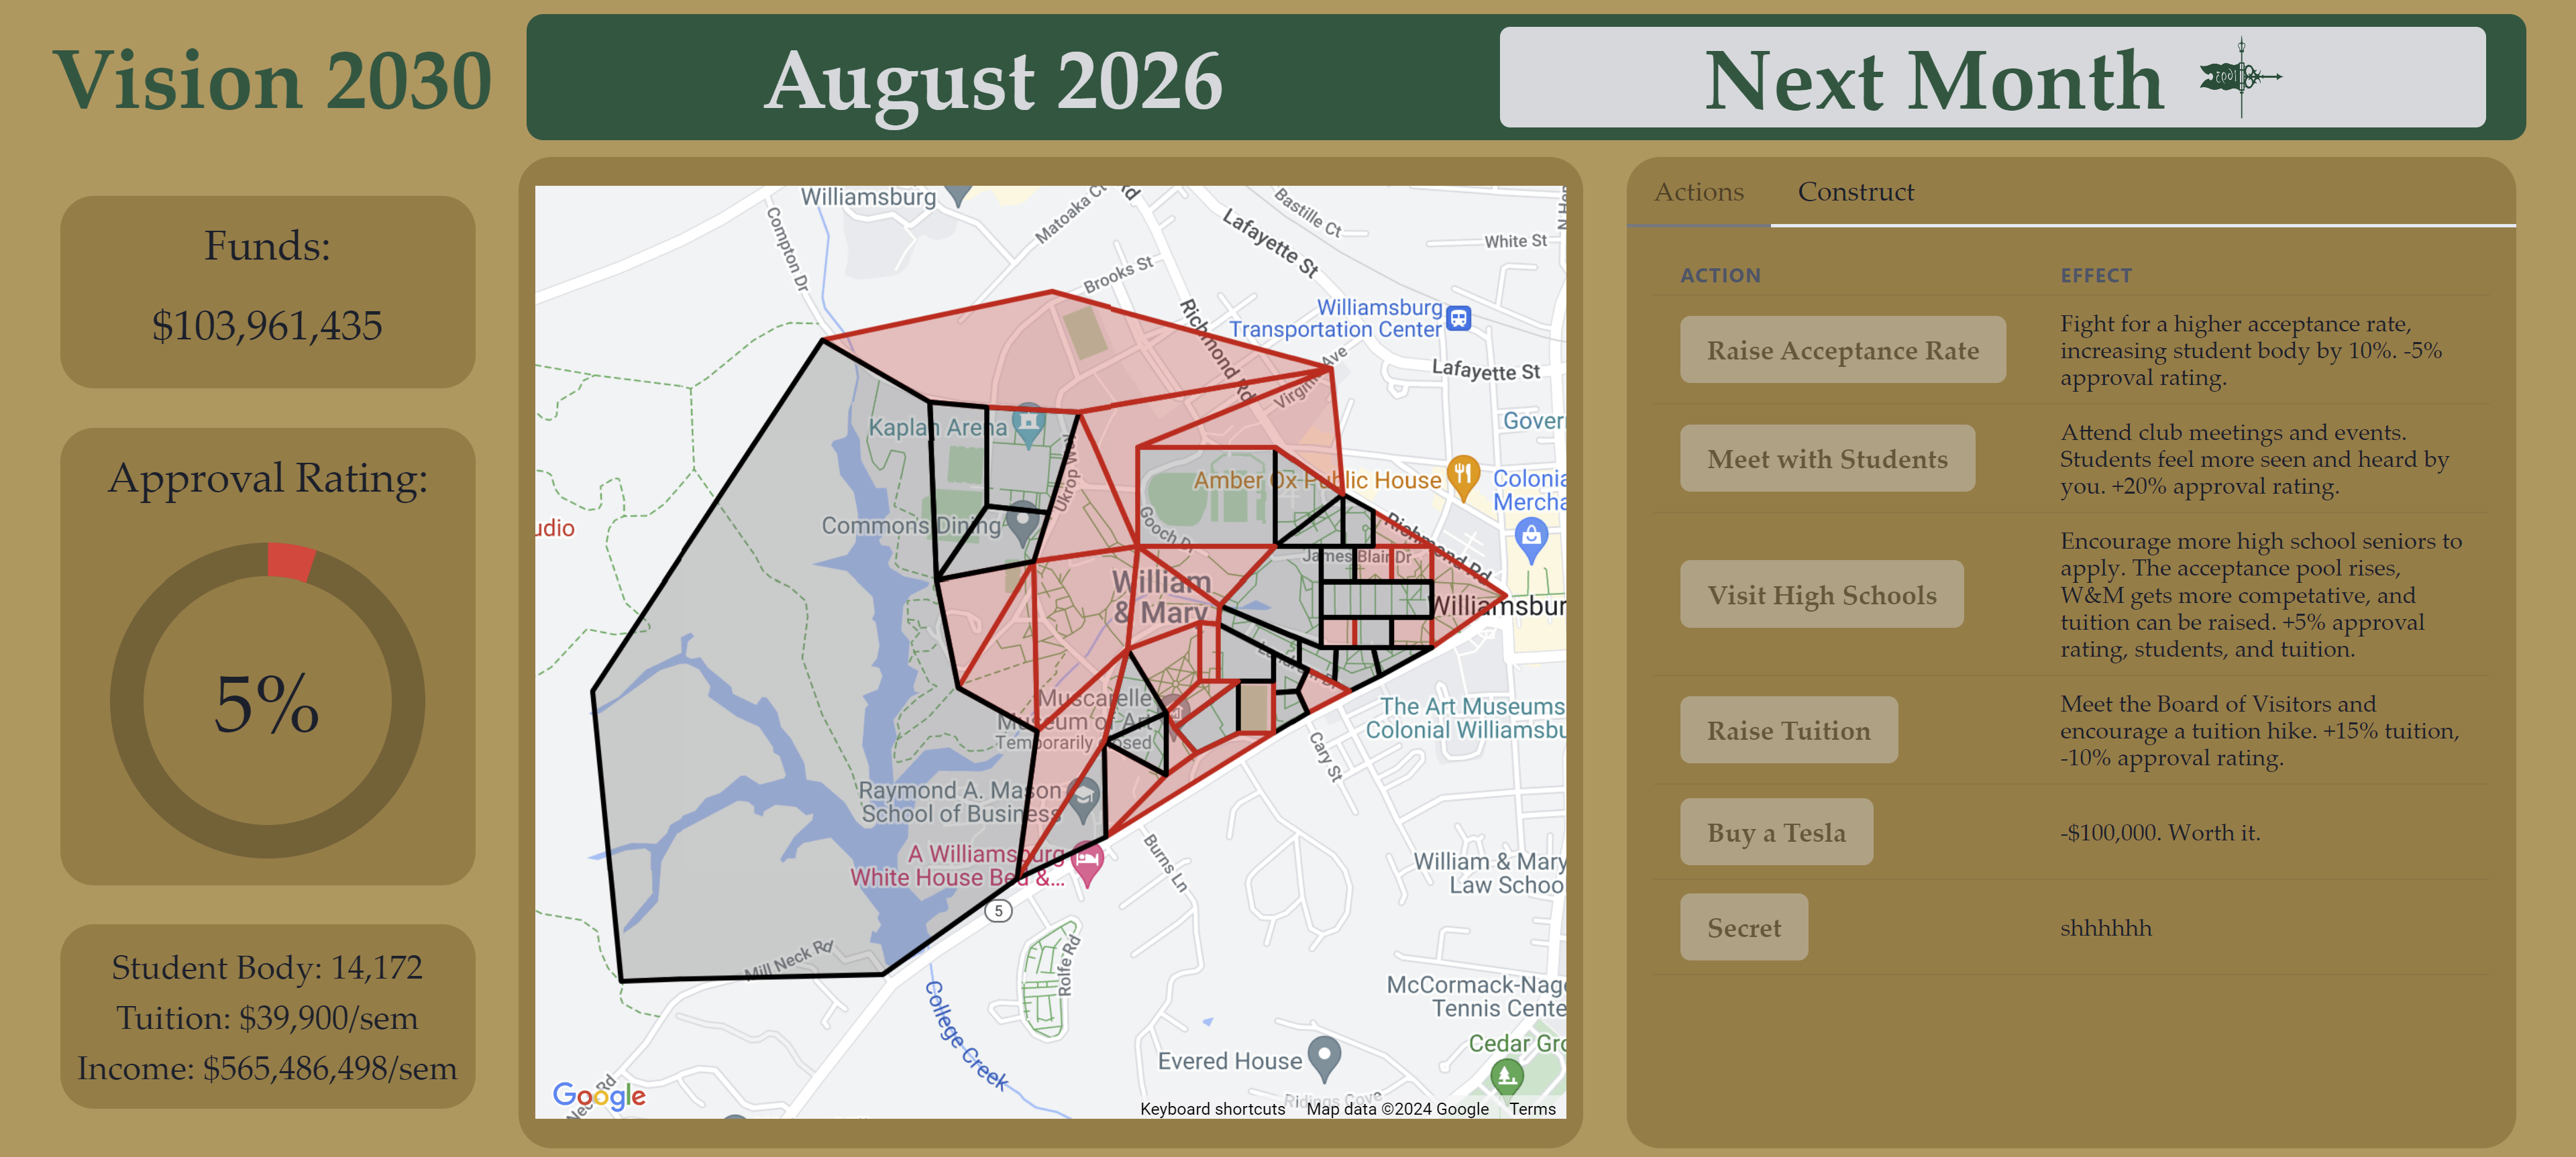
In-Game
-
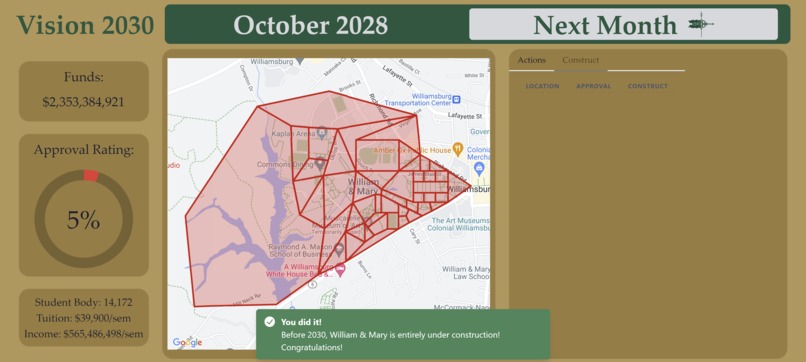
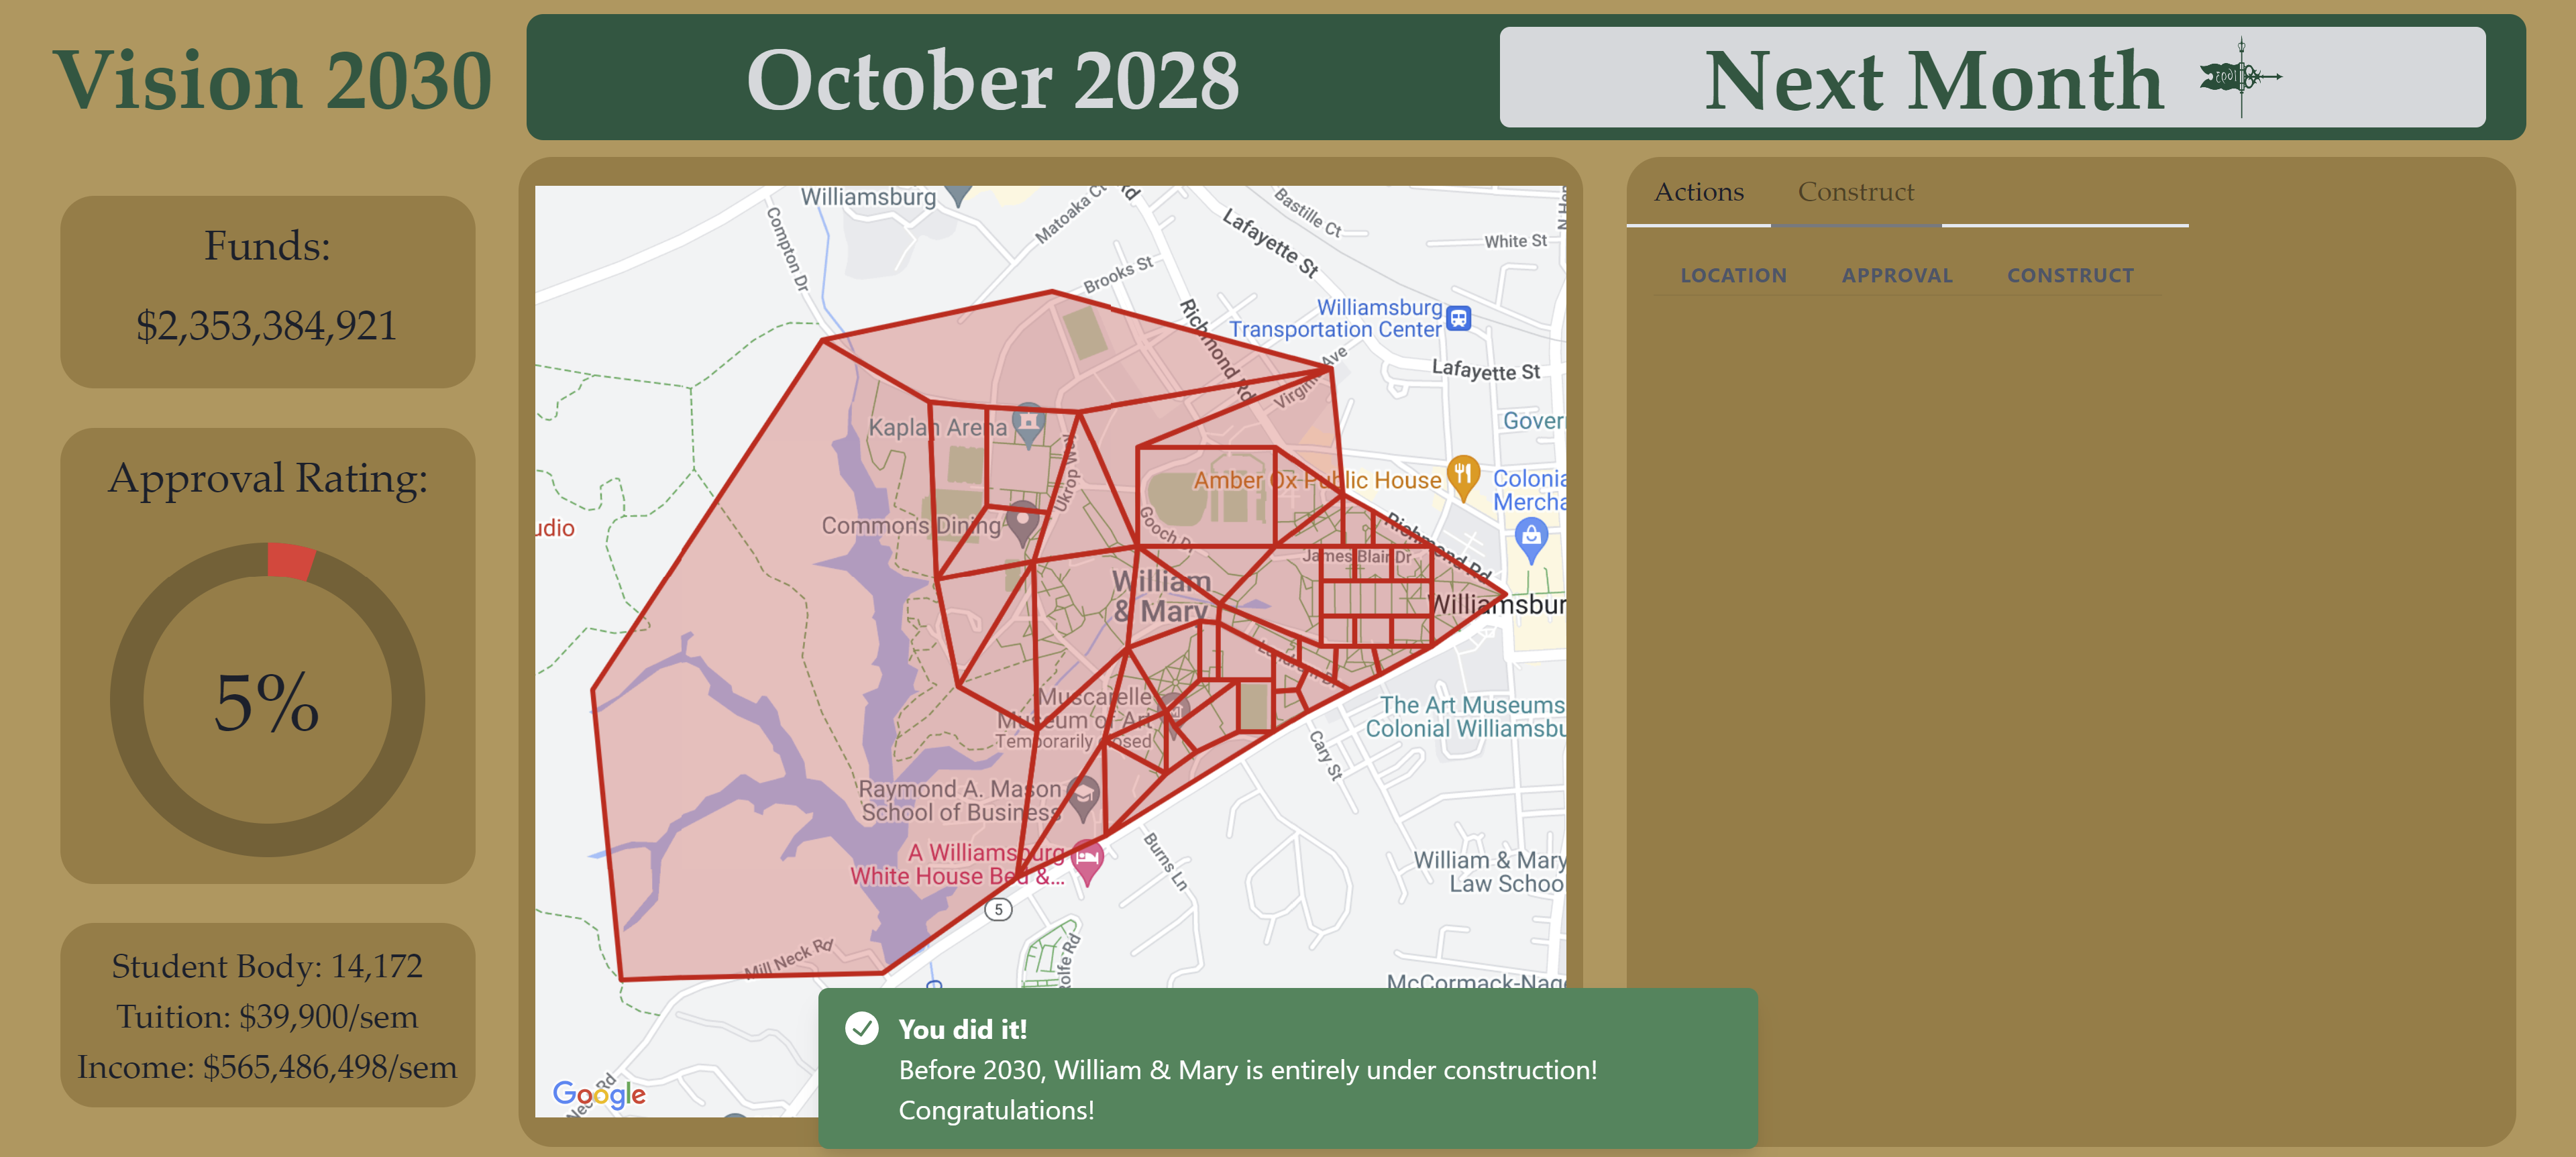
Win Screen
-
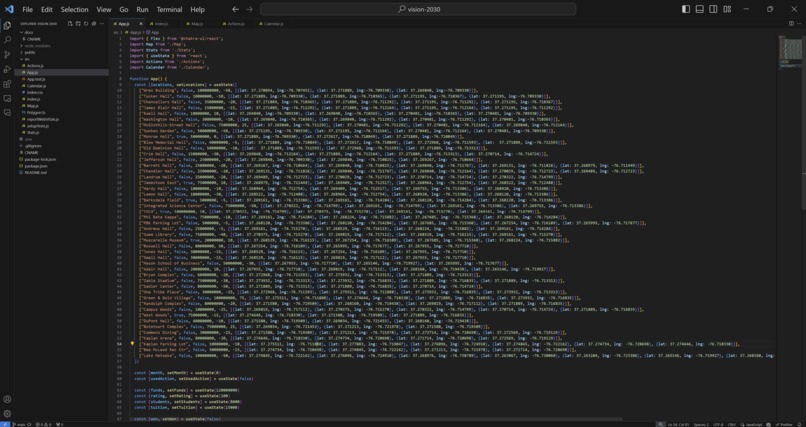
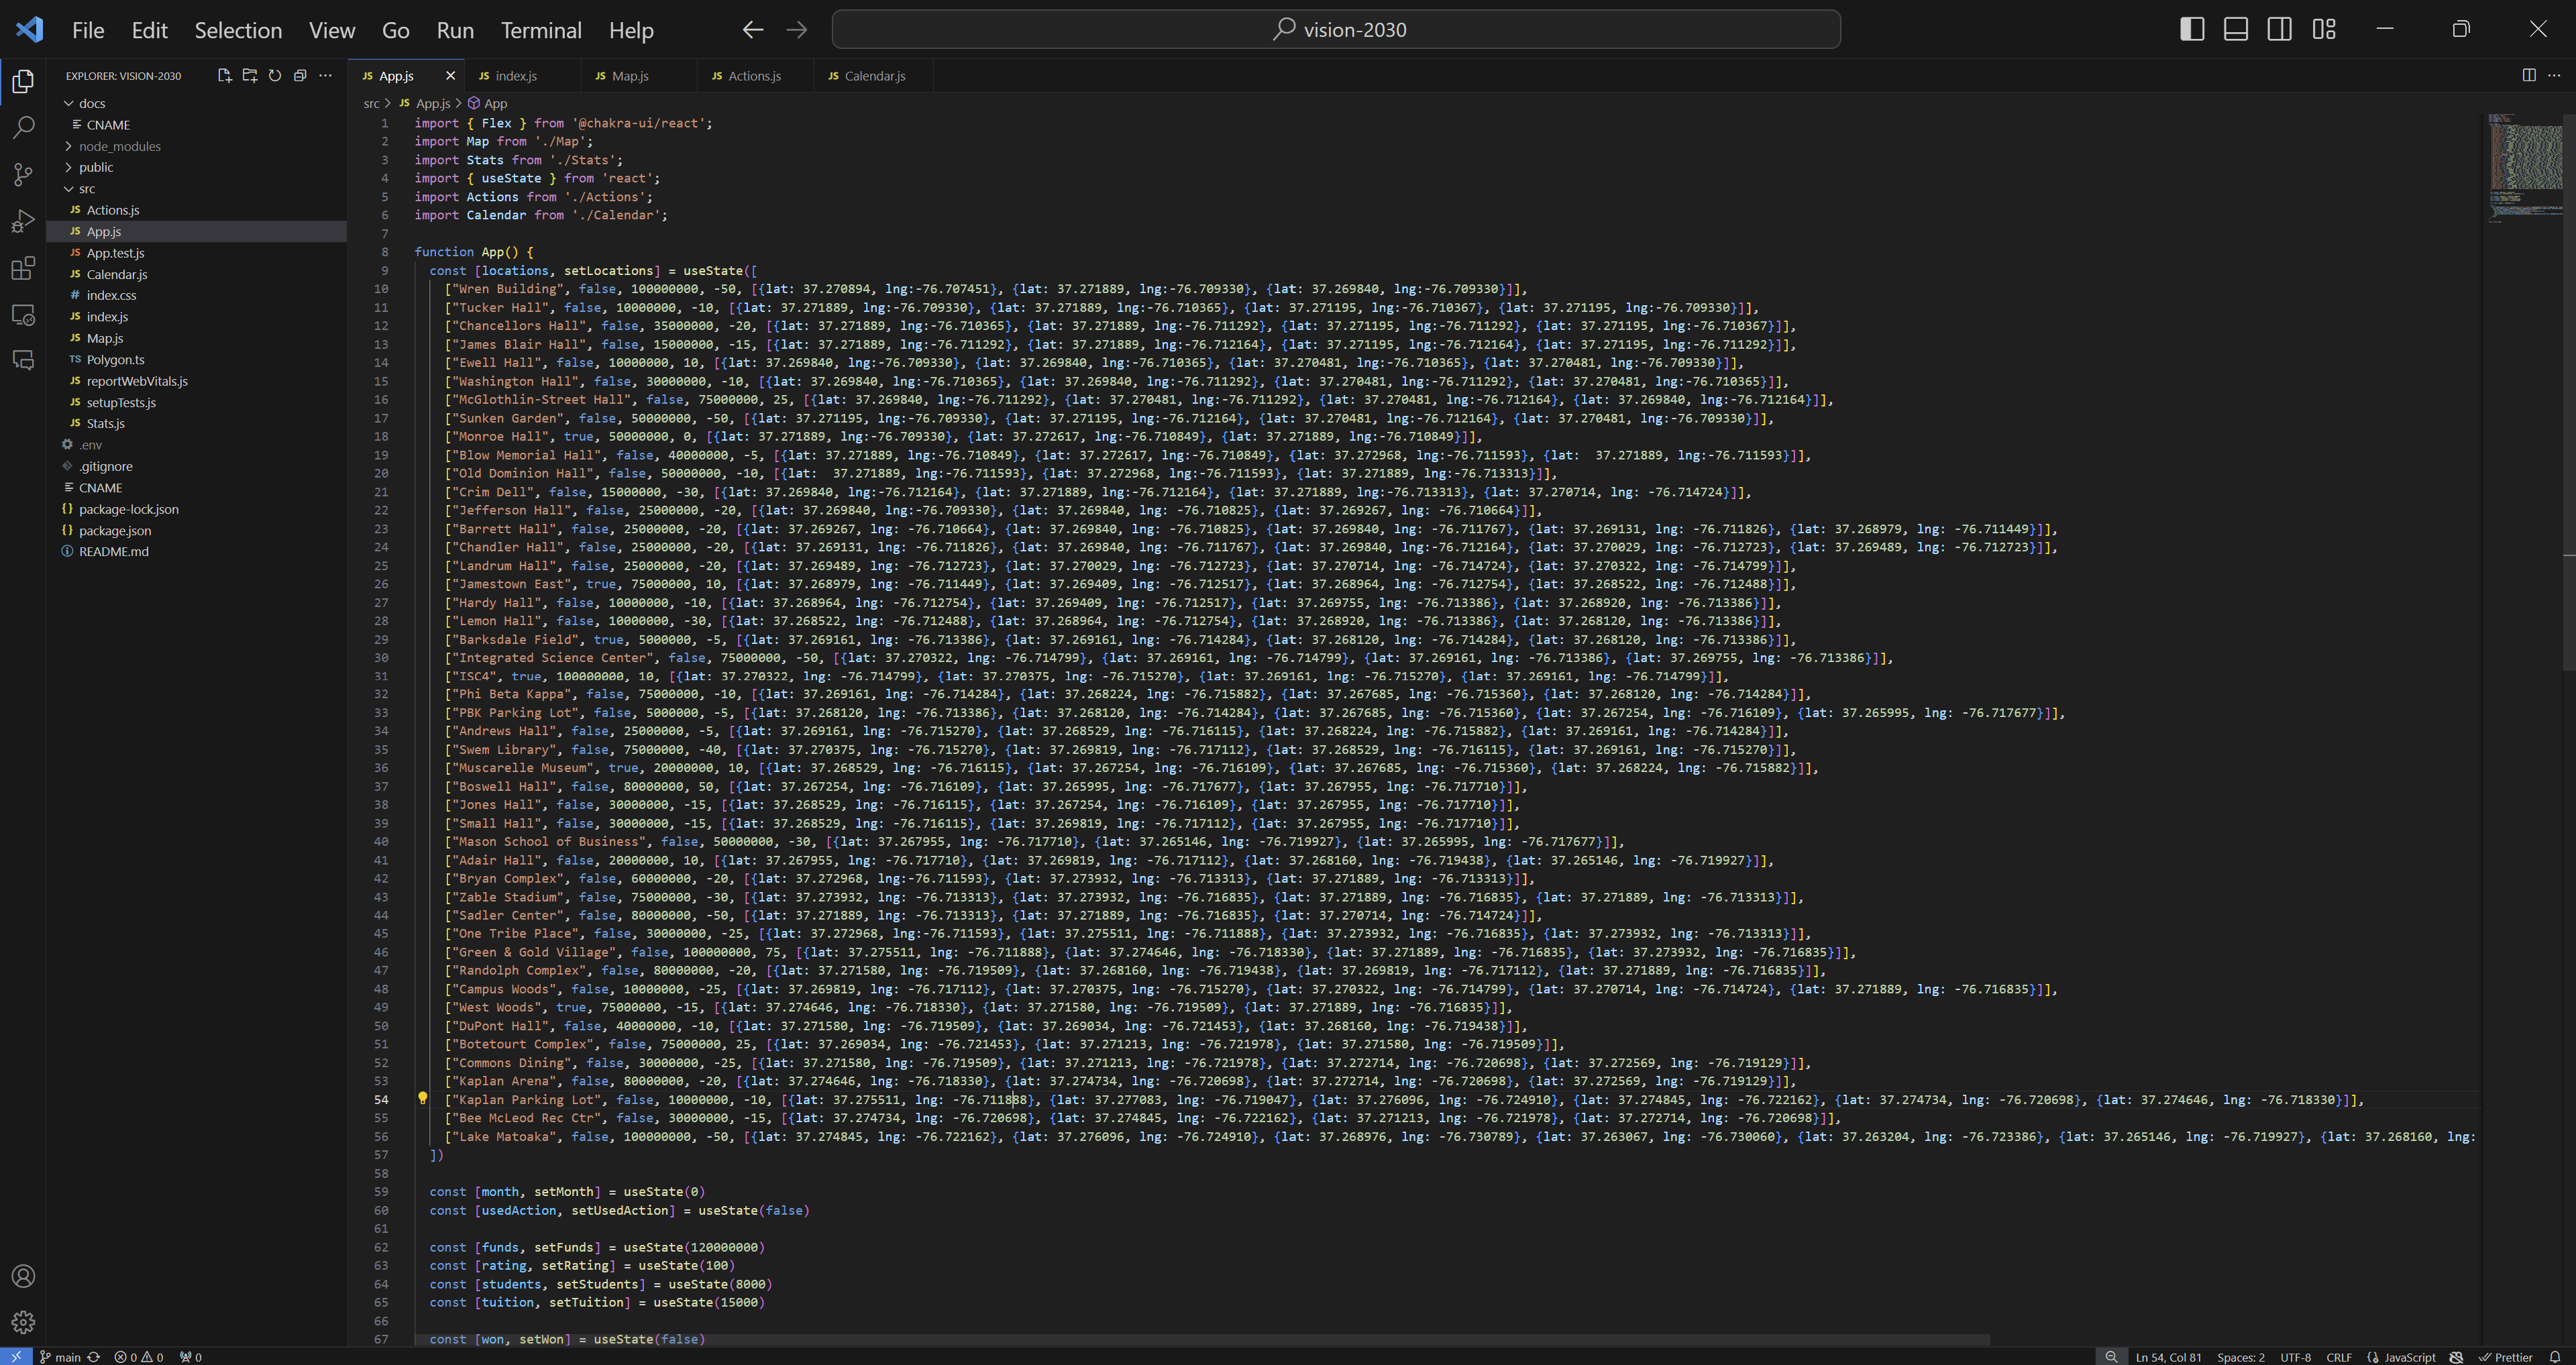
Coordinates :)
Inspiration
More and more, students at William & Mary complain about the increasing amount of construction around campus. A few years ago, the College introduced Vision 2026: a plan to renovate the campus in five years. However, we're more than halfway through that plan, and seemingly all we've gotten is construction. So, Vision 2030 takes that idea to the extreme as you act to put every location on campus under construction in five years.
What it does
In Vision 2030, you have all the tools you need to turn William & Mary into a giant construction zone. On the left, you can see different statistics like your funds, approval rating, and income (the size of your student body times the tuition each pays, per semester). The middle panel features an interactive map that shows you active construction sites and sites that are yet to be construction sites. You can pan, zoom in and out, and click on each site to see more info. On the right, you have a panel with two tabs - the first displays a list of actions you can take to raise funds, approval rating, tuition, etc., and the second displays a list of all potential construction sites and a button to put them under construction. The top panel shows you the current month and a button to advance to the next month.
Each month, you can put as many sites under construction as you wish, but you can only take one action. If you don't have enough funds or your approval rating would dip below 0%, you won't be allowed to construct. At the start of each semester, you earn funds based on your income. If you can put every location under construction by January, 2030, you win! If not - you can always take more time.
How I built it
This project was made with React with Chakra UI as well as the Google Maps API. It was programmed in JavaScript and with CSS. Starting with the React app, I integrated Google Maps via an API Key and added Chakra in the later stages. All of the locations shown on the map are hand-typed polygons, each with 3 or more coordinates.
Challenges I ran into
It took a very long time to implement the Google Maps map into the application, and I was much farther behind than I thought I would be around the halfway point. I also had some unusual problems with Chakra and TypeScript, which I've worked with before, but for some reason couldn't install as easily.
Accomplishments that I'm proud of
Once I got everything installed and running, I feel that I pulled it all together very nicely! This is the first time I've used Google Maps in an application or done anything GIS-related, in fact I wasn't even planning on it. The initial plan had everything on top of a blank map of campus, but all the maps I found were too crowded, so I decided to take a leap with Google Maps and it worked out (after only like 6 hours)!
What I learned
It's definitely a challenge to hop feet first into Google for Developers or any other massive codebase, but it's very rewarding in how powerful those components can be. Using Google Maps took a lot of time but it was definitely worth it; my initial vision with a static map could not have worked as well as the API implementation did.
What's next for Vision 2030
I really want to add events that happen based on the month and year, such as One Tribe One Day for a funds boost or Homecoming for a boost in approval rating. I also think it would be interesting to limit the hit to approval rating for construction based on the time of year, since students wouldn't be around to see it in the summer months, for example. Immediately, I want to host this on a website using GitHub pages, and I'm hoping to do that within a few hours of the hackathon.


Log in or sign up for Devpost to join the conversation.