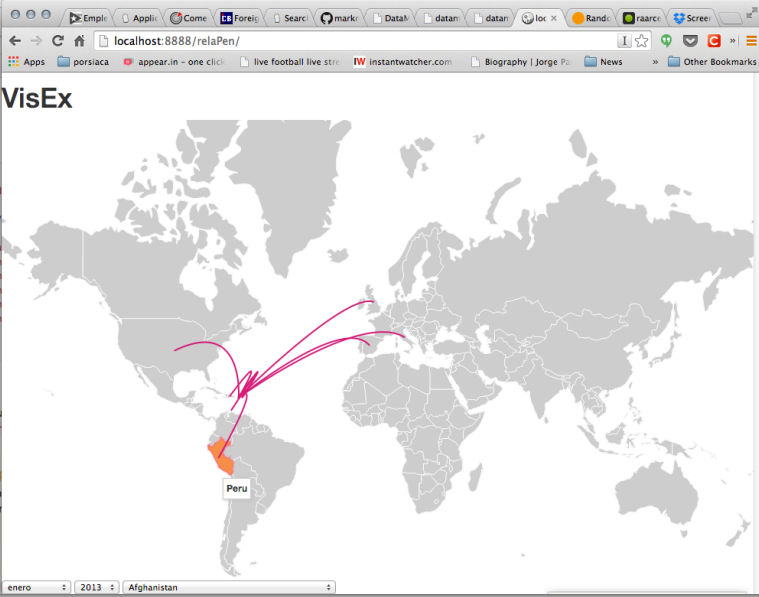
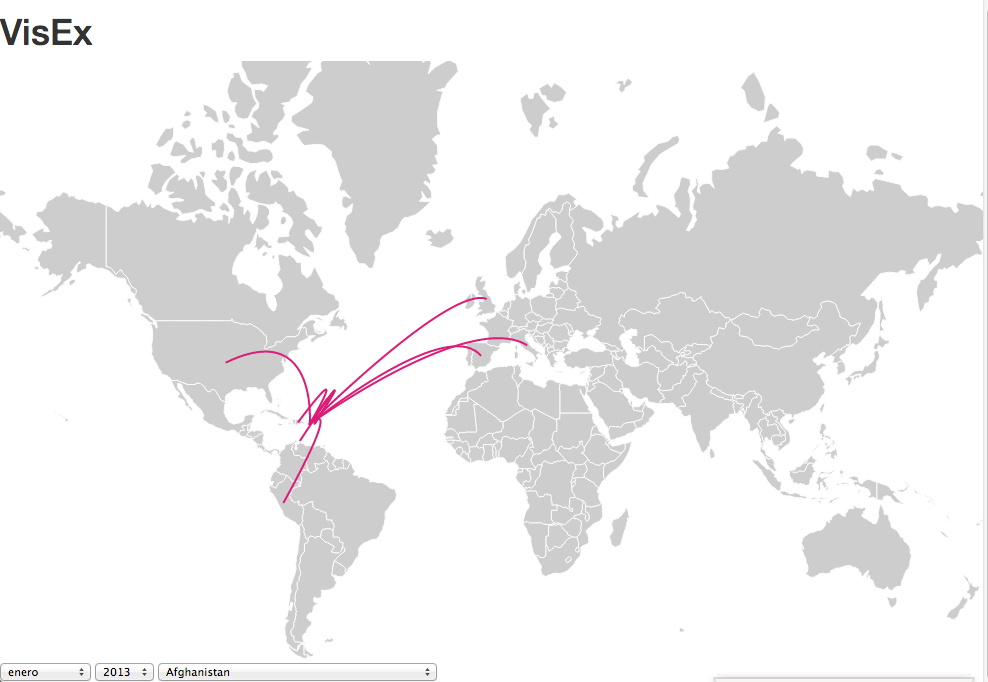
Made our first steps in a visualization that draws arcs from Puerto Rico to the 10 countries where exports were more productive. This is according to the amount of money earned on exports. The user can choose one month and year and the application will draw the arcs and paint the countries in a gradient based on the money earned.
This work is currently under construction.

Log in or sign up for Devpost to join the conversation.