-

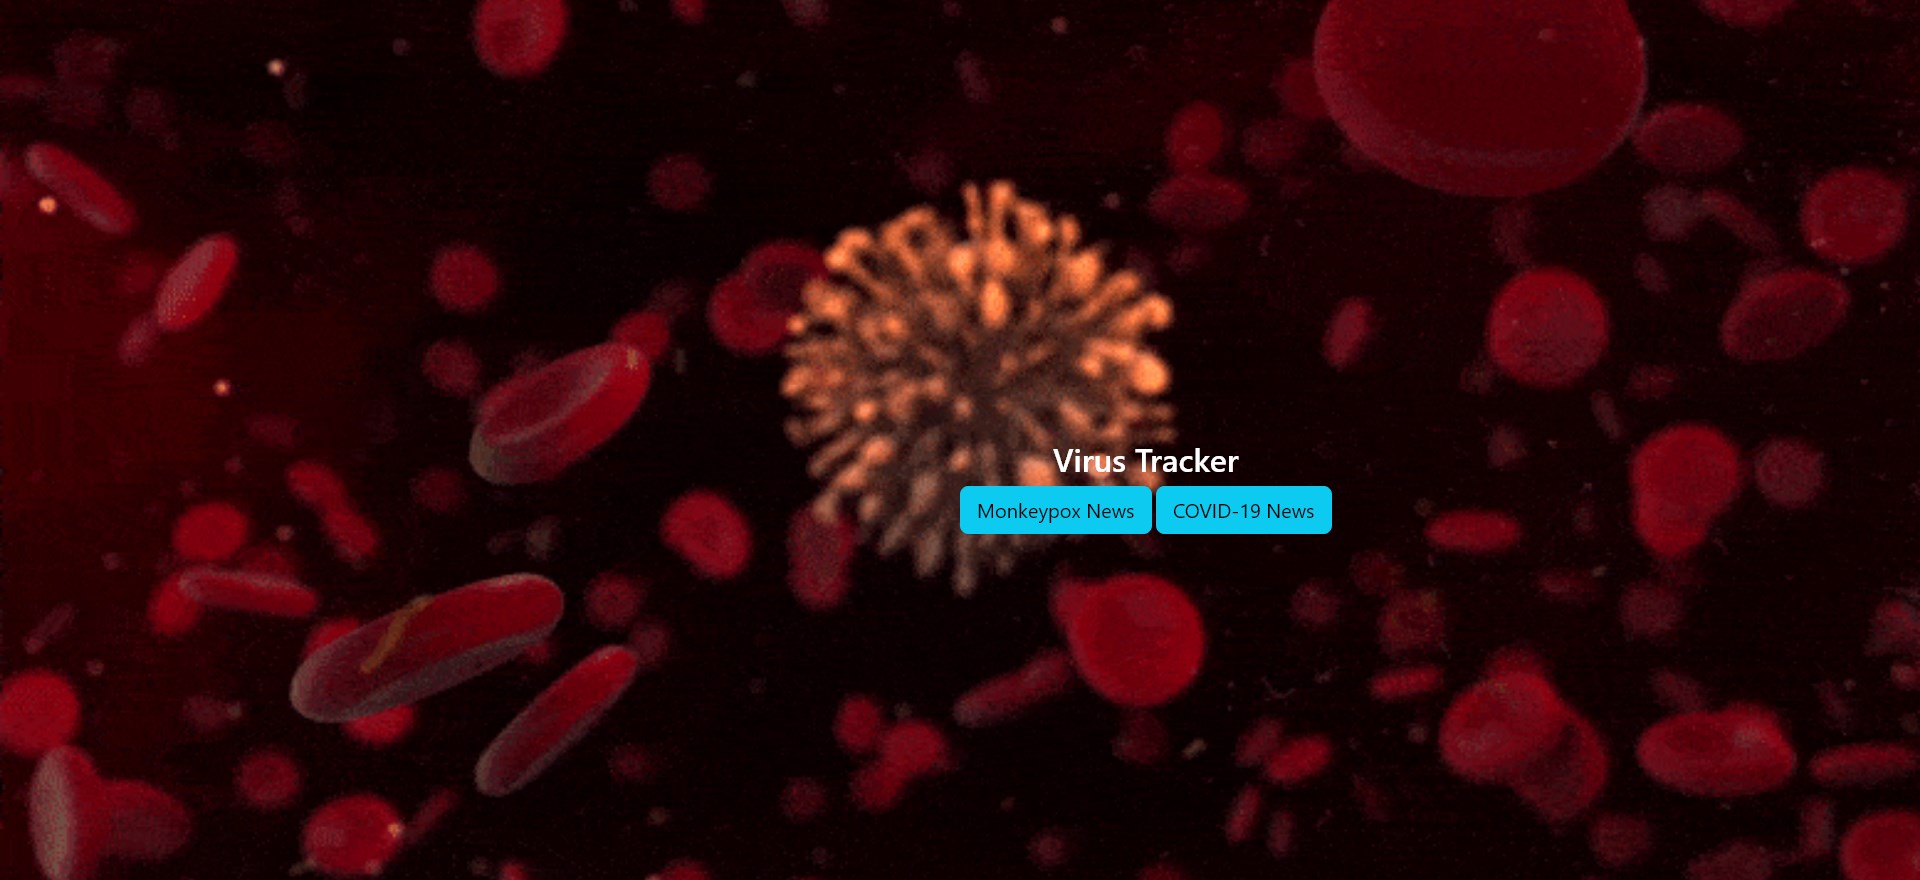
Home Page
-

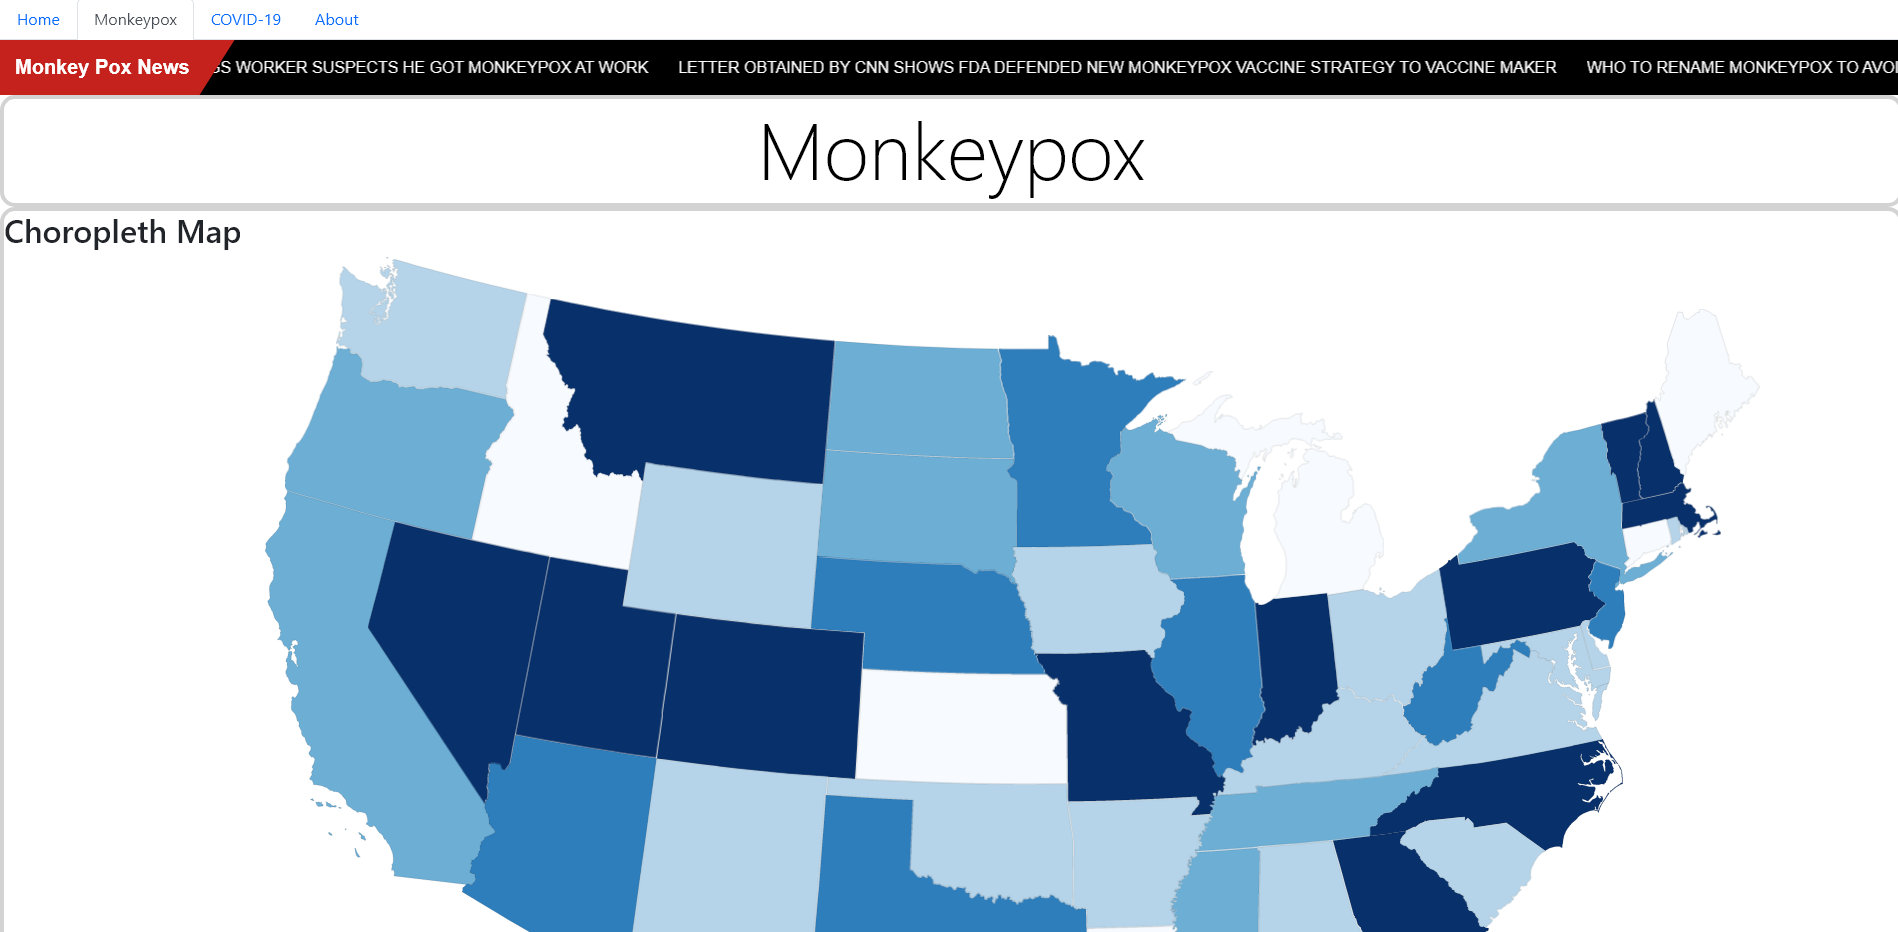
Monkeypox Info Page 1
-
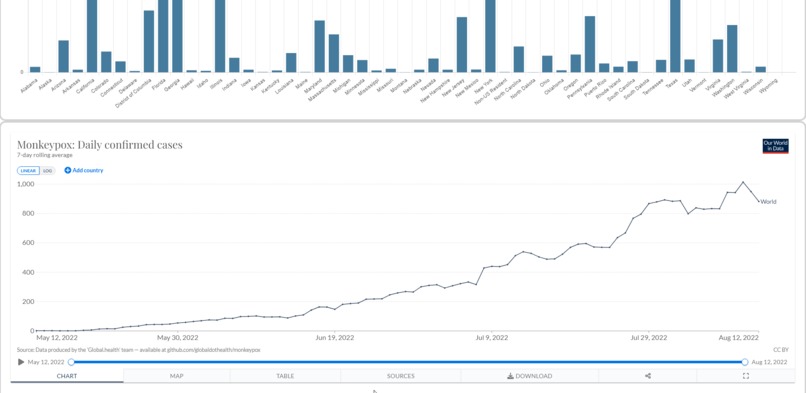
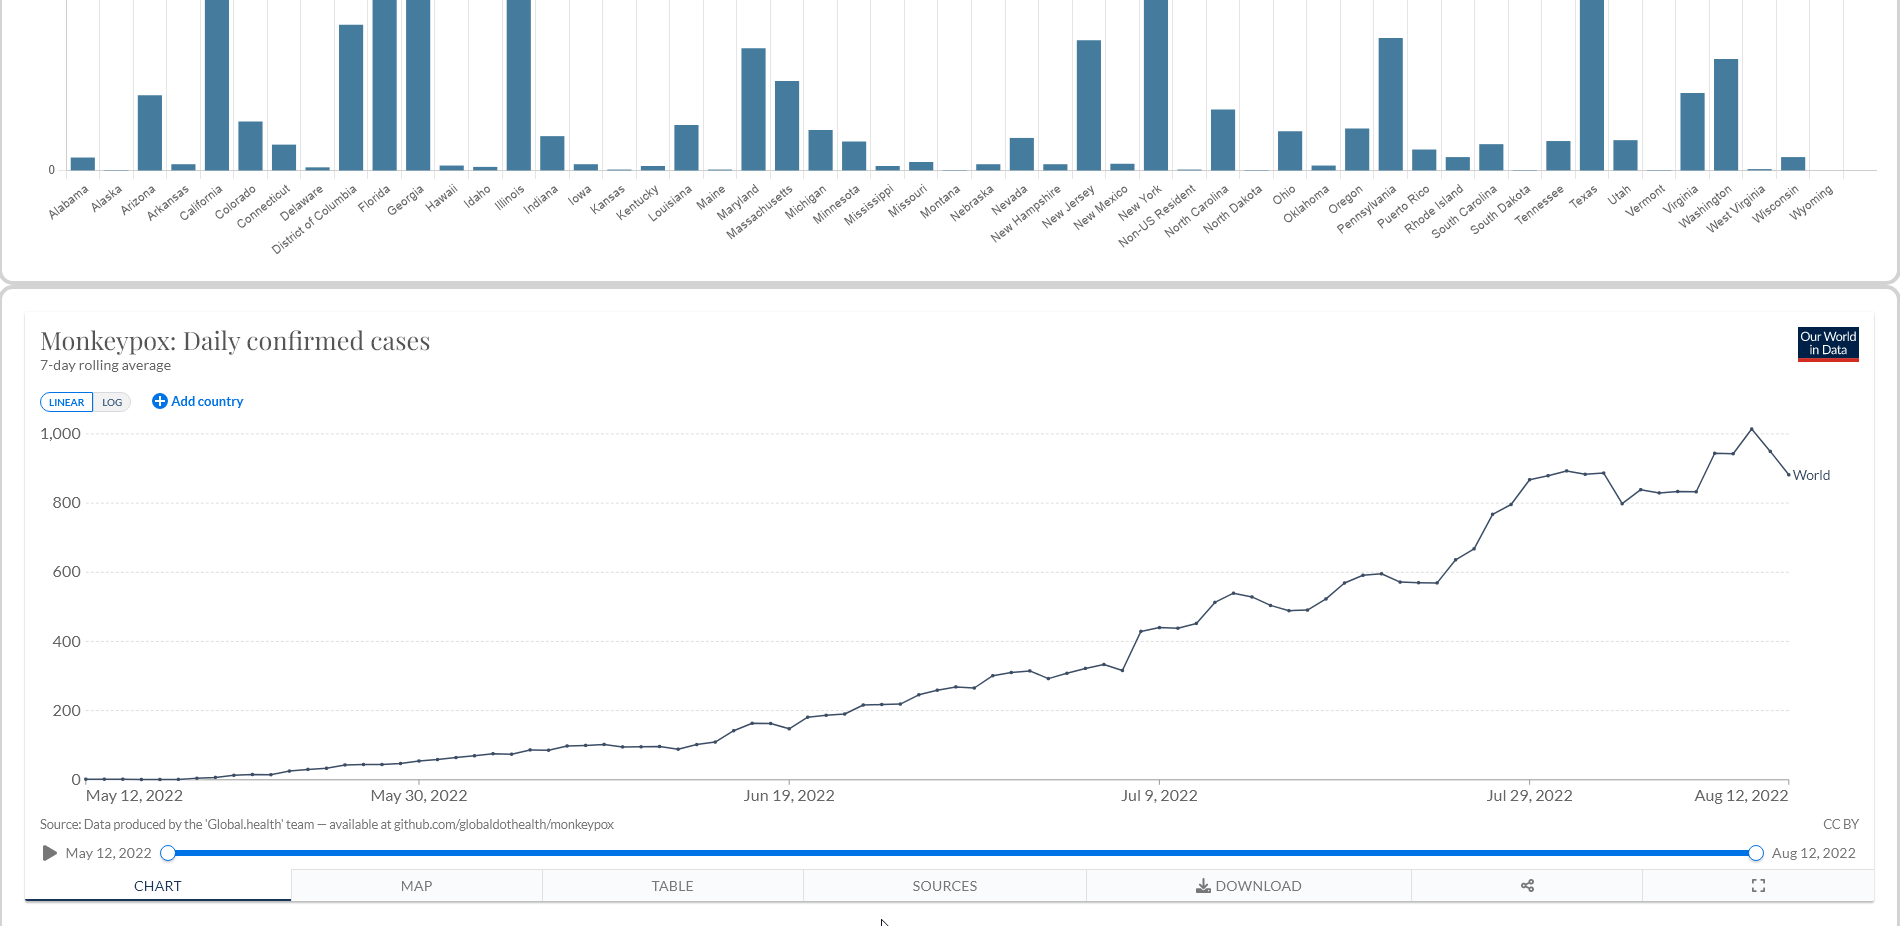
Monkeypox Info Page 2 Graphs
-
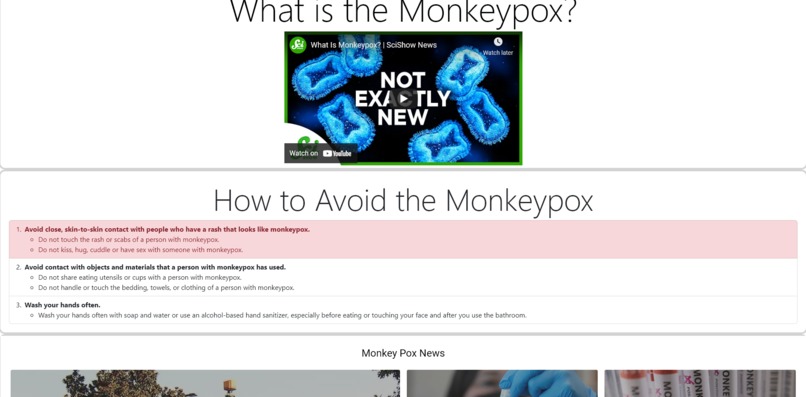
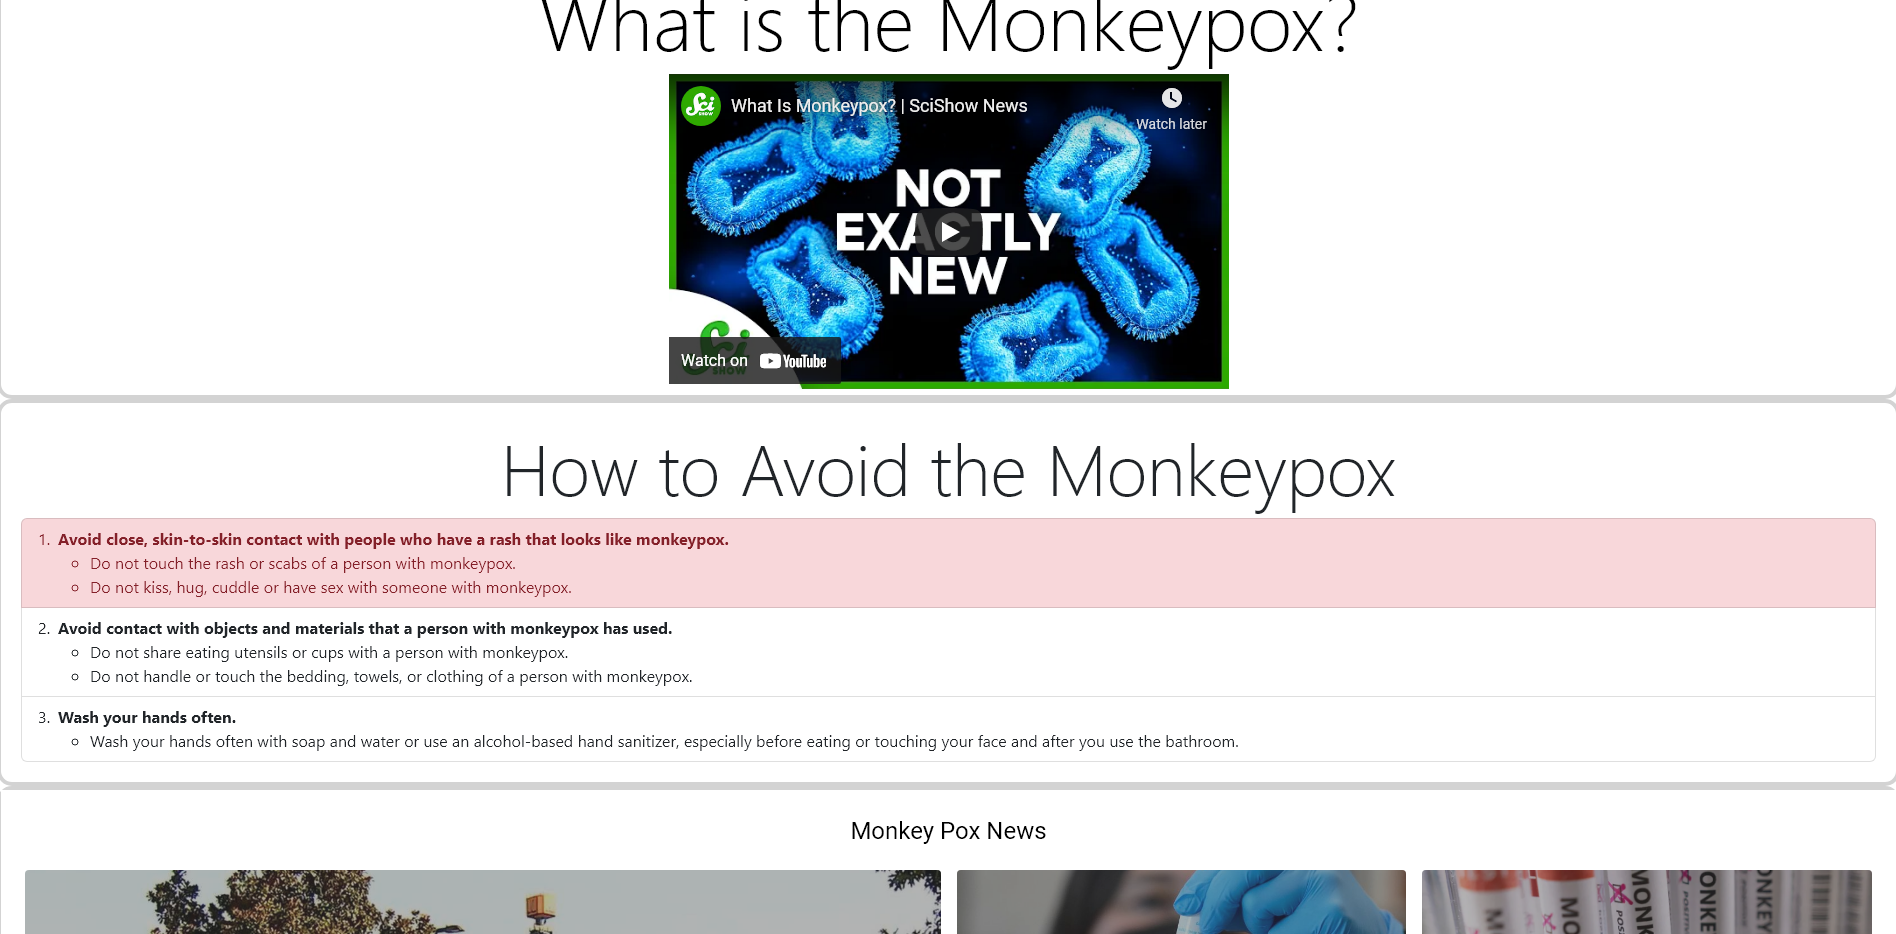
Monkeypox Info Page 3 Guide
-
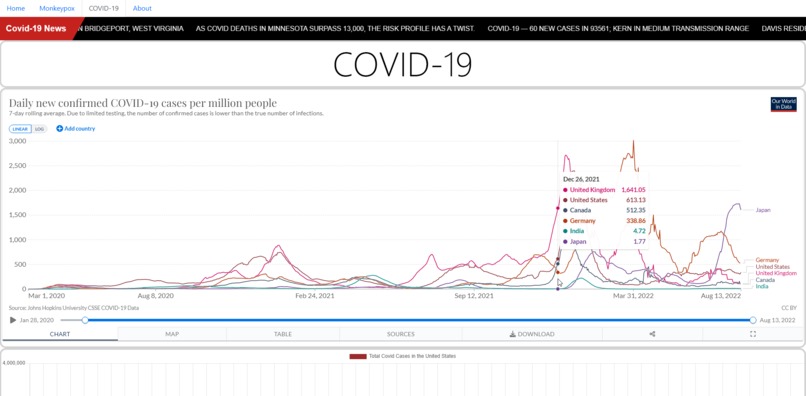
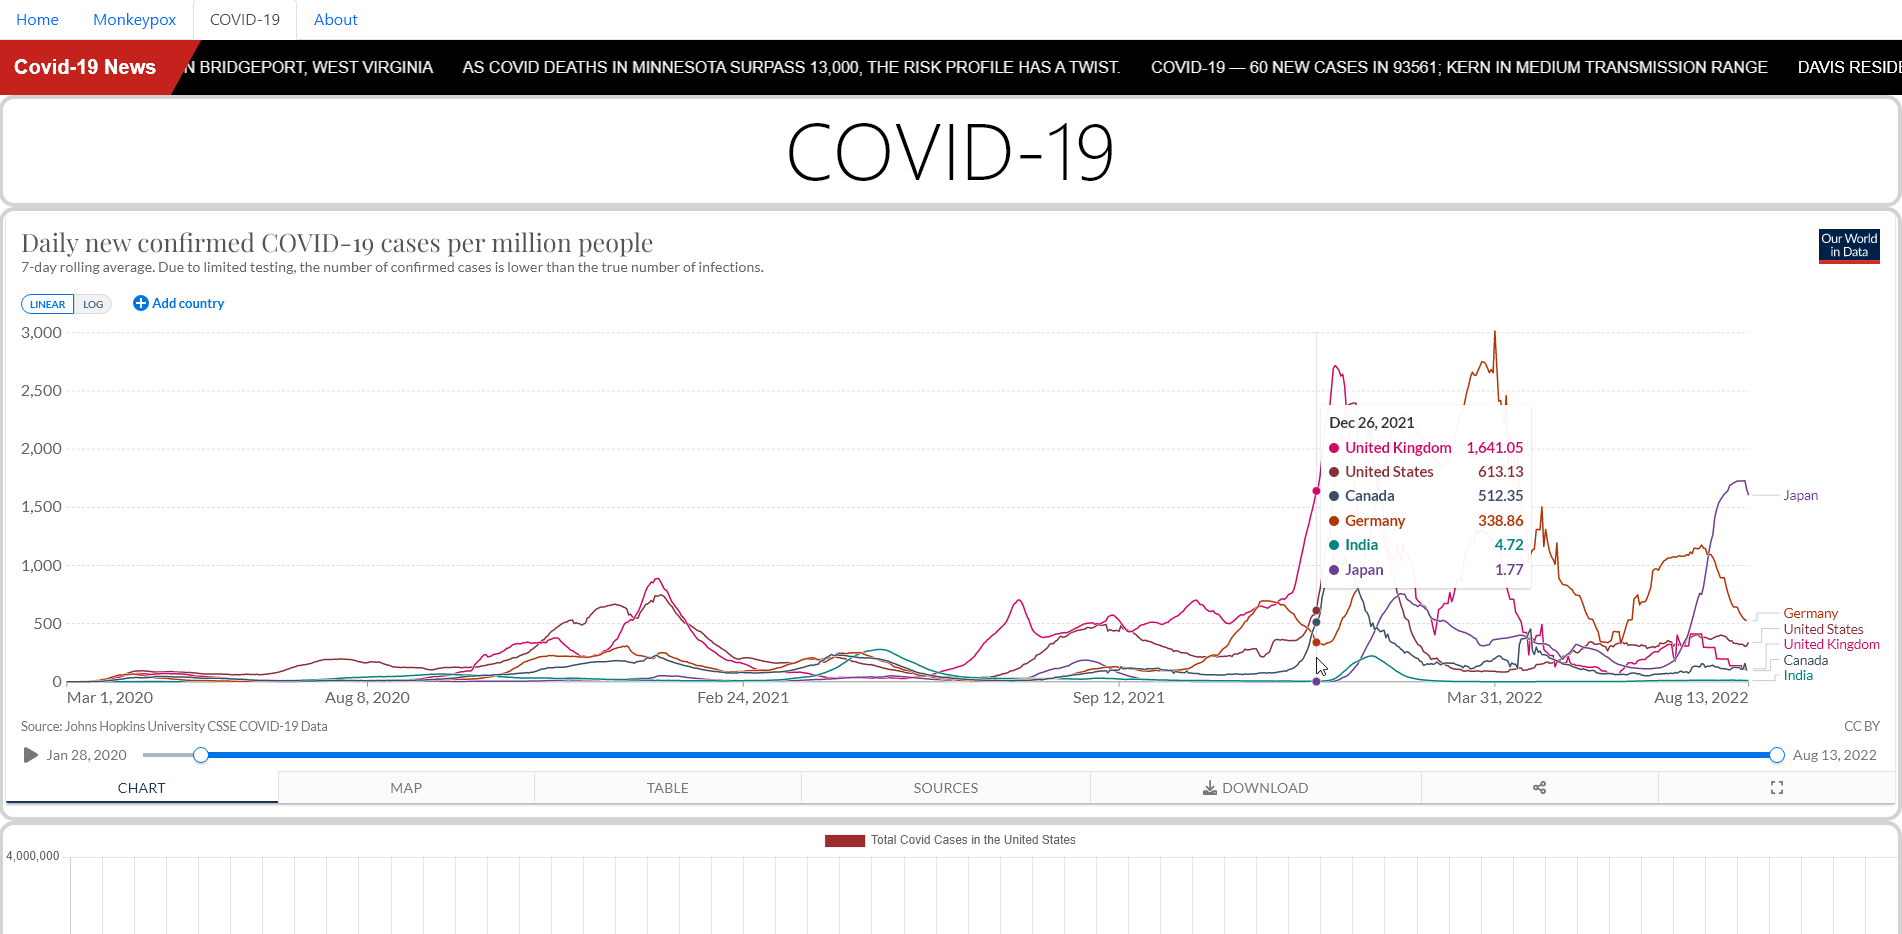
Covid-19 Info Page 1 Graph
-
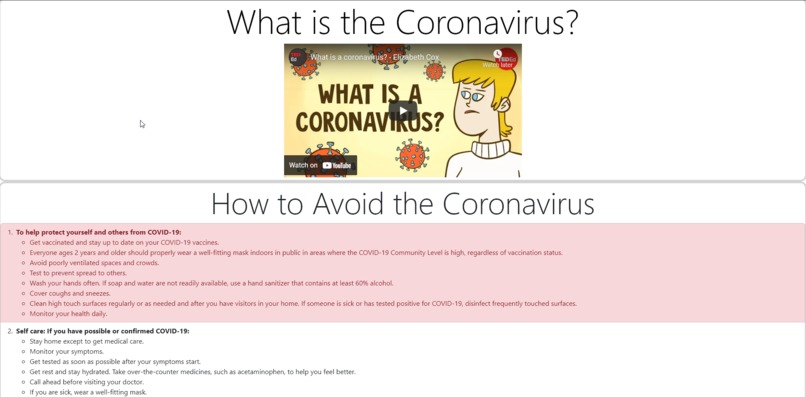
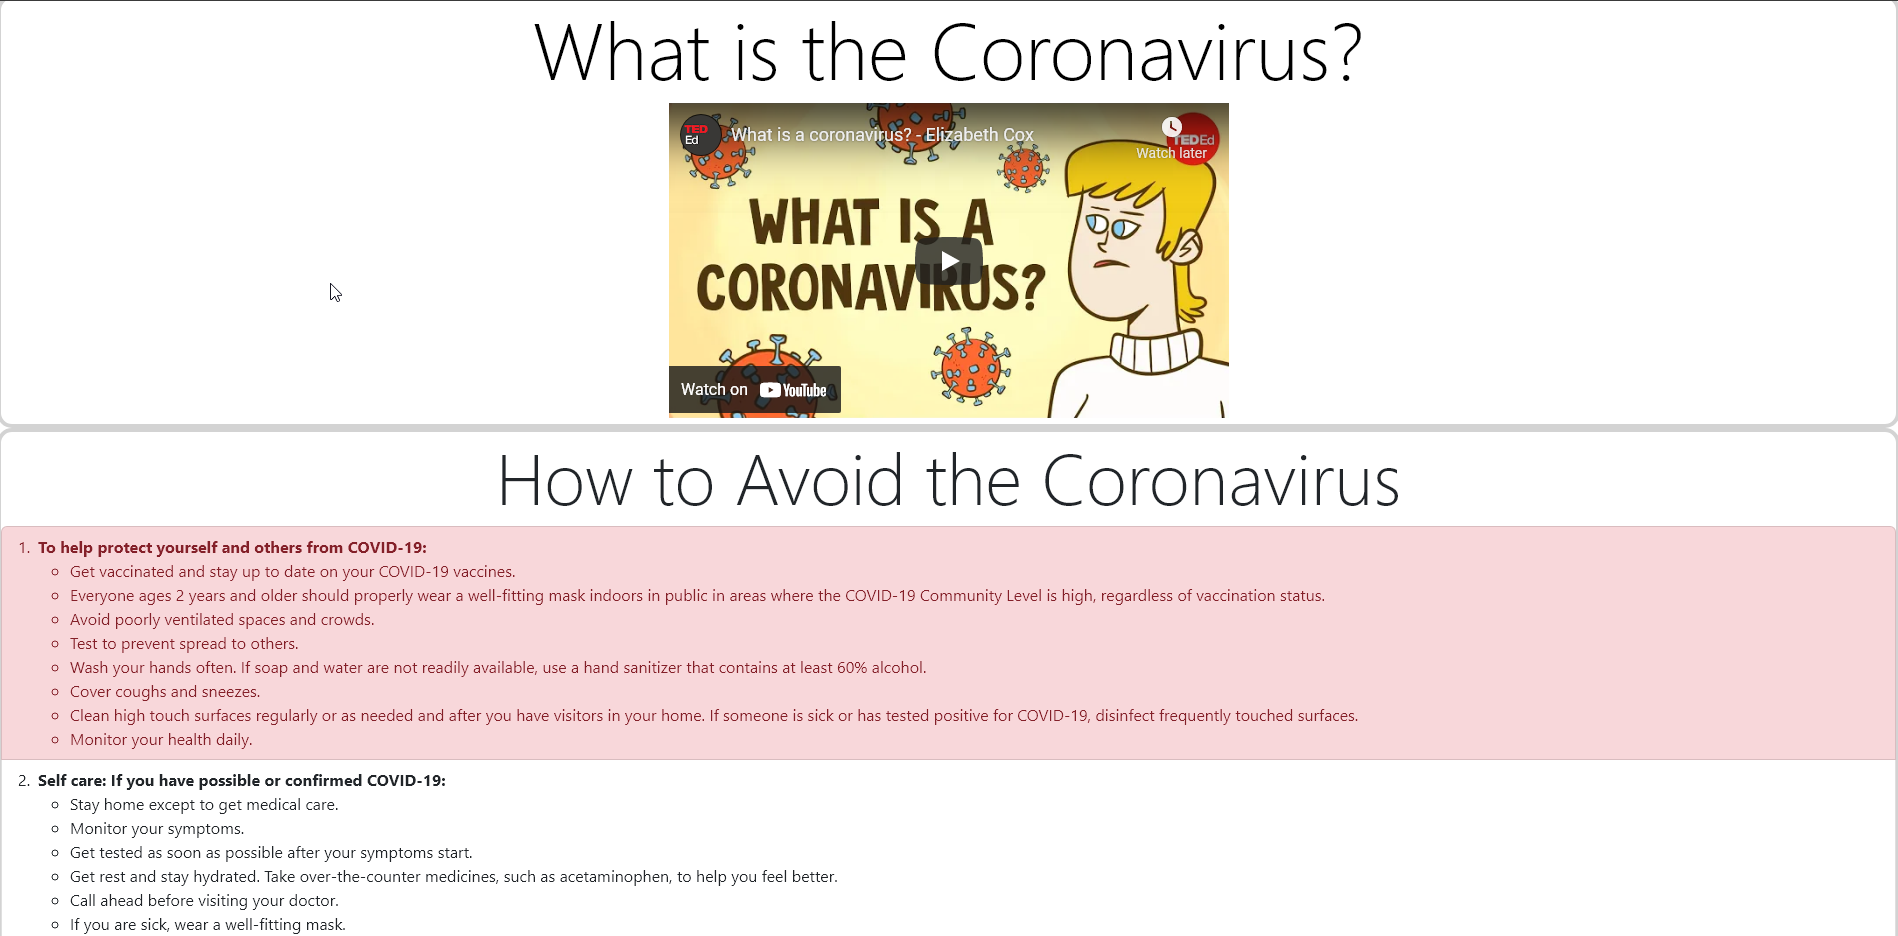
Covid-19 Info Page 2 Guide
-
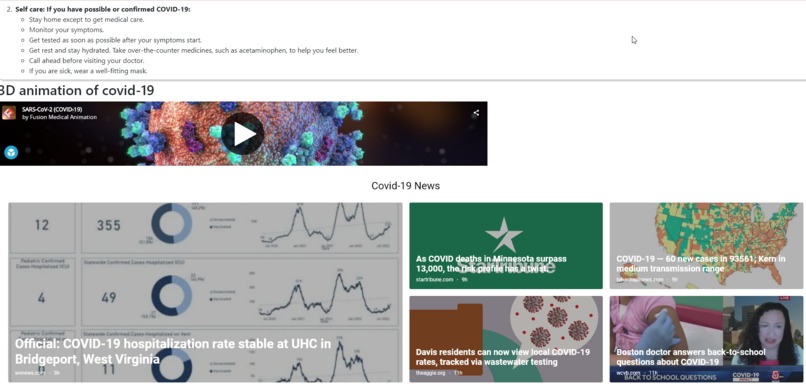
Covid-19 Info Page 3 3D animation and News page
-
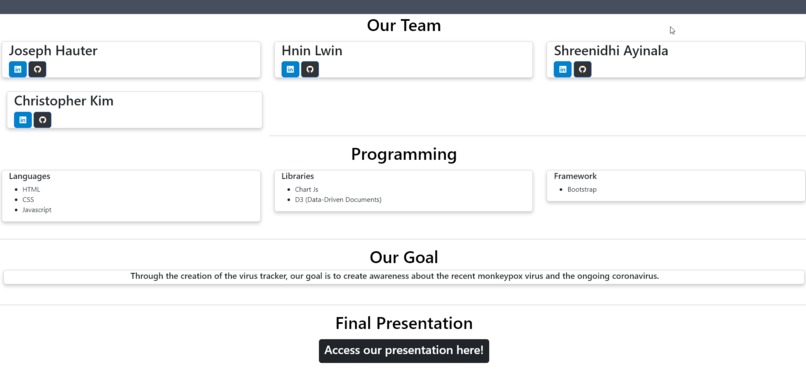
About Page

Inspiration💡
Many institutions are raising concerns about the recent outbreak of the monkeypox virus. To make the process of spreading information easier, our team decided to develop a website that provides a choropleth map, a bar graph, a 'daily confirmed cases' chart, an educational video, safety guidelines, and recent news about the monkeypox virus. Nevertheless, the coronavirus is also prevalent in the world, therefore we determined that providing data about the coronavirus is just as important. In regards to the coronavirus, our team has provided a 'daily confirmed cases' chart, a bar graph, an educational video, safety guidelines, and recent news.
What it does🚗
Due to the recent surges in monkeypox, we wanted to create a website that allows users to track the recent covid and monkeypox notices. When the user visits the website, they will be able to view the choropleth map, data tables, charts, and recent news regarding the topic of monkeypox and covid-19.
How we built it👷♂️
While creating this website, we mainly focused on using HTML/CSS along with some JavaScript to retrieve data online. We also utilized some JavaScript libraries such as Chart.js and D3 to produce our graphs and data tables. Along with these JavaScript Libraries, we also utilized the Bootstrap framework in order to customize our webpage.
Challenges we ran into🕸
For most of us, this was our first time dealing with data. So, we had to spend some time researching how to retrieve data from the data provided online. We also had an issue formatting a ton of JSON data to get fetched for our graphs as we were unfamiliar with how node.js works so we had some problems connecting outside data with the code that we have. Lastly, one of our goals was to make our website interactive and up-to-date but we all have never tried using an API to get live data from API servers so we also struggled with making live data on most of our graphs.
Accomplishments that we're proud of🏆
- Utilize Chart.js to make a bar graph that included the recent monkeypox and covid-19 cases
- Converting CSV and JSON data
- Included many interesting Bootstrap Framework
- Grew accustomed to how each team members work and quickly familiarize ourselves with what our strengths and weaknesses are
- Converted CSV and JSON data
- Using embed code to display on site
- Joined our first hackathon
- Completed our project to our satisfaction
What we learned🧠
We become more comfortable with using Bootstrap formats, along with extracting data from CSV files to be displayed on a graph using chart.js. We definitely got better at researching topics that we are unfamiliar with which we all felt is a really important skill. Lastly, we learned how to use GitHub to collaborate with each other and became more familiar with some git terminal commands along with approving each other's pull requests and looking over each other's code to ensure that we are all on the same page.
What's next for Virus Tracker🔮
We would like to utilize APIs in order to provide even more accurate and up-to-date data to the users in real-time. We would also like the website to be more interactive and hopefully add features for users to chat with each other through this website regarding the topic of monkeypox and covid-19.


Log in or sign up for Devpost to join the conversation.