-
-
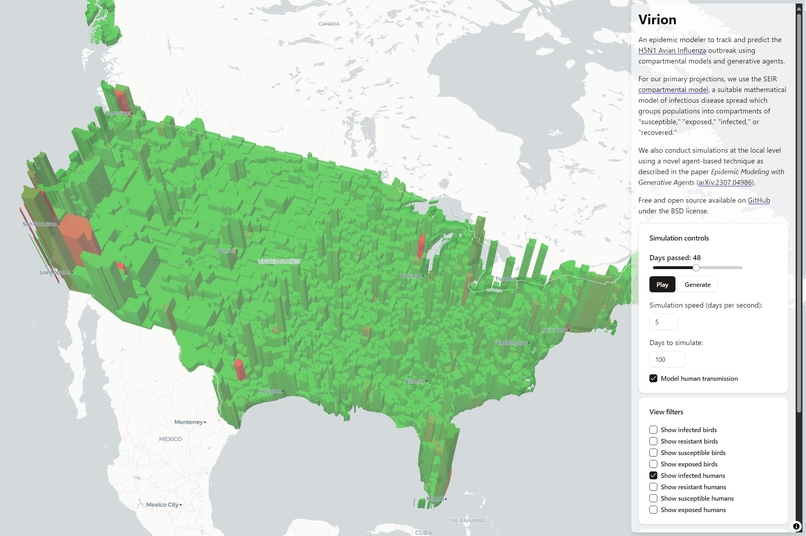
Human Avian Flu Simulation
-
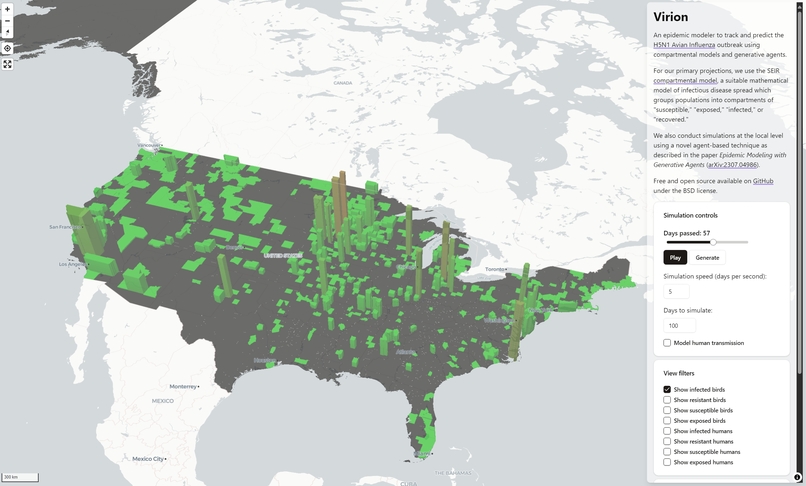
Bird Avian Flue Spread Simulation
-
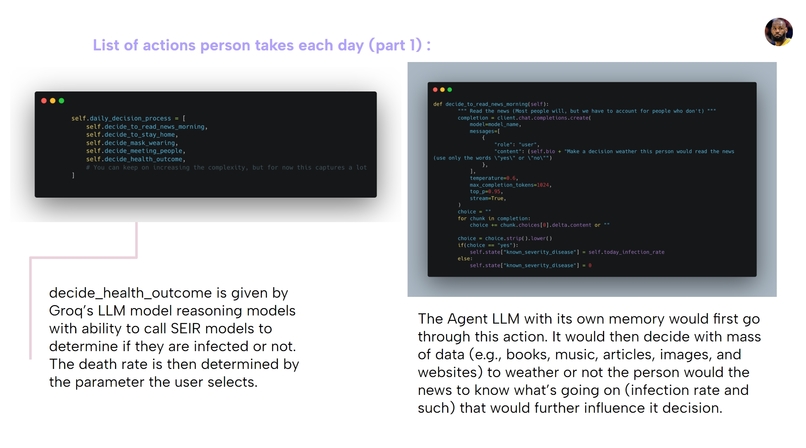
Groq LLM Avian Flu Simulation


Inspiration
The current bird flu epidemic has been on people's mind recently with the increase in chicken egg prices and number of cases and we wanted to see the potential spread of the H5N1 avian flu over time.
What it does
Virion uses an SEIR model to simulate the avian H5N1 bird flu in birds and humans for every county in the United States. It then visually displays the growth over time of the flu through 3D extrusion on a map. There are parameters that the user can alter for the simulations to change the outcomes of them.
How we built it
We used svelte, sveltekit, and typescript to build the frontend. The components are from the Shadcn Svelte Library, and the map is the maplibre library. Our data generated from many different CSVs and the simulations are outputted as Geojson objects.
Challenges we ran into
We had issues with how get all the simulations for each county and mapping that into the United States map. Performance for the simulation were difficult to deal with due to the large of amounts of data generated and visualized. We ran into issues using rate limits with Groq that meant we couldn't incorporate into fully into the final product.
Accomplishments that we're proud of
We are proud of the look and feel of website as well as the techniques employed to create accurate simulations.
What we learned
We learned how to use SEIR models for simulating epidemics. We also learned how LLMs can help simulate epidemics.
Built With
- groq
- haskell
- numpy
- pandas
- svelte
- sveltekit
- typescript


Log in or sign up for Devpost to join the conversation.