-

An interactive map showing previous cases
-

-

Area graph of confirmed cases by region
-

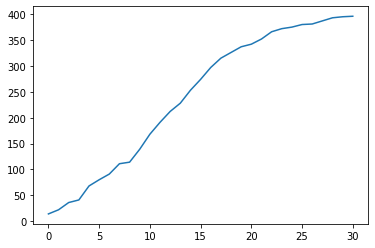
Statistical Modeling for Beijing
-

Number of infections graphed over last 30 days
-

Moving Average model
-

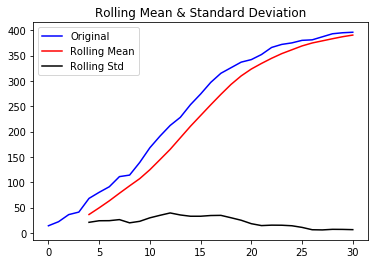
Auto-regressive integrated moving average (ARIMA)
-

Rolling Mean + Standard Deviation
-

A set of predictions for the cases where a) the virus goes uncontrolled and b) the current trends continue


Inspiration
We've seen the devastating impact the new virus has had on millions of victims, from shutting down entire cities to orphaning young children. We've determined to use our skills to the best we can, and conjured this app to prevent more nations from falling under the virus's grasp.
What it does
Our app takes in real data from reports of cases of the virus (that include specific information, and were updated just several hours ago with more) and trains a machine learning model to attempt to predict the spread of the virus in the future. It provides this data with an interactive map that can show the user the spread of the virus in the past month, as well as where the model predicts it will spread in the future (using a heatmap). To help both businesses and civilians, we've added a feature that helps those who need to travel during this time, and uses an algorithm to provide them with routes with the least amount of risk.
How we built it
We used the IBM-z to run our machine learning model (a polynomial regression), and trained it on datasets obtained from researchers at Johns Hopkins University. We then use this model to take the given data, stored in MongoDB Atlas, and then use the model to create predicted data, which is passed from MongoDB to our Node.js server via a HTTP request. The Node server then inputs this information into the Tableau interface, which graphs it in both map and area graph form. It also uses a html form to ask the user for their trip plan, and displays the results of the trip on a Google Maps API.
Challenges we ran into
Using Tableau/Google maps to plan multiple-stop flights is technically impossible with their current technology, so we improvised and used polyline. Overall, we each specialized in certain parts of the project and combining them all into one product that seamlessly transitions was a big group effort.
Accomplishments that we're proud of
We're proud of the technical complexity of this project, which required an enormous amount of collaboration and communication. Providing the most helpful experience for the end user is paramount to how much of a social impact this can make, and we've worked nonstop to make that happen.
What we learned
This was our first time using Tableau, and we realized that it's a really powerful tool, although not super easy to embed. We learned the many different ways we could utilize google cloud from using their app engine, to using their Google Maps API. None of us had experience using the IBM-z's data analytics nor machine learning capabilities, and it was really fascinating to learn about them.
What's next for Viral Protector
We'll deploy this to give the world another tool in their fight against both the virus, and irrational fear. We'll also contact businesses which need employees to travel to develop a better algorithm to optimize flight cost, time, and risk.
Built With
- bootstrap
- css
- ejs
- express.js
- google-app-engine
- google-cloud
- google-maps
- html5
- ibm-z
- javascript
- jupyter-notebook
- matplotlib
- mongodb
- node.js
- npm
- numpy
- pandas
- python
- sci-kit-learn
- tableau


Log in or sign up for Devpost to join the conversation.