-
-

Logo (made with Figma)
-
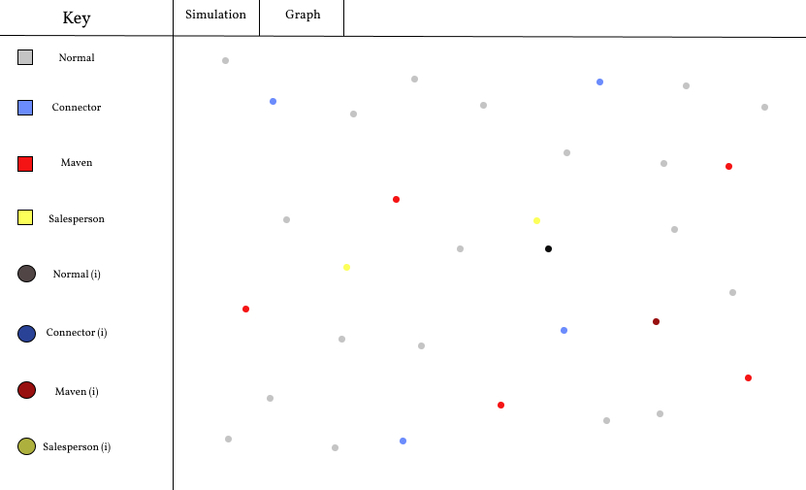
A mockup of the grid itself with a useful key. (made with Figma).


Inspiration
In a pandemic-ridden world, disease modeling has become a familiar norm for the general population. However, as the Covid-19 pandemic ravaged the world, the fear and panic it induced led to an equal surge of the misinformation pandemic. While information spread online can sometimes be helpful, harmless, or silly, misinformation has potentially disastrous consequences when cultivated and spread in cyberspace.
In the book, "The Tipping Point", journalist Malcolm Gladwell synthesizes existing mathematic representations of epidemic models to describe his so-called "tipping point" phenomena. In this phenomenon, ideas are seen to go from unknown to viral in a sudden, unexpected, and outsized manner.
By modeling the spread of ideas as if they were tangible and traceable, the question is begged as to whether understanding such a model could assist in harnessing the factors that positively enforce the spread of information for the greater good. Through utilizing this model to enhance the factors that lead to Virality, campaigns for public health awareness, social justice movements, or even marketing and promotional research can be better executed.
Here's a link to the book on Malcom Gladewell's website, which we referenced during our planning phase: link
What it Does
The simulation first accounts for a user-selected population size of "People" and the proportion of "Superspreaders." This population is put into a dataset and graphed on an x-y plane to simulate social spheres through distance proximity between two points that represent people. This simulation considers several factors to determine the spread of a piece of information. The first factor comes from the idea, which is known as its stickiness factor. The second factor comes from the three different "superspreader" types, being the Maven, Connector, and Salesperson, which each have higher probabilities of spreading the disease. Both of these factors together help to determine whether the idea will spread to an uninfected person, so long as their position on the x-y plane is in range. Infected "people" dots will change color to simulate their infection. Infected "people" can spread the information. The simulation shows at what point the population reaches a "tipping point," as in the rate of spread becomes rapid and out of control. Each round of the simulation is representative of the time in days, and the data for infection is graphed on an adjacent graph.
How we built it
We utilized Eclipse and a shared Git repository to implement the several classes which control the simulation and the main graph. The main class contains the main loop and it has an update method. All of the other classes have corresponding update methods for their various functions. Each of us conquered separate parts of this project, starting from the simulation itself and implementing downwards to the methods it would need to retrieve relevant data. We used our knowledge of JavaFX, Object-oriented programming, and Git to implement the many complicated aspects of our simulation.
Challenges we ran into
Conceptually, many of the ideas were difficult to translate into mathematical terms, especially when what is being measured is something as subjective as an idea. While the model is heavily inspired by disease modeling, the two do not conceptually have a one-to-one comparison in their behavior. Additionally, other parts of Gladwell's model were hard to translate into code. For instance, it was difficult to quantify the different kinds of "Superspreaders" for information, as well as the statistics that constituted an "infection" (the acceptance of an idea). For more specific and real-world applications of this program, many of these parameters would come from statistical analysts and marketing research, but we were left with the task of approximating and implementing these parameters ourselves.
On the technical side, we had a lot of trouble getting our git repositories to sync properly and cooperate with eclipse, as none of us had any real experience using collaboration on Git. Additionally, there were several programming methods we utilized that we were previously unfamiliar with, so we had to teach ourselves new methods.
Accomplishments that we're proud of
As first-time Hackathoners and a team comprised of 3-4 beginner programmers, many of the challenges we faced came from learning the next concepts as we went. There were times when it felt like nothing was going our way, but we're very proud of the fact that we never faltered as a team or blamed each other for the problems, but rather found the best ways to solve them as a team. We are proud of the team's work ethic to accomplish huge tasks in only a short amount of time. We are proud of the humor and fun that carried through elements of this project which we feel represent the spirit of our team, and the finished product that functions just like our original concept. We learned a lot, made a working product, and had a lot of fun, which is exactly what we had hoped to accomplish at our first Hackathon.
What we learned
We learned a lot about syncing our workspaces over Github, as well as the best ways to avoid inconsistencies and conflicts. We sharpened our skills in encapsulating classes and picked up plenty of new tricks in Java FX. We also learned a lot about taking abstract concepts and social phenomena and applying them in a concrete, mathematical form with code that can change and adapt to better suit real-world conditions. We also learned about how incredible the Hackathon experience and community is. We look forward to participating in more in the future.
What's next for Viral
We hope to expand our model in the future to account for more variability that mirrors real-world conditions, allowing artificial intelligence to dictate the behavior of the "people" who would have more advanced behaviors based on more developed parameters. Additionally, we hope to hone in on specific aspects of an idea that contribute to its "stickiness" factor and quantify them based on real-world survey data. We hope that this framework could someday be further developed into a tool for simulating the online information landscape that every day becomes a more relevant part of our lives. We also want to add a more user-friendly interface, with more information on the simulation available to the user.


Log in or sign up for Devpost to join the conversation.