-
-
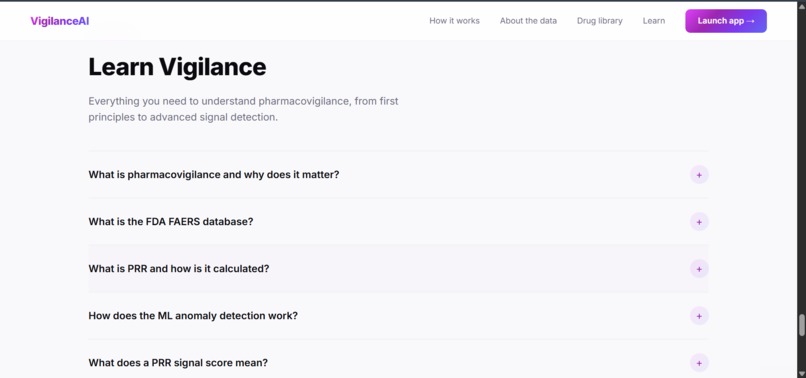
Know how VigilanceAI works
-
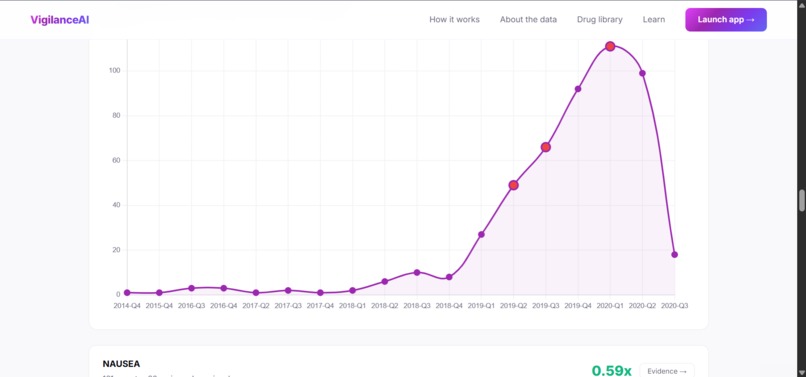
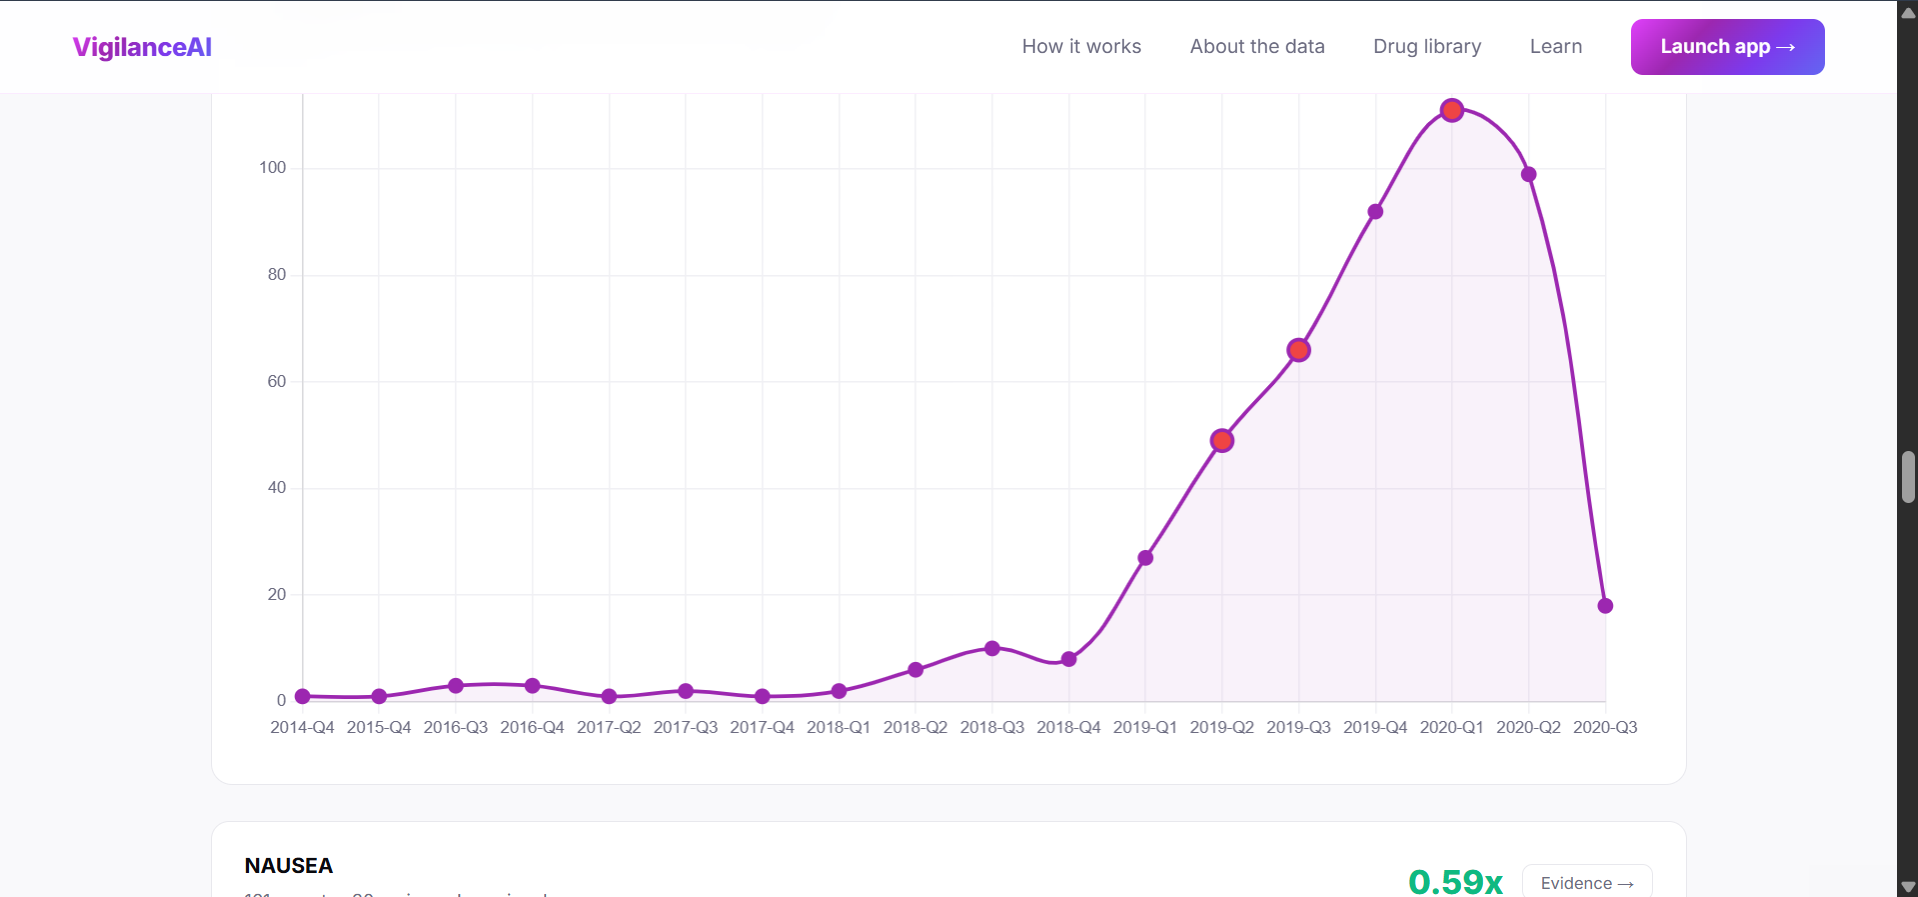
Machine learning Anomaly Detection
-
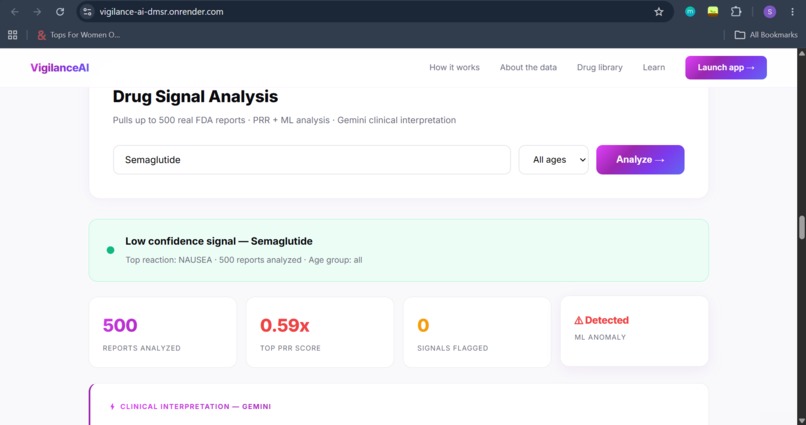
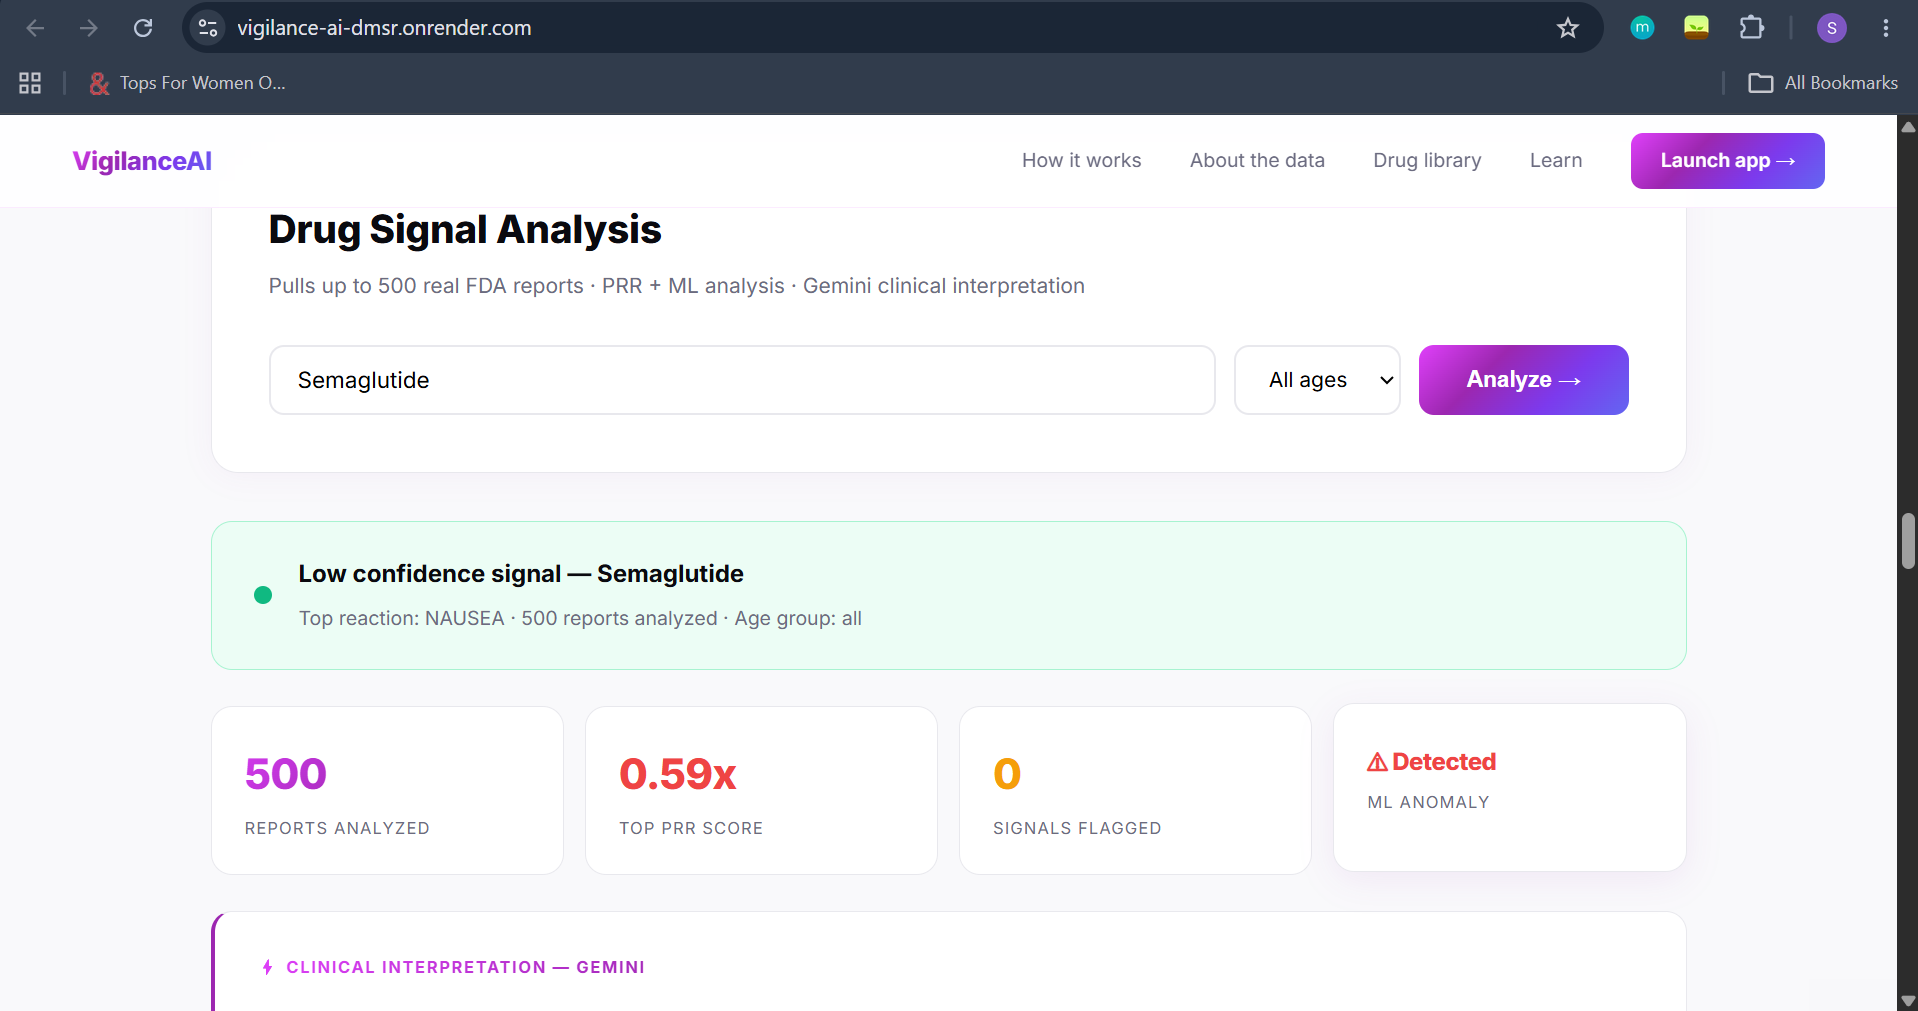
Real-time PRR signal detection and Gemini clinical interpretation for Semaglutide
-
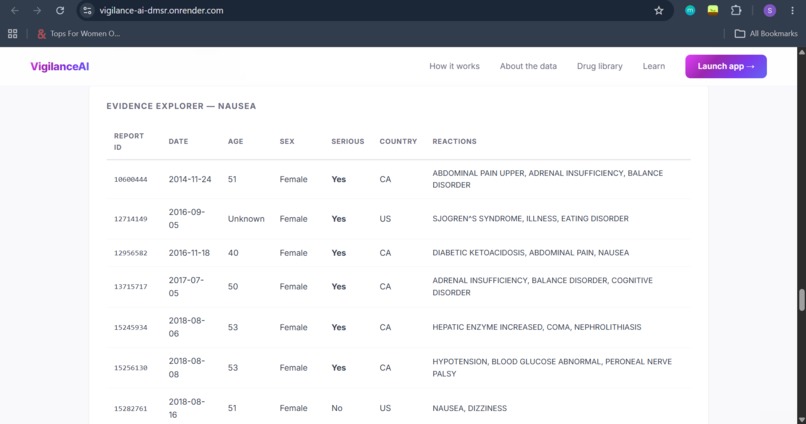
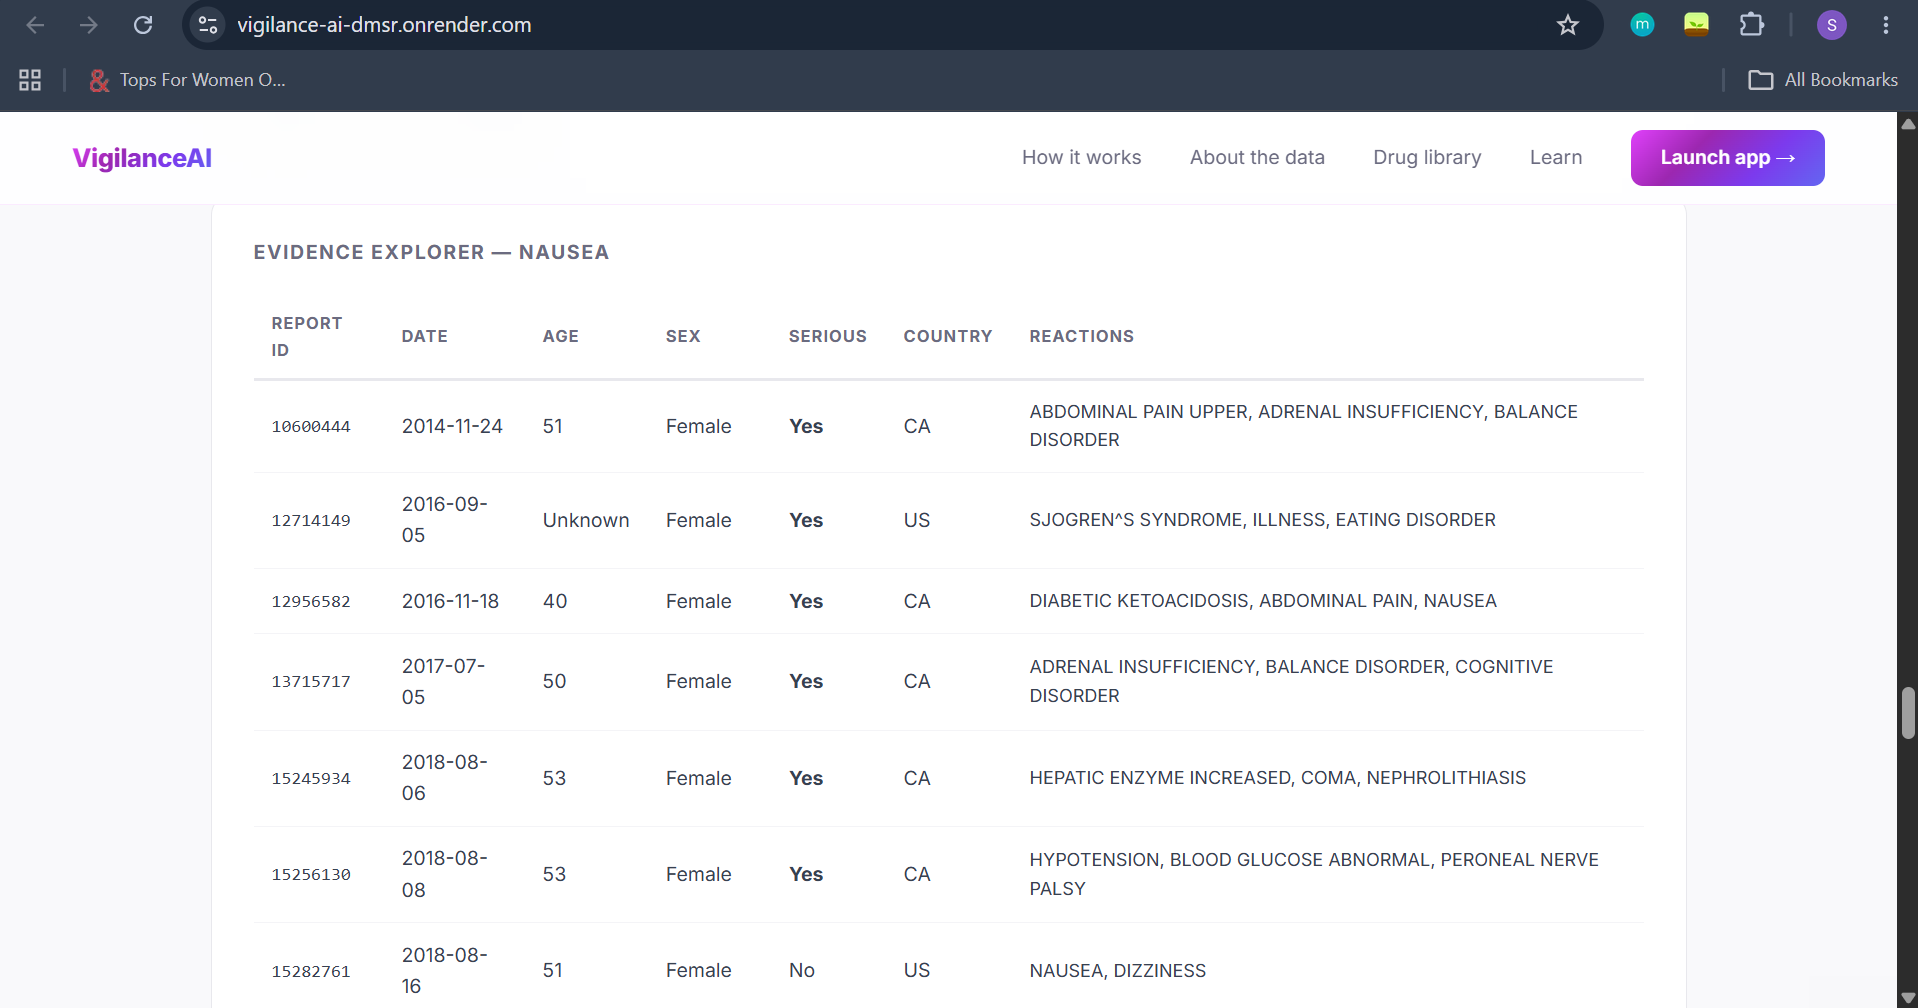
Evidence Explorer showing traceable raw FDA report IDs, patient demographics, and reactions
-
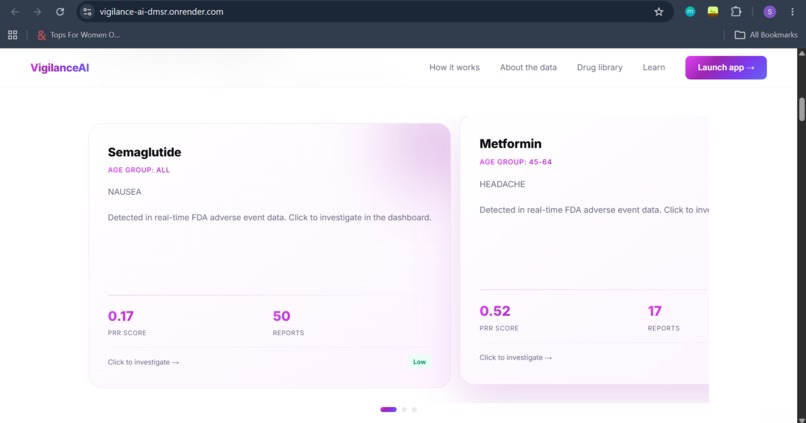
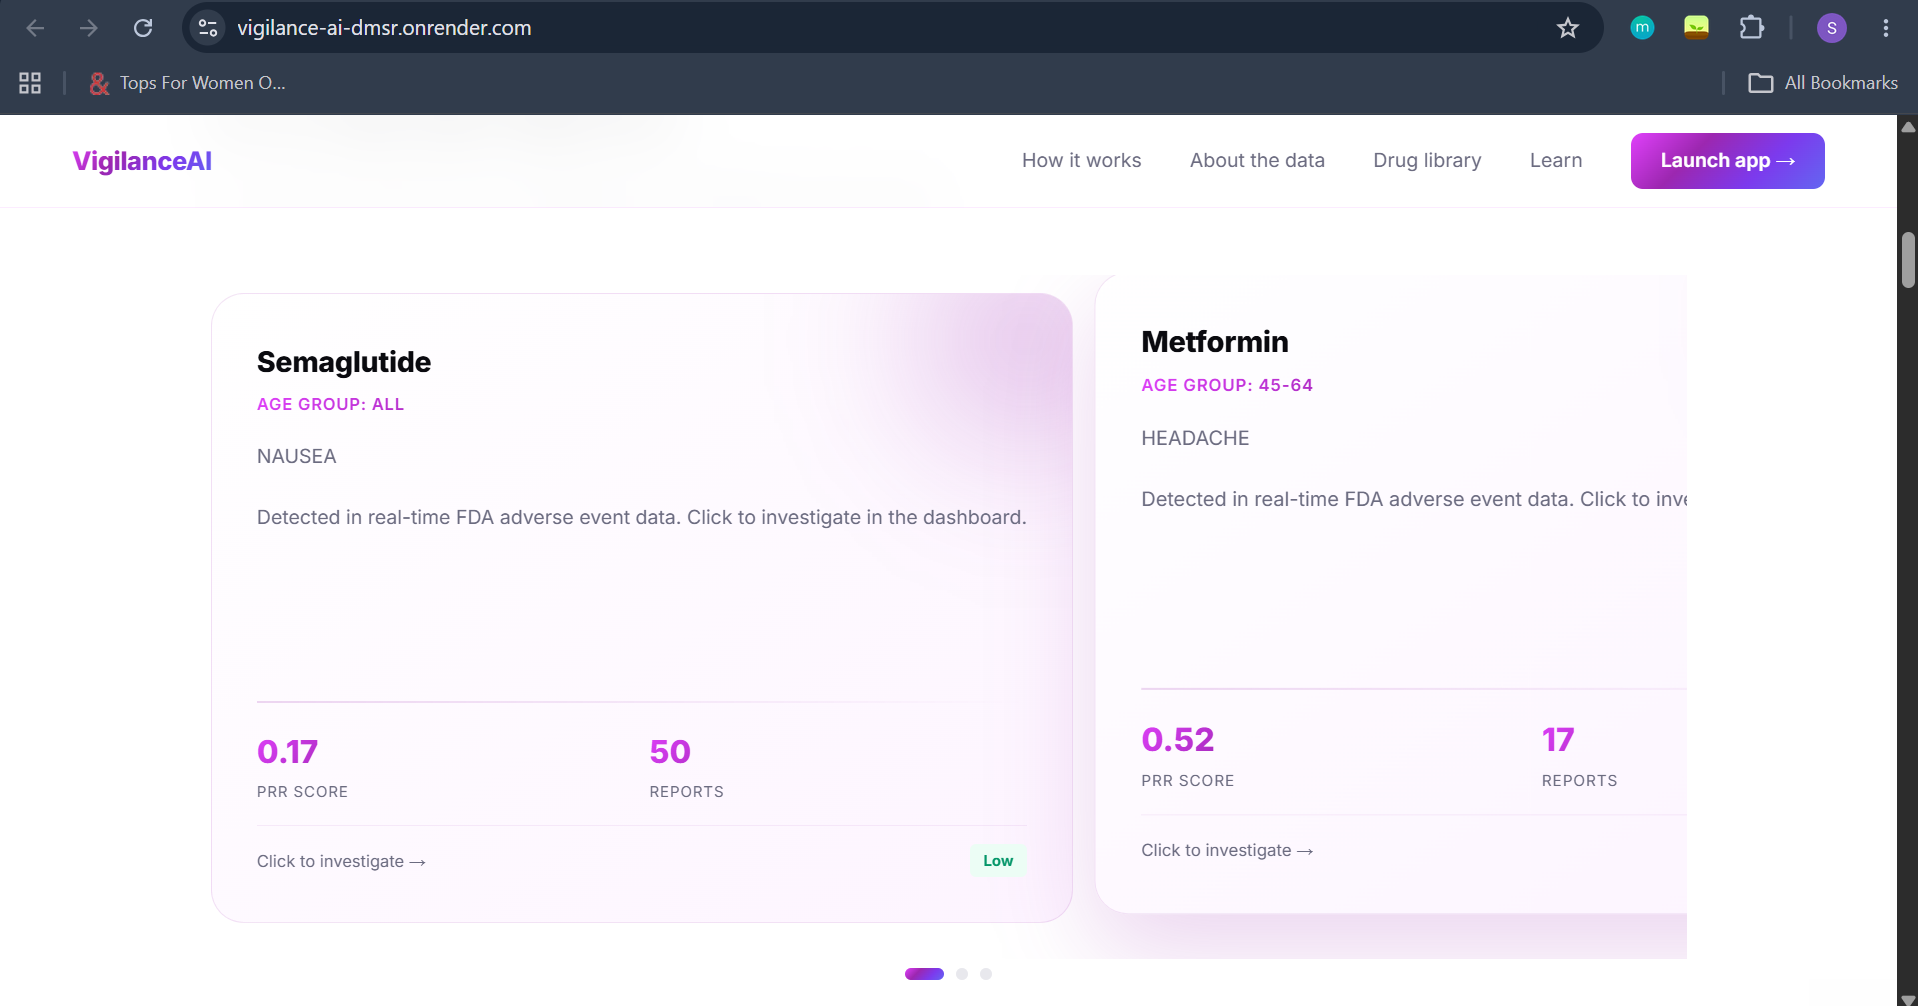
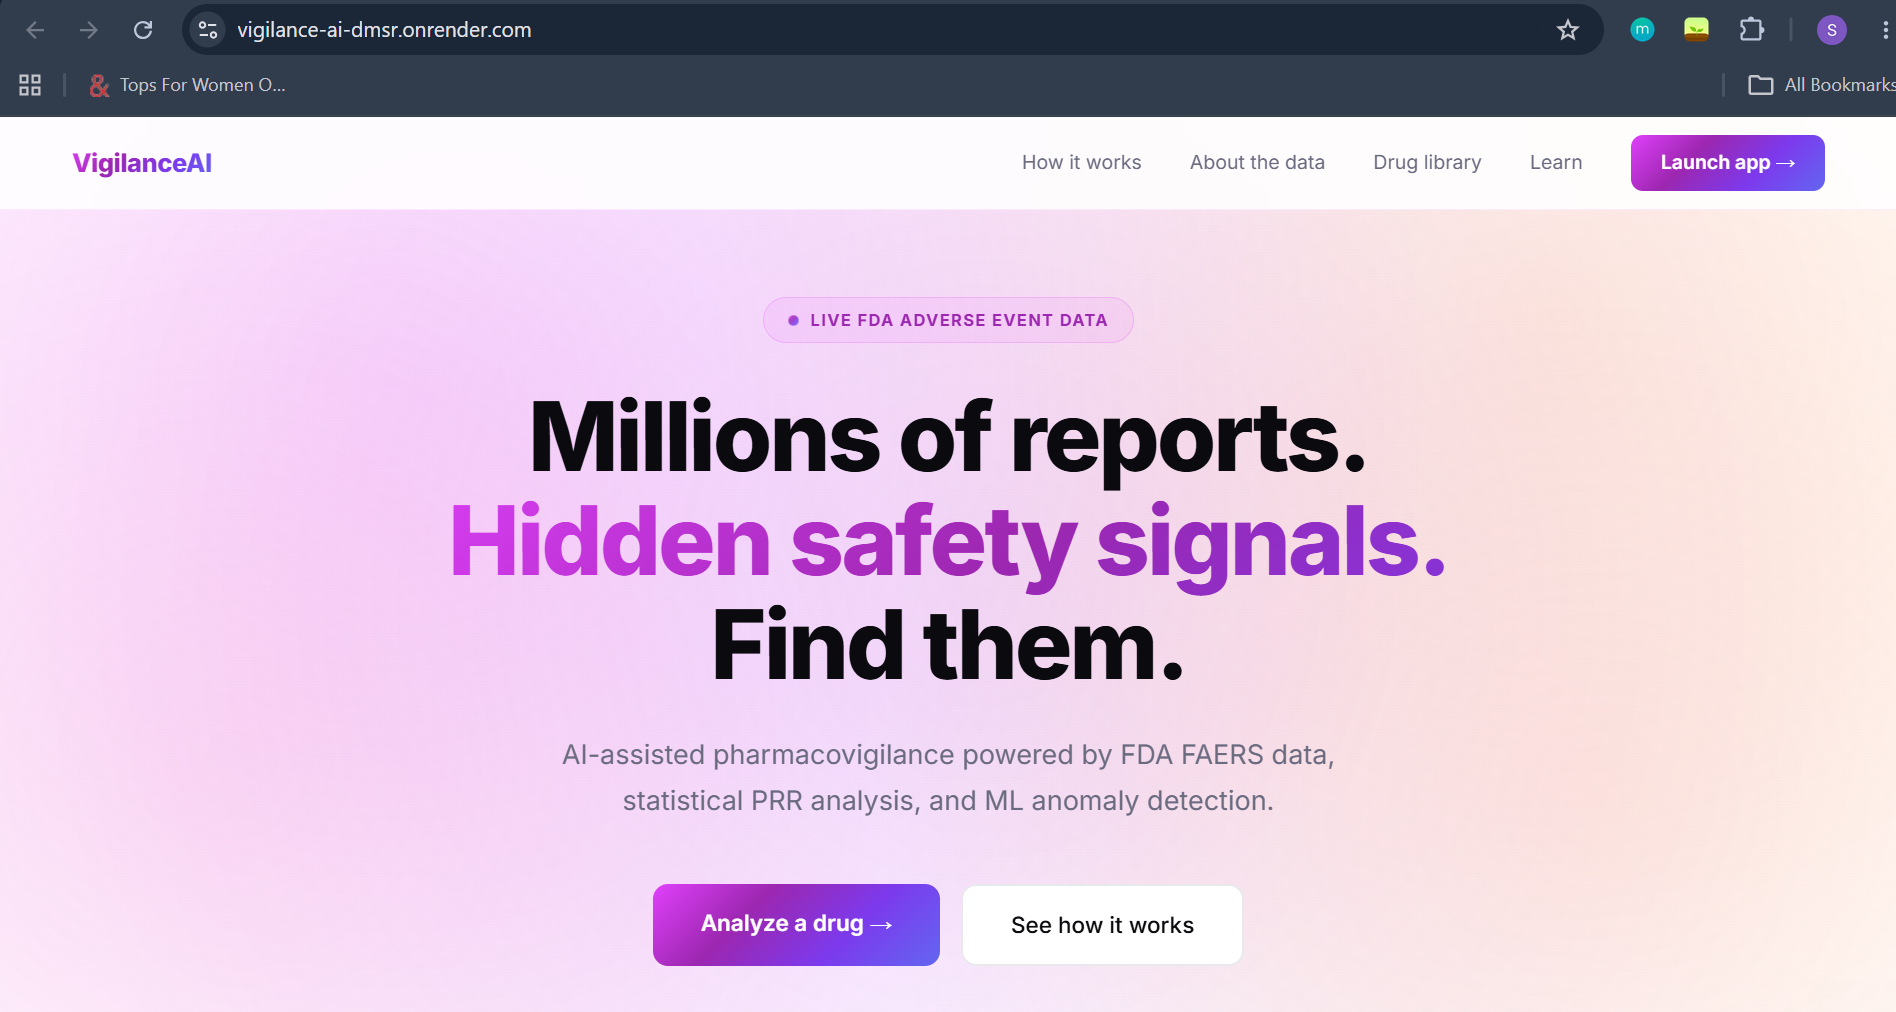
VigilanceAI landing page with live FDA adverse event signals loaded from real FAERS data
-
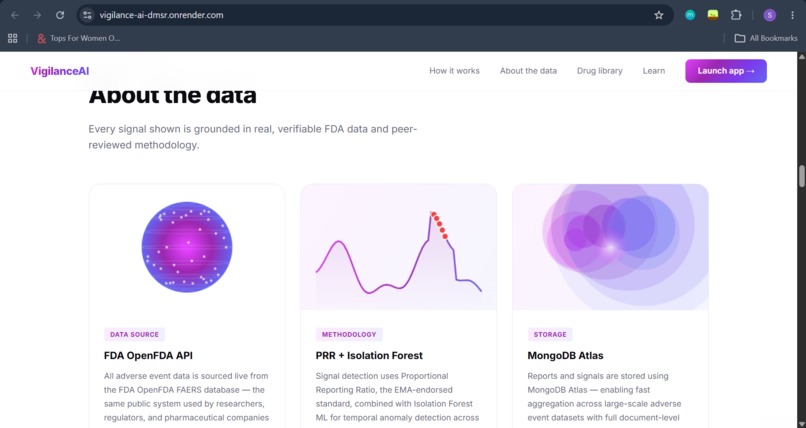
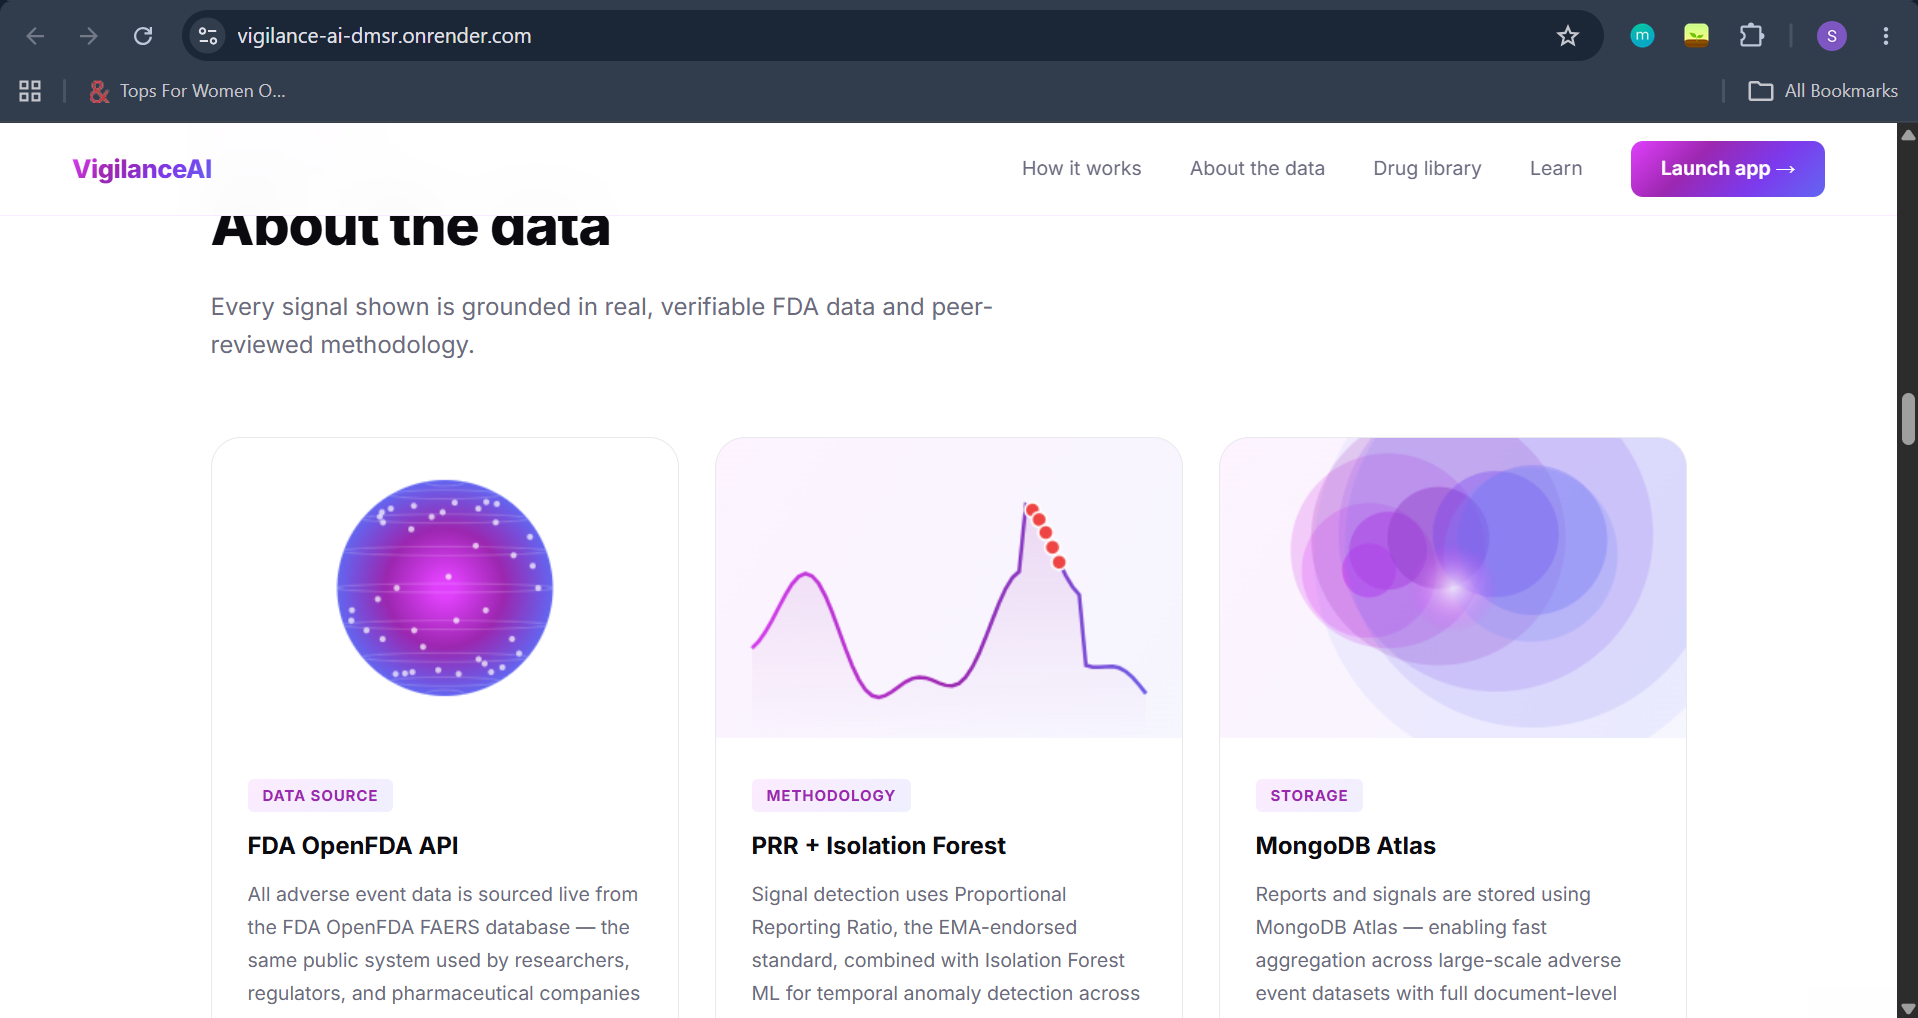
How we got the data
-
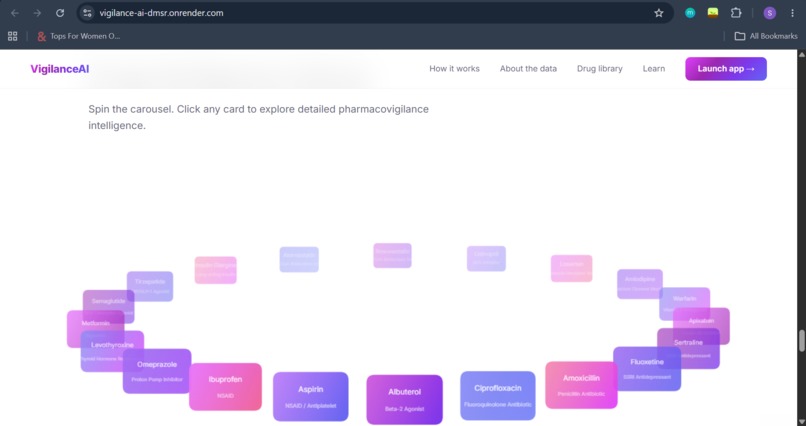
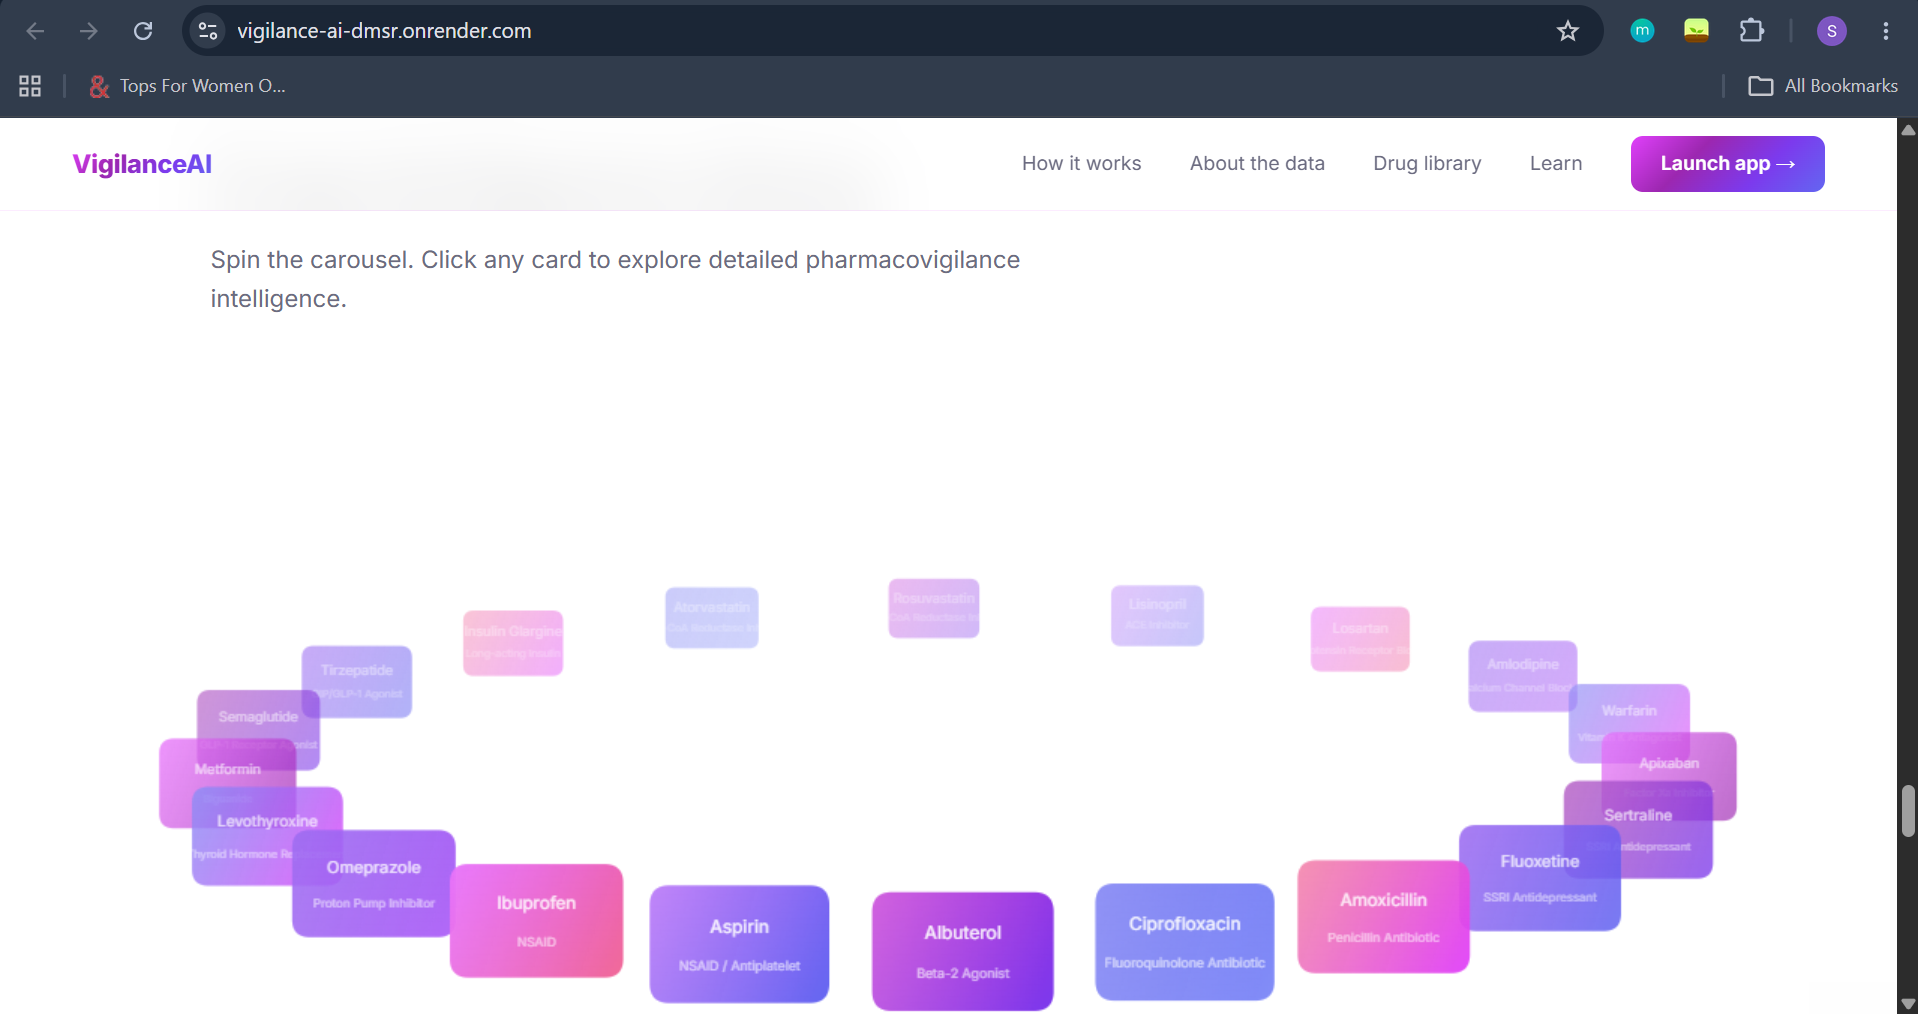
Drug Intelligence Library provides pharmacovigilance profiles for commonly monitored medications and allowing users to directly search
-
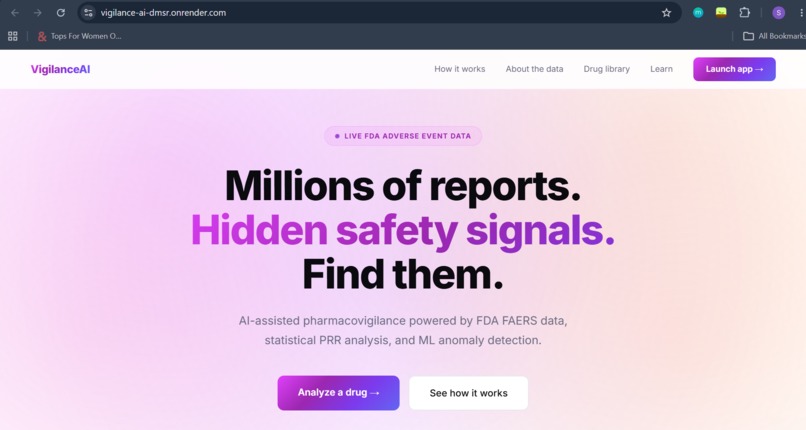
VigilanceAI landing page with live FDA adverse event signals loaded from real FAERS data
The Problem That Wouldn't Leave Me Alone
In 2024, the FDA issued over 1,800 drug safety communications. In 2025, GLP-1 drugs like Ozempic and Mounjaro reached 40 million users globally with post-market adverse event reports growing faster than any surveillance team can manually review. The signals are real. The volume is unmanageable. And the gap between when a signal appears in FAERS data and when regulators act costs lives. That gap still exists today.
The FDA's FAERS database contains over 20 million real adverse event reports. Pharma companies pay enterprise software vendors $500,000+ per year to monitor these signals manually. Researchers and smaller institutions simply can't afford it. And every day that a signal goes undetected is a day someone gets hurt by something that could have been caught.
I built VigilanceAI to close that gap using real FDA data, real epidemiological methodology, and AI.
What VigilanceAI Does
VigilanceAI is a pharmacovigilance signal detection agent. A user types any drug name. The system:
- Fetches up to 500 real adverse event reports live from the FDA OpenFDA API
- Calculates the Proportional Reporting Ratio (PRR) the exact statistical method endorsed by the FDA, WHO, and European Medicines Agency for signal detection
- Runs Isolation Forest unsupervised ML on quarterly reporting trends to flag temporal anomalies spikes in reporting that don't match historical patterns
- Passes the statistical findings to Gemini 2.5 Flash, which generates a structured clinical signal assessment with severity classification and recommended regulatory action
- Returns a full intelligence report including flagged signals, a time-series chart with anomaly markers, and an Evidence Explorer showing raw FDA report IDs
No mocked data. No hardcoded responses. Every result is grounded in real FDA records.
The Math Behind It
The core signal detection uses Proportional Reporting Ratio:
$$PRR = \frac{drug_reaction / drug_total}{all_reaction / all_total}$$
A PRR ≥ 2.0 with at least 3 cases constitutes a signal requiring investigation this is the EMA standard. A PRR ≥ 5.0 is classified as Critical.
On top of PRR, Isolation Forest examines quarterly adverse event frequencies. It identifies quarters where reporting volume is statistically isolated from the normal distribution catching emerging safety issues that static ratio analysis alone would miss.
Gemini is used exclusively as an interpretation layer it never generates signals. It reads the PRR scores and anomaly flags and translates them into clinical language a pharmacovigilance analyst can act on.
How I Built It
Backend: Python + Flask, with MongoDB Atlas as the document store for aggregation and evidence traceability. The signal detection pipeline runs entirely server-side signals.py handles PRR + Isolation Forest, faers.py handles FDA API ingestion and evidence retrieval, agent.py handles the Gemini layer, and routes.py exposes clean JSON endpoints.
Frontend: Pure HTML, CSS, and JavaScript no framework overhead. Chart.js renders the interactive quarterly trend chart with anomaly markers highlighted in red. The Drug Intelligence Library is a canvas-based 3D carousel of 20 drugs with pharmacovigilance profiles. The live signal feed pre-fetches real data on every page load.
Deployment: Render (live at https://vigilance-ai-dmsr.onrender.com)
Challenges
The FDA API rate limits aggressively. I had to build a caching layer so live signals on the landing page don't re-fetch on every visit first call warms the cache in a background thread, all subsequent calls return instantly.
Isolation Forest needs enough data points to be meaningful. With fewer than 4 quarterly data points, the algorithm can't make reliable predictions. I added a fallback so thin datasets degrade gracefully rather than crashing.
Making Gemini useful without making it hallucinate. The key was never asking Gemini to find signals only to explain signals the math had already found. The prompt feeds it PRR scores, reaction counts, and anomaly flags, and asks for clinical language. It never makes up numbers.
What I Learned
Building this forced me to understand pharmacovigilance as a field not just as a programming problem. PRR is genuinely the method regulators use. FAERS is genuinely the database that shapes drug safety policy. When the system flags a signal, it's using the same logic a real analyst at the EMA would use.
That's the thing I'm most proud of. This isn't a demo pretending to be a real system. It's a real methodology, running on real data, explained by AI.
Results
Tested across 20 commonly prescribed drugs including Atorvastatin, Semaglutide, Metformin, Warfarin, and Sertraline.
- Successfully fetched and analyzed up to 500 live FAERS reports per query
- Generated PRR-based signal assessments using real FDA adverse event data
- Detected temporal anomalies in historical quarterly reporting trends via Isolation Forest
- Every signal output is traceable back to original FDA report identifiers
- Clinical interpretations generated by Gemini reference only statistically derived findings — no hallucinated data
Why VigilanceAI Matters
- Traditional pharmacovigilance platforms cost $200,000–$500,000+ annually pricing out researchers, smaller hospitals, and public health institutions entirely
- VigilanceAI performs automated signal detection using publicly available FDA data, making regulatory-grade analysis accessible without enterprise licensing
- Every alert is backed by traceable FDA report evidence and established epidemiological methodology not black-box AI outputs
Regulatory-Grade Methodology
VigilanceAI uses the same Proportional Reporting Ratio (PRR) methodology employed by the FDA, European Medicines Agency (EMA), and WHO for post-market pharmacovigilance signal detection. This is not a custom scoring system it is the peer-reviewed, internationally endorsed standard for disproportionality analysis in adverse event surveillance.
Built With
- Python, Flask
- MongoDB Atlas
- Google Gemini 1.5 Flash API
- FDA OpenFDA FAERS API
- scikit-learn (Isolation Forest)
- NumPy
- Chart.js
- Render


Log in or sign up for Devpost to join the conversation.